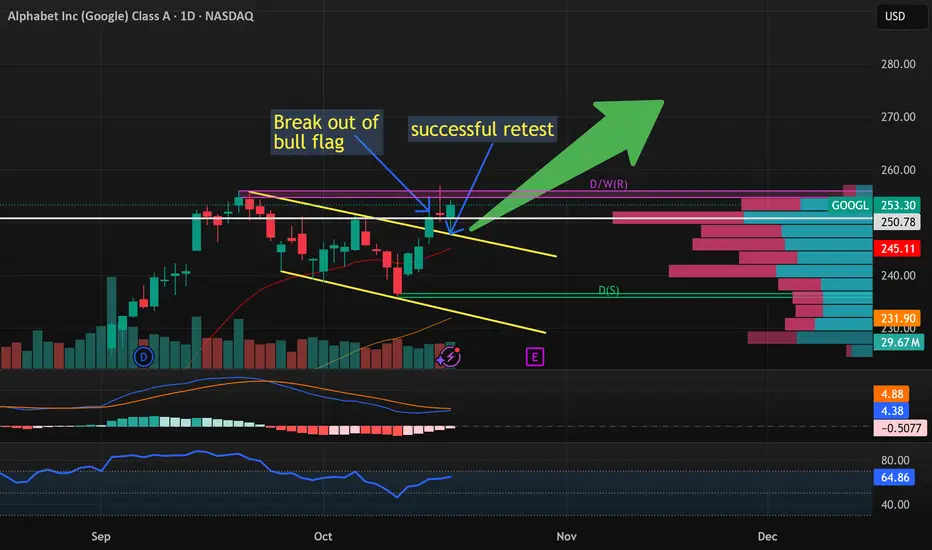
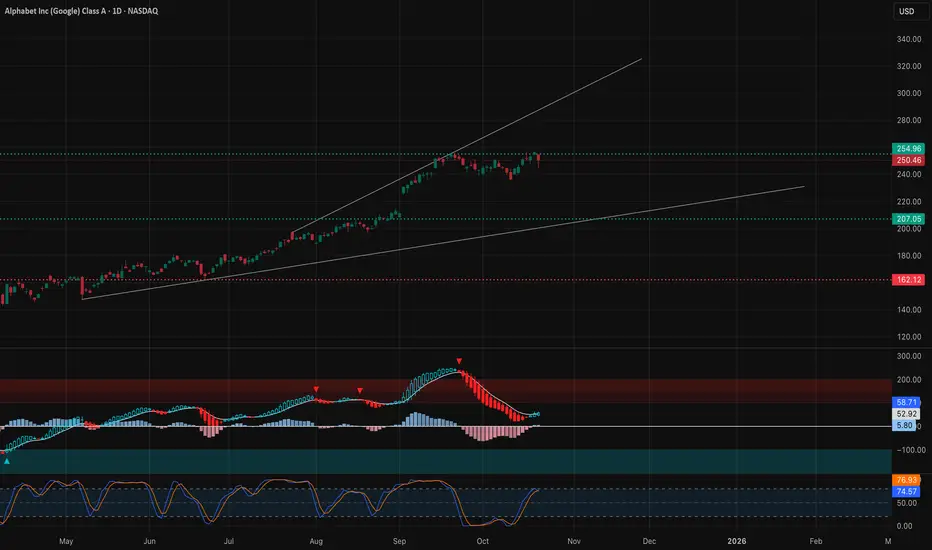
Bull run for GOOGL incoming?Google just pushed out of it's bearish flag channel. Then, on Friday it successfully retested it.
Trading at a forward of P/E of 19.6x which is the lowest of all the Mag7.
Ideally I'd like to see GOOGL break the ATH support and trade the breakout.
But that this point already, I will likely begin to open a long position.
Ideally this doesn't happen so close to earnings (As it can blow up the entire pattern), but I think it's still worth a shot.
Trade ideas
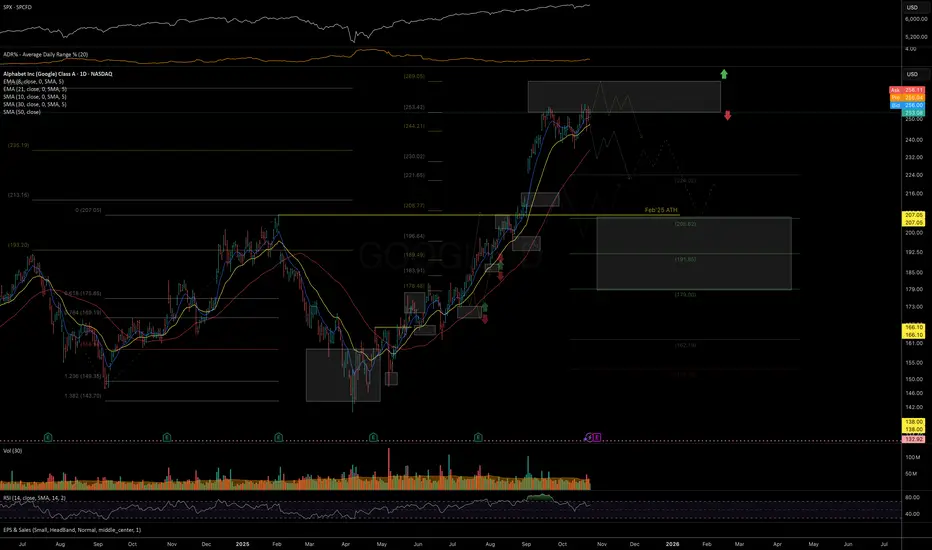
GOOGL: price at important resistance zonePrice has been following the outlined structure from the July and August updates, showing the expected relative outperformance versus SPX. However, instead of forming a prolonged Autumn consolidation, price moved almost directly to the target resistance zone for the uptrend since the April bottom: 250–270.
While one more short-term push toward the top of the resistance zone is possible, as long as price remains below 270, I am watching for rising selling pressure and a potential durable consolidation to develop in the coming weeks. If price manages to post a sustained breakout above 270, the current structural view would need to be reassessed.
Caution is advised with any new long exposure at these levels, and consider protecting open long positions in case of a reversal or broader market weakness.
Chart:
Previously:
• On resistance and potential consolidation (Aug 29):
Chart:
Link: www.tradingview.com
• On local support (Aug 11):
Chart:
Link: www.tradingview.com
• On upside potential & relative strength vs SPX (Aug 5):
Link: www.tradingview.com
• On breakout setup (Jul 13):
Chart:
Link: www.tradingview.com
Is This the Perfect Entry Zone for the Next GOOGL Upside Run?🎯 GOOGL: The "Thief's Heist" Trading Strategy | Layered Entry Playbook 📊
💼 Asset: ALPHABET INC. (GOOGL)
Market: NASDAQ | Style: Swing/Day Trade Hybrid
🎭 The Setup: Bulls Running the Show
Bias: 🟢 BULLISH
Listen up, trading family! 👋 GOOGL is setting up what I call the "Thief's Entry Strategy" - a layered approach that lets you accumulate positions like a professional poker player stacking chips. No FOMO, no chasing - just calculated, methodical entries that would make Ocean's Eleven jealous. 🎰
🚪 Entry Strategy: The "Thief Layering" Method
Instead of going all-in at one price (rookie move 🙅♂️), we're using multiple limit orders to build our position:
📍 Layered Buy Limits:
Layer 1: $240.00
Layer 2: $245.00
Layer 3: $250.00
💡 Pro Tip: You can add more layers or adjust levels based on your risk appetite and account size. This method reduces average cost and minimizes timing risk - basically, you're stealing better prices while everyone else panic-buys at the top! 😎
Alternative: If you prefer simplicity, current market price entry works too - but where's the fun in that? 🤷♂️
🛡️ Risk Management: The "Escape Route"
Stop Loss: $235.00
⚠️ Reality Check: Dear Thief OG's (Original Gangsters of Trading), this is MY stop loss level based on technical structure. YOU need to assess your own risk tolerance, position size, and account management rules. Your money = your rules. Trade at your own risk, always! 🎲
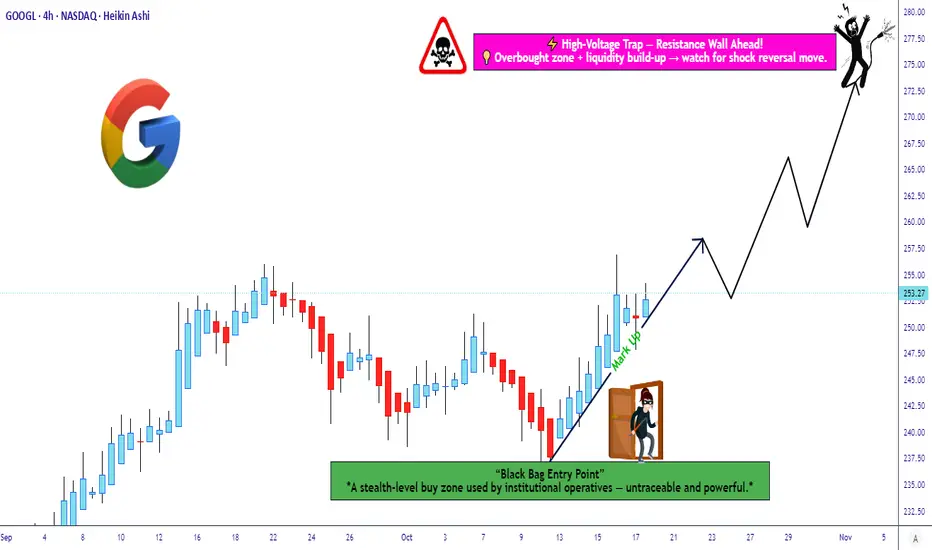
🎯 Target Zone: The "Electric Fence"
Take Profit: $275.00
This level represents a confluence of:
⚡ Strong resistance zone (high voltage wall!)
📈 Potential overbought conditions
Bull trap territory where late buyers get caught
Strategy: Scale out as we approach target. Don't be greedy - banks get robbed, but smart thieves get away clean! 💰
⚠️ Reality Check #2: This is MY target. You might want to take profits earlier, hold for more, or scale out in portions. Your trading plan, your decision. Secure the bag at your own discretion! 💼
🔗 Related Pairs to Watch (Correlation Play)
Keep your eyes on these tech titans - they often move in sympathy:
NASDAQ:MSFT - Microsoft Corp | Big tech correlation, AI play
NASDAQ:AAPL - Apple Inc. | FAANG/tech sector leader
NASDAQ:META - Meta Platforms | Ad revenue correlation with GOOGL
NASDAQ:NVDA - NVIDIA | AI infrastructure play
NASDAQ:QQQ - Nasdaq 100 ETF | Overall tech sector health indicator
Why it matters: If these pairs show weakness, GOOGL might follow. If they're pumping, wind's at our back! 🌊
📊 Key Technical Points
✅ Support holding at current structure
✅ Bullish momentum building on lower timeframes
✅ Risk-reward ratio favorable with layered entries
✅ Volume profile suggesting accumulation phase
🎬 The "Thief Style" Philosophy
This isn't financial advice - it's a trading game plan based on technical analysis and strategic positioning. The "Thief" approach means:
Stealth entries (layering in)
🧠 Smart exits (not overstaying the party)
🎯 Calculated risk (always know your out)
🎪 Having fun while staying professional
📉 Trading involves substantial risk of loss and is not suitable for everyone. Past performance is not indicative of future results.
✨ If you find value in my analysis, a 👍 and 🚀 boost is much appreciated — it helps me share more setups with the community!
🏷️ Tags:
#GOOGL #Alphabet #StockMarket #SwingTrading #DayTrading #TradingStrategy #TechnicalAnalysis #StockAnalysis #NASDAQ #TechStocks #LayeredEntry #RiskManagement #TradingIdeas #PriceAction #SupportAndResistance #ThiefStrategy #FAANG
Trade smart, stay safe, and remember: the market doesn't care about your feelings - only your strategy matters! 🎯💪
GOOGL Oct. 22–24 Outlook: “Alphabet Midweek Breakout SetupBulls Eye $260 Gamma Target into Friday Close 🔥
🕒 Daily Timeframe – Macro Bias and Market Structure
GOOGL remains in a strong macro uptrend, riding the ascending channel it’s respected since summer.
Recent structure shows a CHoCH → BOS → CHoCH pattern near the $250–$255 range, signaling that smart money has been reaccumulating after the mid-October pullback.
The $245 area acted as a liquidity sweep and re-entry base. Price has since reclaimed higher structure and continues to respect the channel trendline.
* Trend: Bullish
* Key Support: $245–$246
* Immediate Resistance: $257–$259
* Macro Target: $262–$265 range if $257 breaks
* Indicators:
* Daily 9 EMA > 21 EMA slope remains bullish.
* MACD histogram rising from negative territory — early bullish continuation signal.
* Volume supports steady accumulation, no blow-off tops seen.
Summary: Daily trend still favors buyers; structure suggests preparation for another leg up once $257 is reclaimed.
⏰ 1-Hour Timeframe – Short-Term Trend and Smart Money Structure
On the 1H chart, GOOGL shows a clear liquidity sweep below $246 last week followed by a strong CHoCH at $252 and a BOS over $255, confirming reaccumulation.
Price is holding above intraday demand at $252–$253, and bulls are attempting to reclaim the critical $257 level. If a 1H candle closes above $257 with volume, expect momentum expansion toward $260–$262.
* Trend: Bullish Bias
* Support Zones: $252.4–$253.0 and $245.8–$246.0
* Resistance Zones: $257.0–$259.0 (BOS + GEX wall)
* Indicators:
* 9 EMA curling above 21 EMA — bullish transition forming.
* MACD turning positive, histogram rising.
* Volume showing renewed demand after Friday’s flush.
Summary: Holding above $252 confirms buyers in control. A clean breakout above $257 triggers continuation toward the next liquidity pool.
📉 15-Minute Timeframe – Intraday Structure & Entry Precision
The 15M chart reveals a breakout from a descending wedge with multiple CHoCH → BOS confirmations, marking a clear momentum shift to the upside.
However, there’s still friction near $257.3 — a level acting as both supply and local liquidity cap. Expect short-term consolidation between $252–$257 before the next impulse move.
* Bullish Entry: Above $256.5 on strong candle close.
* Scalp Targets:
* T1: $257.5
* T2: $260–$262
* Stop-Loss: Below $252.2 (beneath demand block and EMA support).
* Bearish Setup: Rejection above $257 followed by CHoCH → BOS down confirmation.
* T1: $252.5
* T2: $247.5 (liquidity + GEX defense).
* Indicators:
* 9 EMA > 21 EMA crossover imminent.
* MACD bullish crossover, histogram rising.
* Stoch RSI mid-zone reset — room for continuation.
Summary: Momentum is building for an upside breakout. Watch $252 for demand defense and $257 for breakout validation.
💥 GEX & Options Sentiment – Dealer Positioning and Gamma Map
The GEX chart paints a clear picture of where dealer positioning could steer price action:
* Positive Gamma Zone: $255–$262 (dealer stability zone).
* Key Call Walls: $257.5 → $260 → $262.5 — each a step toward potential gamma expansion.
* Put Support: $247.5 and $242.5 — major defense levels tied to negative gamma.
* Neutral Pin Zone: $252–$255, likely area of consolidation midweek before breakout.
IVR: 53 – volatility moderate, great for swing setups.
Flow: 34.6% Calls vs 46% IVx avg — balanced but leaning bullish; ripe for upside acceleration once $257 breaks.
Implication:
A breakout above $257.5 could trigger dealer hedging pressure upward, sending GOOGL toward $260–$262 into the weekend. Failure to hold above $255 reverts the stock back into the $252–$255 pin zone.
🧭 Final Outlook (Oct. 22–24)
From Wednesday to Friday, expect range compression followed by directional expansion.
* If bulls defend $252 and break $257 with conviction → likely gamma-fueled squeeze toward $260+.
* If rejection repeats → short-term retest of $252 possible before reattempt higher.
Structure, EMA alignment, and MACD confluence all point toward controlled bullish continuation. The setup favors swing traders looking to ride the next impulse leg.
My plan: Watch for Wednesday retest near $253 → Thursday breakout confirmation → Friday gamma push toward $260+.
Disclaimer:
This analysis is for educational purposes only and not financial advice. Always manage your risk and confirm setups before trading.
GOOGL Long Setup: Retest of Former Resistance as SupportHello TradingView Community,
This post outlines a potential long trade setup for Alphabet Inc (GOOGL) on the 15-minute chart.
Technical Analysis:
The chart highlights a key horizontal price level at approximately $246.06. This level previously acted as a significant resistance, capping the price on multiple occasions and creating a ceiling for the stock.
We have recently seen a clear breakout above this resistance, which is a bullish signal indicating that buyers are taking control. The trading idea is based on the classic "resistance-turned-support" principle. The price is currently consolidating above this broken level, which is now expected to act as a new support floor. A successful hold of this area would suggest a continuation of the uptrend.
Trade Setup:
The long position tool on the chart visualizes the specific plan for this bullish scenario:
Entry: Approximately $246.06 (at the retest of the new support).
Stop Loss: $240.02 (placed below the key support structure to invalidate the idea if the level fails to hold).
Take Profit: $290.46 (targeting a new potential higher high).
This setup provides a structured plan with a favorable risk-to-reward ratio for a potential continuation of the bullish move.
Disclaimer: This analysis is for educational and discussion purposes only and should not be considered as financial advice. Trading stocks involves significant risk. Please conduct your own research and manage your risk appropriately before making any trading decisions.
GOOGL Coiling for a Breakout: (Oct. 24 Outlook)Watching $256–$259 as the Key Battleground Zone 🔍
1. Market Structure (1H & 15M)
Alphabet (GOOGL) is showing signs of renewed accumulation after rebounding from the $248–$249 support range, where a clear CHoCH confirmed a short-term shift in sentiment. On the 1-hour chart, we can see a rising structure forming, with a BOS at $254.5 followed by a retest of the ascending trendline — a healthy pullback after a prior rally.
Price action remains confined between $248 (demand) and $259 (supply) — a tight compression range that often precedes expansion. The presence of multiple CHoCH and BOS levels suggests smart money is defending dips while gradually building positions ahead of a potential breakout leg.
On the 15-minute chart, intraday CHoCH around $252.5 shows that buyers reclaimed control quickly after a liquidity sweep. As long as price holds above $251.5–$252, short-term bias stays constructive heading into Friday’s session.
2. Supply and Demand / Order Blocks
* Demand Zone: $248–$252 — major high-confluence demand aligned with previous CHoCH zone and FVG (fair value gap). This zone marks the critical level for buyers to defend.
* Immediate Support: $252.5 — where both 15M and 1H EMAs align, acting as short-term dynamic support.
* Supply Zone: $256–$259 — overlapping with previous swing high structure and multiple BOS points, making it the area where sellers are most likely to react first.
A confirmed breakout above $259.3 with volume would invalidate the current compression phase and likely trigger a momentum run toward $265–$268 — which coincides with the next gamma and call wall zone.
3. Indicator Confluence
* 9 EMA / 21 EMA: Both EMAs are now turning upward and close to crossing bullishly on the 1H chart, signaling momentum recovery after a three-day base-building phase. On 15M, the 9EMA is already leading with price maintaining higher lows — confirming micro bullish structure.
* MACD: On both 1H and 15M, MACD is curling upward after resetting — the histogram flipped positive again, a sign of fresh momentum.
* RSI: 1H RSI reads around 70, consistent with bullish control. 15M RSI sits between 55–60, showing equilibrium before potential continuation.
* Volume: Gradually increasing as price tests higher support — typical pre-breakout accumulation pattern.
4. GEX (Gamma Exposure) & Options Sentiment
Friday’s GEX map shows concentrated call resistance between $255–$260, forming the main barrier. The highest positive gamma aligns perfectly with $255–$256, implying that this zone is both a magnet and a resistance pivot for dealer positioning.
Below, the PUT support and HVL (High Volume Level) cluster around $248–$250, making this the “floor” of the current gamma range. If GOOGL holds above that level, dealers’ hedging flow should favor stability or slow upside grinding.
IVR at 47.3 and IVX avg at 44.7 (-2.5%) show compressed volatility, often a precursor to sharp directional moves. The options sentiment leans 32.4% toward calls, not excessive but enough to suggest early bullish repositioning.
A decisive move through $259 could trigger a gamma flip and accelerate hedging demand, pushing GOOGL toward the next gamma node near $265–$268.
5. Trade Scenarios for Friday, Oct. 24
Bullish Setup 🟩
* Entry Zone: $252–$253 retest or breakout confirmation above $256
* Targets: $259 → $263 → $268
* Stop-Loss: Below $250.5
* Confirmation: MACD histogram turns positive, RSI holds >60, and price maintains above 9EMA on 15M
Bearish Setup 🟥
* Entry Zone: $256–$258 rejection area
* Targets: $252 → $249 → $245
* Stop-Loss: Above $259.5
* Confirmation: CHoCH + bearish MACD crossover on 15M
6. Closing Outlook for Oct. 24 (Friday)
Friday looks like a make-or-break day for GOOGL. The stock has been quietly consolidating between $248 and $259 for several sessions — building energy for the next trend leg. As long as $251–$252 holds, the path of least resistance remains to the upside.
If bulls can break through $259 with volume, expect acceleration toward $265–$268 as gamma flows shift supportive. Conversely, a failure to hold above $252 could signal another liquidity sweep down to the $245–$247 range before buyers step in again.
My personal view: GOOGL looks constructively bullish with structure tightening and momentum curling higher. The $255 pivot is key — reclaim and hold that, and a breakout run becomes highly probable.
💬 Final Thought:
“GOOGL is compressing between $252 and $259 — the spring is winding tight. A clean breakout over $259 could unleash a sharp move toward $265+. Watch the volume — that’s your tell.”
This analysis is for educational purposes only and not financial advice. Always do your own research and manage your risk before trading.
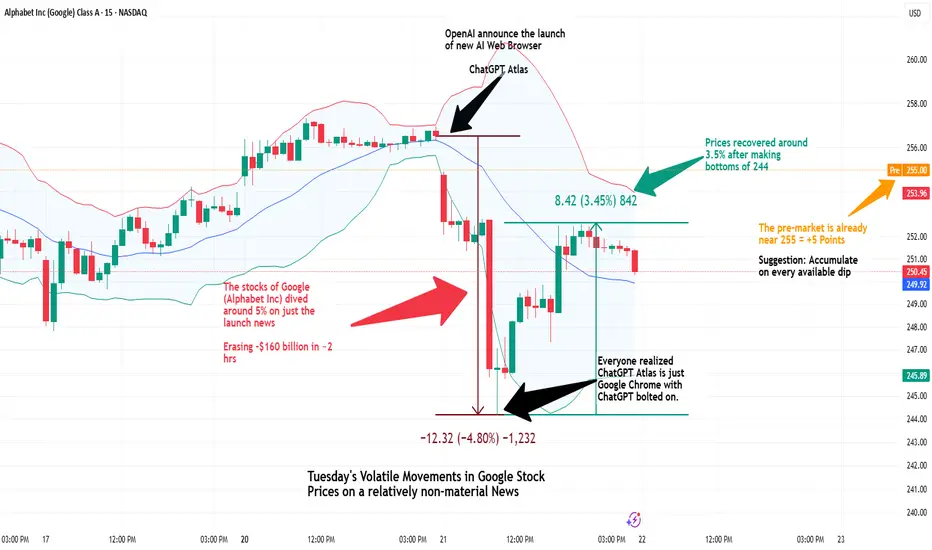
Google Shaken by OpenAI’s Browser Launch Google Shaken by OpenAI’s Browser Launch — But later Bounced Back
- A sudden shock hit the markets (especially Google) as OpenAI announced its new AI web browser on Tuesday
- As a result, Google (Alphabet Inc.) stock tumbled nearly 5%, wiping out ~$160 billion in market cap within hours!
- But the panic was short-lived — investors soon realized that Atlas is no more of an AI-powered Chrome clone
- Google quickly rebounded 3.5%, showing resilience and confidence in its ecosystem.
With pre-market already near $255, the message is clear :
- Accumulate the stock on every dip.
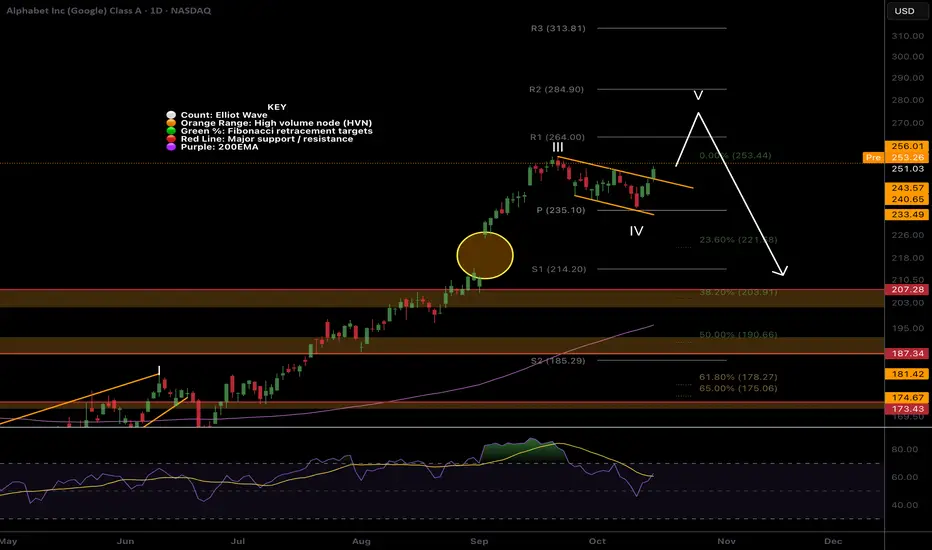
Google ready for higher!I am liking the look of NASDAQ:GOOG for another push to all time high before lower to complete macro elliot wave 3.
Wave 4 has typical target of the 0.382 Fibonacci retracement which sits at the previous all time high and also fils the gap left and meets the daily 200EMA! Lots of confluence and ill be buying here if we get it.
Daily Rsi has crossed bullishly from below the EQ.
Safe trading
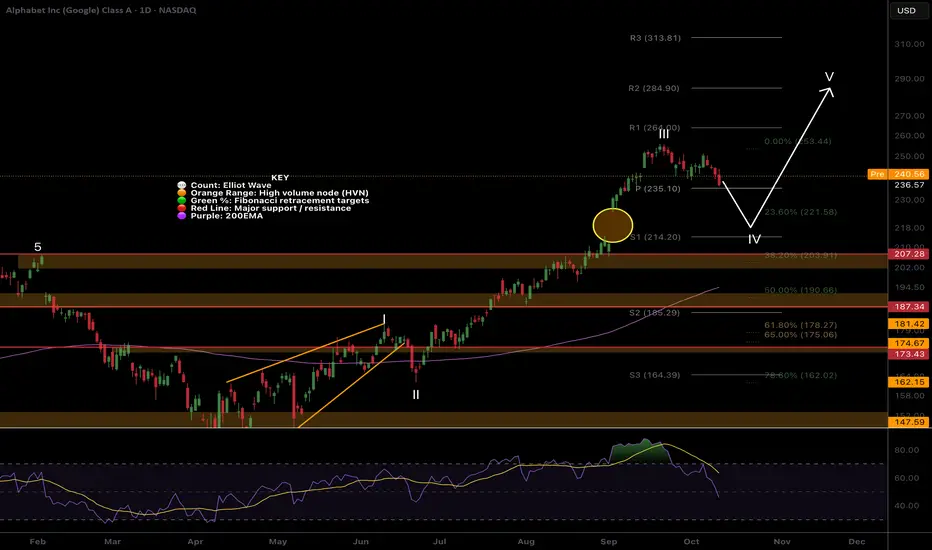
Google Gap fill + wave 4?Google has had a great run into price discovery in wave III uptrend but now appears exhausted and ready for a short term pullback setting up new signals.
The gap looks likely to be filled as coinciding the wave IV Fibonacci targets and the S1 daily pivot.
RSI is making its way into oversold with plenty of room to fall. Price may fal as far as the 0.382 Fibonacci and retest the previous all time high!
Safe trading
GOOG is breaking a bull flagThis October, Google has formed a textbook bull flag pattern. If price breaks to the upside, we could see the current rally continue for several more days.
Many analysts (BMO, TMC or HSBC among others) have recently placed GOOG’s target area between $285–$300, which aligns perfectly with the technical structure currently forming.
This setup offers a tight stop of just 1–2%, while aiming for potential returns around 10%, a solid risk/reward opportunity.
We shared a similar signal in JNJ recently.
JNJ idea

GOOGL Friday Momentum Test – Oct. 17Bulls Defend the Trendline as Gamma Builds Near $251🔥”
📊 Multi-Timeframe Breakdown
🕒 1. Daily Chart – Macro Structure (“The Why”)
GOOGL’s overall macro trend remains bullish after months of consistent higher highs and higher lows. The recent CHoCH near $253–$255 signals a temporary cooling phase following the parabolic August rally.
Price continues to respect the ascending channel drawn from the May low, currently retesting mid-channel support around $246–$248. Momentum indicators show a natural consolidation within an ongoing uptrend — not a breakdown.
Macro Bias: Still bullish unless $236 breaks, but short-term correction pressure is evident. Smart money appears to be redistributing positions near the upper channel after an extended run.
⏰ 2. 1-Hour Chart – Active Market Structure (“The Setup”)
xhttps://www.tradingview.com/x/Iblu5YtL/
The 1-hour chart shows a clean BOS → CHoCH pattern as GOOGL transitioned from impulsive buying to range-bound behavior.
Price broke structure above $247, extended to $256.9, and has since pulled back to retest the $247–$249 demand zone, which also aligns with a prior FVG fill and trendline support.
Both 9 EMA and 21 EMA are starting to flatten, signaling that momentum is stabilizing after the early-week push.
The MACD shows weakening histogram bars with the line nearing a crossover — a neutral stance leaning slightly bearish intraday.
If price holds above $247, this could serve as a base for another breakout attempt next week.
Key Levels:
* Support: $247.0 → $244.8 → $240.0
* Resistance: $251.5 → $256.9 → $260.0
💹 3. 15-Min Chart – Intraday Execution (“The How”)
On the 15-min timeframe, price structure has compressed into a tight consolidation range between $250–$253, with visible CHoCH and BOS oscillations — textbook accumulation behavior before a Friday directional move.
The MACD histogram is flattening near zero, and Stoch RSI is curling upward from oversold territory, hinting at possible bullish relief.
If bulls defend the intraday BOS zone at $250, a squeeze into $253–$256 is highly possible. But if $249 breaks with volume, downside liquidity targets open fast toward $245–$243.5 (previous imbalance fill zone).
Scalp Play Idea:
* Bullish: Enter above $252.0, target $255.5–$257, stop below $249.8.
* Bearish: Enter on breakdown below $249.0, target $245 → $243, stop above $251.8.
📈 4. GEX (Gamma Exposure) Chart – Dealer Positioning (“The Fuel”)
Friday’s option structure shows a tight gamma cluster forming near GOOGL’s current price:
* Highest positive GEX / Call Resistance: $255–$257
* Gamma Pivot (HVL): $251–$252 → current trading zone and likely magnet.
* Put Walls: $242 → $237
* Max Call Walls: $260–$265
Dealers remain slightly long gamma around current levels, which could suppress volatility until price decisively breaks out of the $247–$253 band.
If GOOGL pushes above $253, hedging could flip supportive, triggering a controlled gamma squeeze into $256–$258.
Conversely, breaking below $247 could flip dealers short gamma, expanding volatility into next week toward the $242 support cluster.
Volatility Note:
* IVR 59.3 and IVx avg 47.8 show traders expect higher-than-normal movement.
* Call flow 22.8% vs Put flow 77% — suggests more hedging on downside exposure, meaning a quick reversal could trap shorts if SPY remains firm Friday.
🎯 Final Outlook
Friday’s GOOGL tone revolves around whether bulls can defend $247–$249.
If that zone holds, the stock could retrace back toward $255+ into the weekly close — especially if SPY or QQQ sustain their bounce.
However, if the trendline cracks and volume expands below $247, expect a controlled gamma unwind that could drag price into $243–$240 before stabilizing.
Personally, I’m watching for a fake breakdown setup under $249 that reclaims $251 with volume — that’s a classic Friday reversal pattern with asymmetric reward.
Disclaimer:
This analysis is for educational purposes only and not financial advice. Always manage your risk and trade responsibly.

$GOOG Flag breakout These are simple breakout plays. Wait for retest of support then enter longs up to dbl top and leave some runners for the big win.

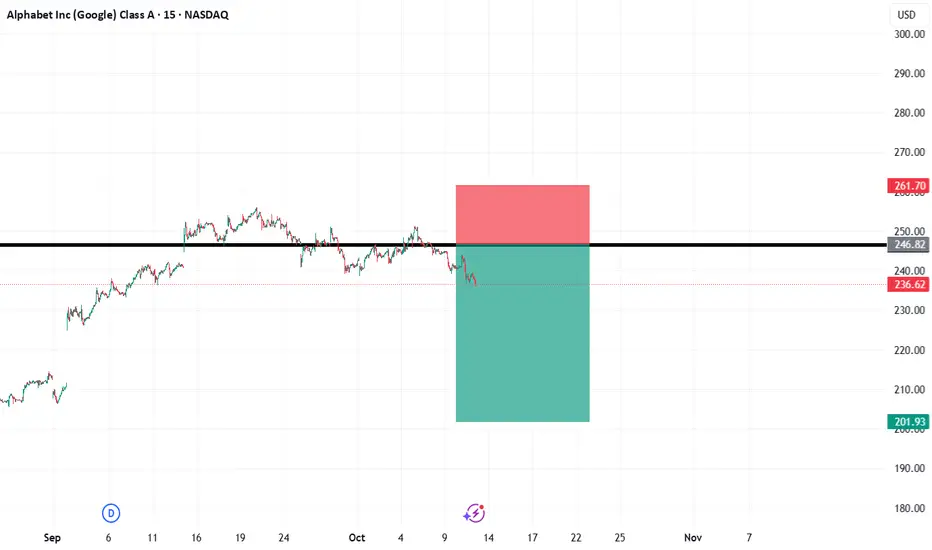
GOOGL Short Setup: Former Support Acting as New ResistanceHello TradingView Community,
This post outlines a potential short trade setup for Alphabet Inc (GOOGL) on the 15-minute timeframe.
Technical Analysis:
The chart highlights a key horizontal price level at approximately $246.82. This level previously served as a solid support zone, holding the price up on multiple occasions.
We have recently witnessed a decisive breakdown below this support, indicating a shift in momentum to the bearish side. The price is now trading below this broken structure. The trading idea is based on the classic "support-turned-resistance" principle. We are looking for a pullback to this former support level, anticipating that it will now act as a new ceiling and reject the price, leading to a continuation of the downtrend.
Trade Setup:
The short position tool on the chart visualizes a potential trade plan based on this bearish scenario:
Entry: Approximately $246.82 (at the retest of the new resistance).
Stop Loss: $261.70 (placed above the resistance zone to invalidate the idea if the price reclaims the level).
Take Profit: $201.93 (targeting a new potential swing low).
This setup provides a structured plan with a clear risk-to-reward ratio for a potential move lower.
Disclaimer: This analysis is for educational and discussion purposes only and should not be considered as financial advice. Trading stocks involves significant risk. Please conduct your own research and manage your risk appropriately before making any trading decisions.
Google Wave Analysis – 24 October 2025- Google broke key resistance level 255.00
- Likely to rise to resistance level 270.00
Google broke above the key resistance level 255.00 (which stopped the previous impulse waves 3 and i, as can be seen from the daily Google chart below).
The breakout of the resistance level 255.00 accelerated the active minor impulse wave 5 of the daily impulse sequence (1) from April.
Given the strong daily uptrend, Google currency pair can be expected to rise to the next resistance level 270.00 (target price for the completion of the active impulse wave iii).
GOOGL - Searching for a new high=======
Volume
=======
-slight increase
==========
Price Action
==========
- Bullish flag noticed and px broke out of flag
- Rounding bottom
- Weak selling pressure
=================
Technical Indicators
=================
- Ichimoku
>>> price above cloud
>>> Green kumo expanding
>>> Tenken + Chiku - above clouds and sloping upwards
>>> Kijun - Above clouds and sloping upwards
=========
Oscillators
=========
- MACD turning bullish
- DMI turning bullish
- StochRSI, bullish, crossed and within band
=========
Conclusion
=========
- short to long term breakout swing
- price may reverse at current level, to enter spot or wait for pullback at entry 2.

Possible Down trend in the next few weeksLooks like Google has a Gap to fill between $215-224. Down trend already showing.
Im not an expert just my thoughts on Google short term trade.

GOOGL - Zoom outShould've done this earlier with my melt up & crash series
Living and learning every day
Not financial advice

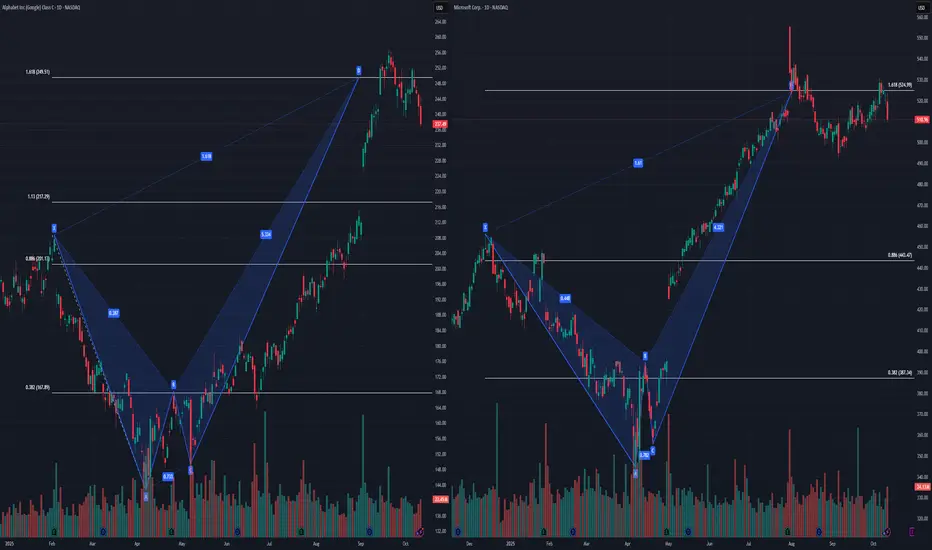
$GOOG & $MSFT bearish crab patternsGoogle and microsoft reaching target at 1.618 fib level. both flirting with all time highs then retracing. must wait for further drop and consolidation before resuming uptrend.
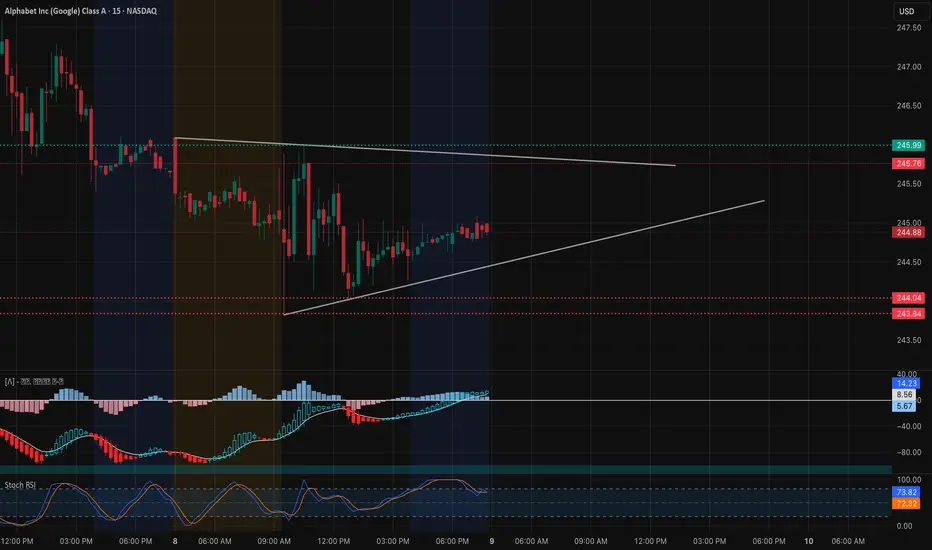
GOOGL Oct. 9 — Bulls Building Base Above $244GOOGL Oct. 9 — Bulls Building Base Above $244, Watching $247.5 Breakout 🔥
Alphabet (GOOGL) is showing early signs of recovery after defending the $243–$244 demand zone. The 15-minute chart highlights a CHoCH following a series of BOS confirmations, suggesting the start of a short-term bullish structure shift. Price is riding an ascending intraday trendline, hinting at accumulation near current levels before an attempt toward $247–$250.
MACD has turned positive with rising histogram momentum, and the Stoch RSI is pushing upward from mid-levels — showing renewed buying interest. If momentum holds, GOOGL could test its upper supply range soon.
On the 1-hour chart, price is consolidating just above the HVL ($244.88), where gamma positioning provides a neutral-to-bullish cushion. Above, major gamma resistance aligns with $247.5 → $251.3, where the largest call walls and positive net GEX sit. A clean breakout through $246 could ignite momentum toward the $250 area.
Support and Resistance Levels:
* Immediate Resistance: $246.00 → $247.5
* Major Resistance (Gamma Wall): $250 → $251.3
* Immediate Support: $244.03 → $243.5
* Key Support Zone: $240 → $238.6
GEX & Options Sentiment (1H GEX Chart):
* The highest positive GEX lies near $250–$251, forming a strong gamma ceiling.
* Put support at $240–$238.6 acts as a sturdy base, where dealers are likely delta-hedging long.
* IVR (47.2) and Calls (36.5%) suggest moderate bullish sentiment with balanced positioning.
* The GEX curve tilts upward above $246, meaning that any breakout from here could trigger dealer hedging and accelerate a short squeeze toward $250+.
Trade Scenarios:
Bullish Setup:
* Entry: Above $246 breakout
* Target 1: $247.5
* Target 2: $250 → $251.3
* Stop-Loss: Below $243.5
* Rationale: Bullish CHoCH, rising MACD, and supportive GEX bias favor continuation if price clears $246 resistance.
Bearish Setup:
* Entry: Below $243.5 breakdown
* Target 1: $240
* Target 2: $238.6
* Stop-Loss: Above $245.5
* Rationale: Rejection at $246 with weakening MACD momentum could invite sellers back toward gamma neutral levels near $240.
GOOGL is holding its intraday structure firmly, with upside potential toward $250 if $246 clears with volume. As long as $243.5 holds, buyers retain control in this tight consolidation range.
Disclaimer:
This analysis is for educational purposes only and does not constitute financial advice. Always do your own research and manage your risk before trading.
If anyone needs me to TA any stock, PM me.
$GOOG Call Alert – Oct 31 ’25 $250 Calls | 81% ROI PotentialEnter: NASDAQ:GOOG OCT 31 2025 $250 CALLS
Buy in Price: $8.62 - $8.65
Take Profit: $15.60
Stop Bleeding: $7.59
ROI Potential: 81%
Exit Within: 81 Minutes
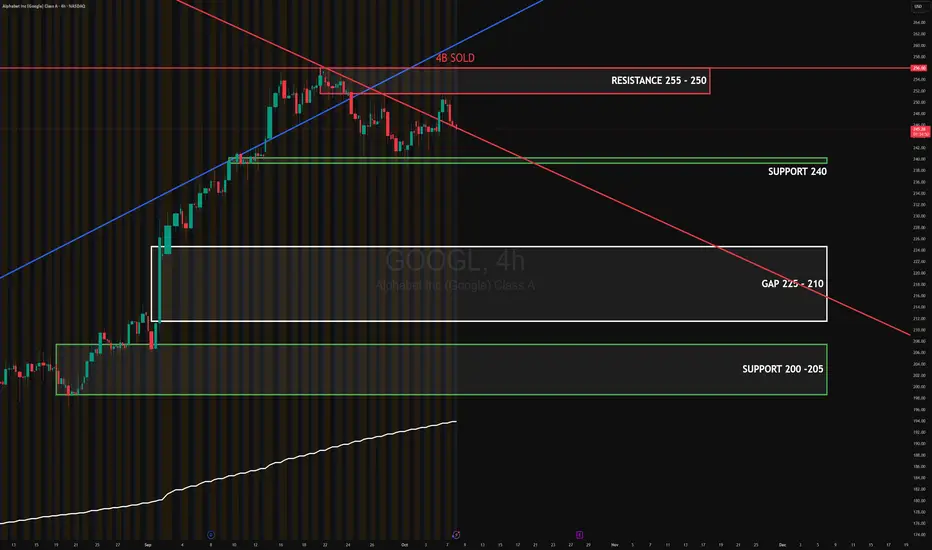
GOOGL OCT 2025GOOGL (4H) rejected the 255–250 supply and is back under the descending trendline. Demand is defending 240; acceptance below it likely opens the open gap toward 225–210. Prior heavy sell program near 250–255 signals distribution; watch for absorption at 240 to gauge a bounce vs. continuation.
Target up: 250–255 retest; extension only on confirmed break and hold above the trendline.
Target down: 240 → 225–210 gap fill; extension 205–200.
#GOOGL #globaltrade #investment #investing #stockmarket #wealth #realestate #markets #economy #finance #money #forex #trading #price #business #currency #blockchain #crypto #cryptocurrency #airdrop #btc #ethereum #ico #altcoin #cryptonews #Bitcoin #ipo
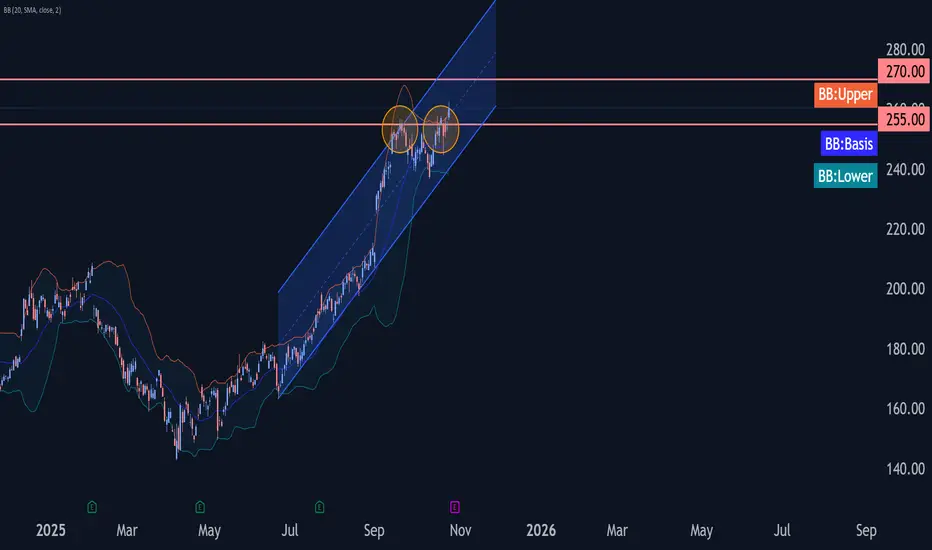
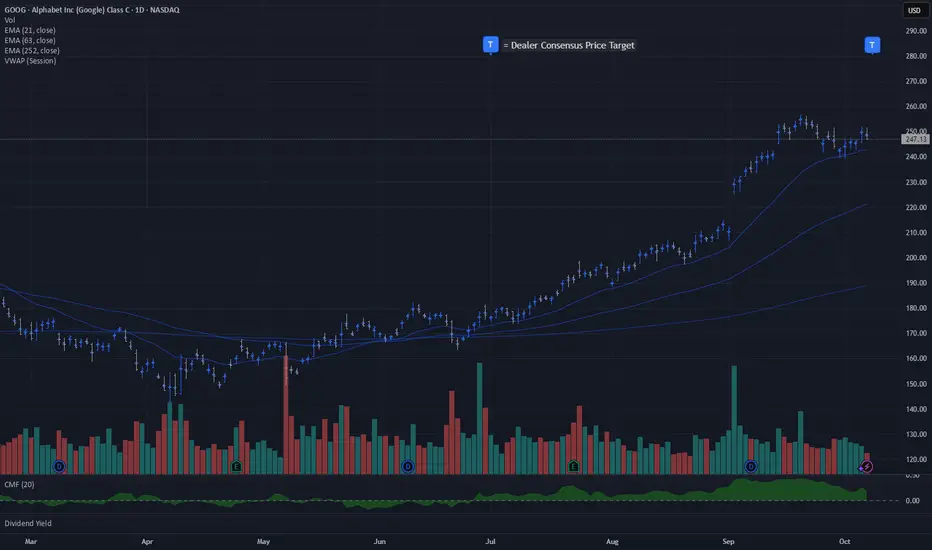
GOOG | Dealer Consensus Price Target $281Special appearance of a mega-cap on the top ranked dealer positioned names.
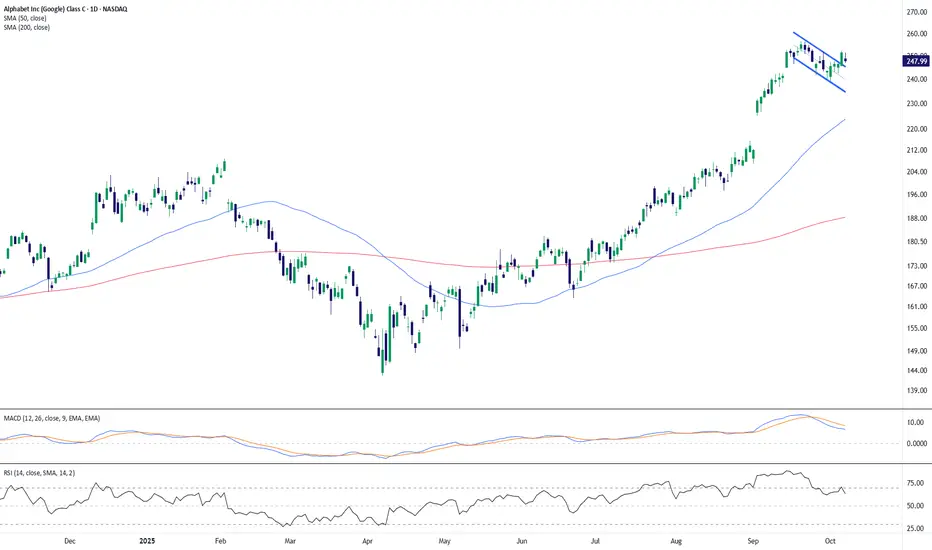
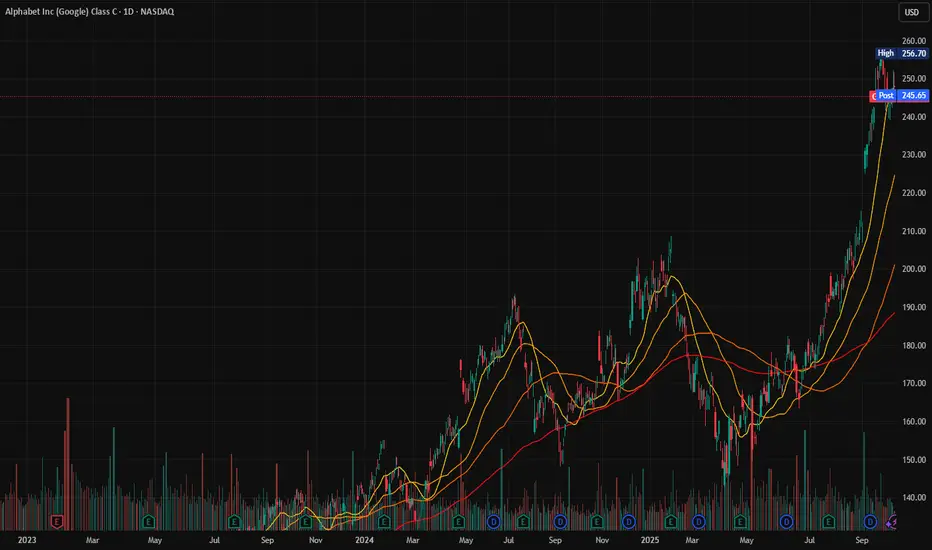
Alphabet (GOOG) Forms Bull FlagAlphabet’s recent price action suggests a brief consolidation phase following a powerful uptrend. After a sustained advance through late summer, price has developed a bull flag pattern — a downward-sloping channel (highlighted in blue) forming just below recent highs, often seen as a continuation setup within strong trends.
The 50-day SMA (blue) continues to rise sharply above the 200-day SMA (red), confirming the broader bullish structure. Price remains comfortably above both moving averages, reinforcing underlying strength despite short-term pullback behavior.
Momentum indicators show mixed signals typical of consolidation:
The MACD has flattened slightly, with the signal lines converging but still holding in positive territory, indicating a temporary slowdown rather than a full reversal.
The RSI (14) has eased from overbought levels to around 63, suggesting that buying pressure has cooled but remains generally supportive of the trend.
Overall, Alphabet’s chart maintains a constructive technical setup. The bull flag pattern, combined with rising moving averages and resilient momentum, indicates that the broader uptrend remains intact pending a confirmed breakout from the consolidation channel.
-MW