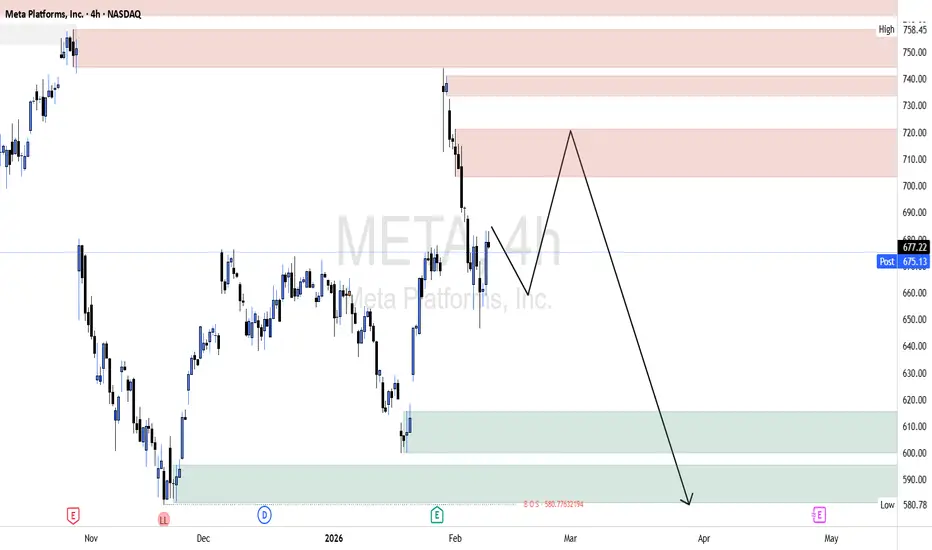
META - a deeeeep pullback soon META had solid bull run and probably this gonna follow rest of the names in this pullback.
Short it anywhere with some longer expiry puts. My preference would be Enter and Exit with good R:R zones and take profits. Expecting a fast move to the downside soon.
I prefer to use round number targets as those zones have good liquidity for puts.
Target 1 - 680
Target 2 - 600
Target 3 - 555
Target 4 - 500
Target 5 - 450
Target 6 - 400
Meta Platforms Inc Class A
No trades
What traders are saying

META (swingtrading) Double bottmSame as the title:
-On the daily timeframe, price formed a double bottom and successfully retested it.
-We also saw a strong reaction at the key support level — take a look.

META: Third Higher Low + good Risk/Reward Setup#META
Third test of $625 support after -25% pullback from ATHs.
The Setup:
- Entry: $665
- Stop: $644
- Target 1: $720
- Target 2: ATHs ($750+)
Why I like it:
- Triple bottom = institutional accumulation
- Higher lows = buyers stepping up earlier each time
- Risk/reward 3:1 to first target
Target:
- $700-725 zone rejected twice — heavy supply
- Broader market still shaky
Small position. Defined risk. Let it work.
Not financial advice. Just sharing my analysis. Do your own research and manage your own risk.

Midterm Stock Forecast for METANASDAQ:META At $594, Meta enters a buy zone after the sharp decline since late October. H1 technicals show stabilizing momentum. First target stands at $660, and extension toward $760 remains possible if ad revenue and AI-driven engagement trends stay strong. Valuation still supports midterm upside after the recent correction.

$META ready to goI believe Meta is ready to go higher after a break and a retest on the weekly.
Meta stock is a strong buy because it’s beating earnings expectations, rapidly growing its AI-powered ad business, and investors are betting big on its long-term growth potential.

Is this the distribution phase for Meta before heading south?It looks like Meta has failed again to break above the 750 resistance level.
Do you think it’s entering a distribution phase before potentially moving lower?
It is possible that it could drop toward the 480 support range, or even lower?

Long Swing Idea on $METANASDAQ:META looking pretty strong for a long trade.
Trade Plan:
Long Trade - $673.50
Target - $688.00
Stop Loss - $667.00

META Long*META
First Long then Short
We are still operating within a larger bearish market structure. The prior impulse to the downside remains dominant, and the recent upside move is corrective, not a trend reversal. Price has already shown weakness after tapping into higher supply, and overall structure favors continuation lower.
From a supply and demand perspective, META is currently trading below multiple stacked supply zones. The most relevant supply sits between roughly 710 to 750, where strong institutional selling previously occurred. Price reacted sharply from this region, confirming it as a valid and active supply zone. On the downside, demand is clearly defined between 600 to 580, which aligns with the prior base and liquidity pool. This lower zone is unmitigated and remains the primary downside magnet.
Looking at price action, the recent push higher lacks follow-through. Price is forming lower-quality structure, showing overlap and hesitation, which signals distribution rather than accumulation. The projected path reflects a pullback into supply, followed by a strong bearish rotation that targets lower demand.
Trade bias remains bearish. The preferred scenario is for price to fail below supply, roll over, and expand lower toward 600 first, with continuation toward 580 if momentum accelerates.
Invalidation occurs on sustained acceptance above the upper supply zone, which would signal a structural shift — currently unlikely based on price behavior.
Momentum is weakening, and bullish candles are corrective in nature. There is no strong displacement to the upside, reinforcing the idea that buyers are being absorbed rather than in control.
Meta Platforms (META) — AI Flywheel + New Monetization LanesOperating the world’s largest social & messaging ecosystem, Meta is scaling AI, AR/VR, and metaverse infrastructure to deepen engagement and extend monetization beyond ads.
Key Catalysts
AI-Driven Ads = Core Engine
Q4’25 revenue: $59.9B (+24% YoY); Q1’26 guide: $53.5–$56.5B.
Advanced models lift recommendations, engagement, and ad efficiency, supporting mid-20%+ growth into 2026.
Capex → Durable Moat
$115–$135B 2026 capex into Llama, multimodal AI, and next-gen compute builds a self-reinforcing AI platform that improves ads, discovery, and time-spent.
Monetization Beyond Ads
WhatsApp scaling from ~$9B → ~$36B by FY29 (estimate) via business messaging, payments, and automation.
Threads user momentum adds optionality.
Open-source Llama integrations + AI agents enable commerce & enterprise AI revenue across Meta’s apps.
Why It Matters
AI infra spend compounds ad performance + engagement
Messaging monetization (especially WhatsApp) unlocks new, higher-margin streams
Open ecosystem (Llama) broadens developer and enterprise adoption
Investment View NASDAQ:META
Bullish above: $600–$605
Upside target: $1,050–$1,100 — underpinned by the AI flywheel, messaging monetization, and platform-wide operating leverage.

META under regulatory pressure in EuropeMETA under regulatory pressure in Europe: the social media debate reopens risks for the sector
By Ion Jauregui – Analyst at ActivTrades
The technology sector has once again moved to the center of the European political debate following strong criticism from Telegram founder Pavel Durov of the Spanish government’s plan to limit access to social media for minors under 16 and to toughen the criminal liability of executives for content considered harmful or hate speech. A position that was also joined by Elon Musk, owner of X, increasing tensions between regulators and major digital platforms.
Although media attention has focused on Telegram, the implications of the debate directly affect giants such as Meta Platforms, Alphabet, Snap, and TikTok, whose shares reacted with market declines amid rising regulatory uncertainty. In Meta’s case, the stock fell by more than 3% during the session, reflecting market sensitivity to any measure that could affect its business model based on algorithms, segmentation, and advertising monetization.
From a fundamental perspective, Meta faces a double risk in Europe. On the one hand, the possible restriction of access for minors could impact active user metrics and future user acquisition. On the other, the criminalization of the use of algorithms considered amplifiers of harmful content introduces a significant legal risk, which could force structural changes in the way content is distributed, directly affecting engagement and, by extension, advertising revenues.
This context aligns with a broader trend in Europe, where countries such as France, the United Kingdom, Greece, and more recently Australia have hardened their stance toward social media. For Meta, which has already had to adapt to the framework of the Digital Services Act (DSA) and the Digital Markets Act (DMA), the European regulatory environment continues to be a medium-term pressure factor.
Technical analysis of Meta Platforms (META)
From a technical standpoint, Meta shows signs of fatigue after the strong bullish rally of 2024 and 2025. On the daily chart, the price has lost momentum after setting recent highs, generating a correction that coincides with increased regulatory noise. After the highs of this year reached at the end of January, trading above 739, the stock experienced a sharp correction following the liquidation of positions after positive company results. Current regulatory news does not support its performance in Spain or the broader European trend, but we can observe that the long-term move has caused the price to fluctuate between the ceiling at 747.90 dollars and the floor at 579.04 dollars, with its midpoint—the point of control—around 666.15 dollars.
The current move is testing the 50-day moving average, creating a zone of indecision after a double moving average crossover that appears to be correcting the stock upward. The RSI has exited a very high overbought zone and is pointing toward consolidation, while the MACD is showing a contraction in bullish momentum, although without a clear signal of a long-term trend change. This could be revealing a sideways movement in the stock ahead of the quarterly earnings report. A loss of the current support level could open the door to deeper corrections if the 100-session moving average fails to hold. The resistance at recent highs has established itself as a rejection zone with high volume, now acting as a particularly important ceiling.
Regulatory tensions could affect results
Meta presents a long-term sideways structure with underlying bullish phases, but the European regulatory context acts as a catalyst for short- and medium-term corrections. As long as the price respects key support levels, the bias remains constructive; however, a more aggressive regulatory escalation could prolong the consolidation phase and increase the stock’s volatility.
*******************************************************************************************
The information provided does not constitute investment research. The material has not been prepared in accordance with the legal requirements designed to promote the independence of investment research and such should be considered a marketing communication.
All information has been prepared by ActivTrades ("AT"). The information does not contain a record of AT's prices, or an offer of or solicitation for a transaction in any financial instrument. No representation or warranty is given as to the accuracy or completeness of this information.
Any material provided does not have regard to the specific investment objective and financial situation of any person who may receive it. Past performance and forecasting are not a synonym of a reliable indicator of future performance. AT provides an execution-only service. Consequently, any person acting on the information provided does so at their own risk. Political risk is unpredictable. Central bank actions can vary. Platform tools do not guarantee success.

BUY for META at Discounted Price - AI CAPEX Priced In!Market sentiment dragging prices down due to concerns over AI CAPEX, but from what I see, these are one time costs with sustained future ROI and non-linear positive scaling effect on META's family of apps and advertising services.
Catalysts upcoming include META's AI Frontier models release - Avocado.
META has also not fully leveraged profit margins on threads and whatsapp unlike instagram and facebook which has global advertising footprint.
BUY @ below 685
TARGET @ 850, 1000, Long hold

META Reload Zone — Structural Strength Supports Swing HigherMETA QuantSignals V4 Swing | Feb 3, 2026
Technical Positioning:
Price sits above both the 50-MA ($652) and 200-MA ($682)
MACD bullish, confirming upward momentum
Fundamental Backdrop:
Revenue growth: +23.8%
Analyst target near $858 → ~23% upside
Long-term structure remains constructive despite potential near-term volatility.
Instrument: META Equity
Entry: $690 – $710
Target 1: $740 (+5.8%)
Target 2: $820 (+17%)
Stop: $660 (-5.6%)
Risk Grade: Medium | Conviction: Moderate
Execution Tip:
Wait for strength above VWAP or a confirmed bullish candle before initiating size.
⚠️ Invalidation:
A sustained break below $660 (200-MA) would negate the bullish thesis and suggest deeper correction risk.
QS V4 Elite | Quant-Driven Intelligence — Not Financial Advice

META PUT / SHORT OPPORTUNITYMETA is approaching a massive gap fill opportunity, between $700 to $674.
Entered 6 Feb 2026 $700 puts for $900 each. Put closed at $3145 end of day.

META – Feb 3 Trade Plan (HTF → LTF + GEX)1H – Big picture
META lost its clean upside momentum after the post-earnings impulse and is now compressing under a descending structure. Price rejected from the upper range near the low-740s and has been grinding lower into a tight consolidation.
This is no longer a momentum continuation chart. It’s transitioning into balance after expansion.
Higher timeframe structure is mixed: the larger trend isn’t broken, but buyers are no longer aggressive. That usually means patience is required — either for acceptance higher or a deeper liquidity test lower.
This is not a chart to chase.
15m – What matters for execution
On the 15m, META is stuck below the 712–715 zone. That area has acted as repeated resistance and aligns with short-term EMA pressure and prior breakdown structure.
Every bounce into this zone has been sold quickly, and follow-through has been weak.
Below price, 705–700 is the key support pocket. Buyers have defended it so far, but similar to SPY, each bounce is getting smaller. That’s a sign of absorption, not strength.
Right now, price is boxed between overhead supply and soft support. This favors fade setups and quick reactions, not directional holds.
GEX – Why this stays controlled for now
GEX shows heavy PUT positioning stacked between 705–700, with CALL resistance layered higher around 720–725 and again near 730.
That structure creates a pinning effect:
* Dealers are incentivized to keep price inside the range.
* Moves toward resistance are likely to stall.
* Downside probes are likely to slow near put support unless that level fails cleanly.
As long as META stays below the 720–725 call wall, upside remains capped.
As long as 700 holds, downside is controlled but fragile.
This is range management, not trend acceleration.
Trade ideas (intraday focus)
* Below 715: Favor PUT scalps on failed bounces
* 712–715: No-trade zone — chop and fake moves live here
* 705–700: Bounce scalps only if structure confirms
* Above 725: Bias shifts — would signal dealer re-hedging
Options-wise, short-dated, in-the-money contracts fit this environment best. Premium burn and fake breaks are a risk here.
Bottom line
META is in consolidation after expansion. Dealers are in control, and price is respecting option-driven levels.
Until price leaves the 700–725 box, the edge is in reacting to levels, not predicting breakouts.
Let price come to you.
Don’t force trades in the middle.
Disclaimer
This analysis is for educational purposes only and does not constitute financial advice. Always manage risk and make your own trading decisions.

correction to demandit depends on the broader market,if the broader market bearish so is meta, I marked an area of demand where price shot up from the spot

Live trading on Meta Platforms (META)The price has reached the midpoint of its channel with a valid divergence and is currently at the 78% retracement level of its previous bullish move. Based on one of our trading systems, a buy signal has also been issued.
NASDAQ:META
Follow proper risk and money management.
This is just my personal view, so please trade based on your own strategy and trading system.
Follow me on TradingView for more analyses and live stock trades.

META Feb 11 Market Preview –Compression Beneath Gamma ResistanceMeta is stabilizing after a sharp downside move earlier in the week, but the structure is not fully repaired yet. Price is consolidating in a tight intraday range just below heavy call resistance while still sitting above key put support.
This is a transition zone, not a trend.
Higher Timeframe Structure (1H)
META broke its prior downtrend line and reclaimed the 660–665 demand base. That was the first constructive signal. However, the rally stalled into the 677–682 supply zone, where prior distribution and call gamma stack.
We now have a compression between:
Support: 660–665
Resistance: 677–682
Above 682, the path opens toward 690–695 where the highest positive NETGEX sits.
Below 660, downside liquidity increases toward 655 and potentially 646.
The bigger structure is neutral-to-repairing, but not bullish expansion yet.
15-Minute Execution View
Intraday, META is coiling around 670–672. Volume is light, signaling hesitation rather than aggressive selling.
Key levels to watch: 682
– Call resistance / gamma cap
690
– Major NETGEX resistance
675–677
– Minor decision zone
660
– Major put support
655
– Acceleration trigger if 660 fails
GEX & Dealer Positioning
The gamma profile shows clear call resistance around 682 and heavier positive gamma above 690. Dealers are likely to suppress volatility inside this band unless one of these levels is decisively accepted.
Below 660, negative gamma builds, meaning breakdowns can move faster than expected.
This is a level-to-level environment.
Trade Plan for Feb 11
Bullish Scenario:
If META breaks and holds above 682 with volume confirmation, continuation toward 690–695 becomes probable. That is where upside expansion can accelerate.
Bearish Scenario:
If 660 fails, expect momentum toward 655 first. A clean break below 655 opens room toward 646.
Inside 660–682, this remains a range trade. Avoid chasing mid-range noise.
Final Bias
Neutral bias inside 660–682 compression.
Bullish only on confirmed acceptance above 682.
Bearish only on breakdown below 660.
META is preparing, not trending. The expansion move will likely be decisive once a side wins.
Feb 11 will reward patience and confirmation.
This analysis is for educational purposes only and does not constitute financial advice. Always manage your risk and trade responsibly.

META Attracts Buying Interest After Reversal and RetracementMETA has retraced to a key demand zone following the formation of a double-bottom pattern, which signaled a reversal from its prior downtrend. Buying interest is beginning to re-emerge as the stock retraces to a demand level NASDAQ:META , suggesting improving sentiment as the stock stabilizes after the pullback.
Meta Platforms, Inc. is a $1.71 trillion market-capitalization company engaged in the development of social media and connectivity technologies. The company operates through two segments: Family of Apps (FoA) and Reality Labs (RL). The FoA segment includes Facebook, Instagram, Messenger, WhatsApp, and other services, while Reality Labs focuses on augmented and virtual reality hardware, software, and content.
META benefits from a wide economic moat and has delivered consistent revenue growth over the past five quarters, with EPS growth in four of the last five quarters. Profitability remains strong, with ROE above 30% and ROIC above 20% over the same period. Net margins have exceeded 38% in all but one quarter (Q3 2025). The balance sheet is robust, supported by strong liquidity with a current ratio of 2.6x and a conservative capital structure, as reflected by a debt-to-equity ratio of 0.4x.

Short Day Trade Idea on $METANASDAQ:META looks good for a short till the end of the today’s session.
Trade Idea:
Short Entry: $680.50
Target 1: $676.00
Target 2: $673.00
Stop Loss: $683.50

META at a Crossroads — Smart Money Watching This ZoneMETA QuantSignals V4 Swing 2026-02-03
Style: Swing / Position trade (not ideal for impulsive day trades)
Meta continues heavy investment in AI infrastructure and data centers, aiming to expand monetization and platform capabilities.
Analysts see AI as a major growth engine, reinforcing long-term revenue opportunities.
Advertising demand remains strong, with digital ad spending expected to grow about 5% in 2026, benefiting Meta.
⚠️ Bear Risks
Massive AI spending could pressure margins while Reality Labs continues losing money.
Regulatory and data-privacy scrutiny add execution risk.
Some analysts warn the stock is priced for high expectations — meaning disappointment could trigger sharp drops.
👉 Best for traders who prefer trend continuation + fundamentals.
Short-Term Pullback Setup (Speculative)
Watch for rejection near resistance (~$740 zone).
If market weakens → possible retrace toward mid-600s.
👉 Better for experienced traders only.
🧠 Pro Insight (What Smart Money Watches)
Focus on these catalysts:
AI monetization progress
Ad revenue growth
Tech sector sentiment
Capex vs profitability balance
👉 META typically makes large directional moves when narrative shifts — not randomly.

META: CCI system updated readRiding the cross channel. Neutral zone, nothing shouting at me one way or the other.

META, Short term outlook SHORTMy current short term position is SHORT on META..
My posts are not investment or trading advices, do your own search before you trade, I am not responsible for your losses.

Short Idea on $META [Swing Trade]If NASDAQ:META hits back to the 710.00 level and holds the level, it will go down towards the 700 area.
I would play this with a trailing stop loss with a final stop loss at the $718.00 area.
Trade Plan:
Short Entry - $710.00
Target 1 - $700.00
Target 2 - $692.00
Stop Loss - $718.00
