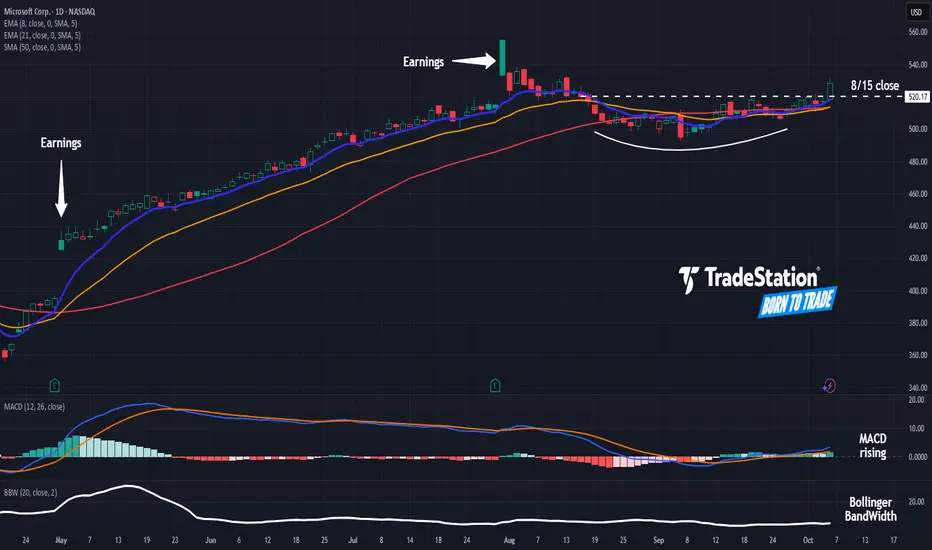
Microsoft May Be Moving AgainMicrosoft has been snoozing since the summer, but some traders may think the tech giant is ready to start moving again.
The first pattern on today’s chart is the pair of bullish gaps following quarterly results, which may reflect positive sentiment.
Second is the August 15 weekly close of $520.17. MSFT slipped under that line in the second half of August and spent all of September below it. Prices crossed the resistance yesterday. That could suggest a breakout has begun.
Third, Bollinger Band Width fell to its narrowest level since April 2024. Are prices set to expand following such compression?
Next, the stock has clawed back above its 50-day simple moving average. The 8-day exponential moving average (EMA) is also above the 21-day EMA and MACD is rising. Those signals may be consistent with bullish direction.
Finally, MSFT is an active underlier in the options market. (Its average daily volume of 296,000 contracts ranks 16th in the S&P 500, according to TradeStation data.) That could help traders take positions with calls and puts.
TradeStation has, for decades, advanced the trading industry, providing access to stocks, options and futures. If you're born to trade, we could be for you. See our Overview for more.
Past performance, whether actual or indicated by historical tests of strategies, is no guarantee of future performance or success. There is a possibility that you may sustain a loss equal to or greater than your entire investment regardless of which asset class you trade (equities, options or futures); therefore, you should not invest or risk money that you cannot afford to lose. Online trading is not suitable for all investors. View the document titled Characteristics and Risks of Standardized Options at www.TradeStation.com . Before trading any asset class, customers must read the relevant risk disclosure statements on www.TradeStation.com . System access and trade placement and execution may be delayed or fail due to market volatility and volume, quote delays, system and software errors, Internet traffic, outages and other factors.
Securities and futures trading is offered to self-directed customers by TradeStation Securities, Inc., a broker-dealer registered with the Securities and Exchange Commission and a futures commission merchant licensed with the Commodity Futures Trading Commission). TradeStation Securities is a member of the Financial Industry Regulatory Authority, the National Futures Association, and a number of exchanges.
Options trading is not suitable for all investors. Your TradeStation Securities’ account application to trade options will be considered and approved or disapproved based on all relevant factors, including your trading experience. See www.TradeStation.com . Visit www.TradeStation.com for full details on the costs and fees associated with options.
Margin trading involves risks, and it is important that you fully understand those risks before trading on margin. The Margin Disclosure Statement outlines many of those risks, including that you can lose more funds than you deposit in your margin account; your brokerage firm can force the sale of securities in your account; your brokerage firm can sell your securities without contacting you; and you are not entitled to an extension of time on a margin call. Review the Margin Disclosure Statement at www.TradeStation.com .
TradeStation Securities, Inc. and TradeStation Technologies, Inc. are each wholly owned subsidiaries of TradeStation Group, Inc., both operating, and providing products and services, under the TradeStation brand and trademark. When applying for, or purchasing, accounts, subscriptions, products and services, it is important that you know which company you will be dealing with. Visit www.TradeStation.com for further important information explaining what this means.
MSFTCO trade ideas
MSFT Daily: Eyes on 555 - Will 515-520 Support Hold?MSFT Daily: Eyes on 555 - Will 515-520 Support Hold?
Microsoft (MSFT) has established a solid bullish recovery from the "Key Support 500" level and is currently consolidating above the flipped "Current Support 515 to 520" zone.
The immediate bullish objective is a push towards "Initial Resistance near 540," as indicated by the projected price paths.
A decisive breakout above 540 would likely accelerate momentum towards the primary "Target 555," revisiting previous highs.
Holding the 515-520 support area is essential to maintain the current uptrend; failure to do so could trigger a retest of the foundational 500 level.
Disclaimer:
The information provided in this chart is for educational and informational purposes only and should not be considered as investment advice. Trading and investing involve substantial risk and are not suitable for every investor. You should carefully consider your financial situation and consult with a financial advisor before making any investment decisions. The creator of this chart does not guarantee any specific outcome or profit and is not responsible for any losses incurred as a result of using this information. Past performance is not indicative of future results. Use this information at your own risk. This chart has been created for my own improvement in Trading and Investment Analysis. Please do your own analysis before any investments.

When will Microsoft (MSFT) close its monthly gap?NASDAQ:MSFT
Microsoft (MSFT) saw a 7% gap up following its earnings report in May.
To fill this gap, the stock would need to drop about 28.59% from its high, or 23.33% from the current level.
Historically, gaps on the monthly chart have eventually been filled, so it’s reasonable to assume that this one might be as well in the long term.
However, given that MSFT is one of the top three companies by market capitalization, a decline of more than 20% would likely trigger a broader correction across the Nasdaq index.
Therefore, this potential gap fill should not be seen merely as an individual stock event, but rather as part of a broader market correction scenario.
Your follow and boost would mean a lot. 🚀
I am Korean and I used Google Translate.

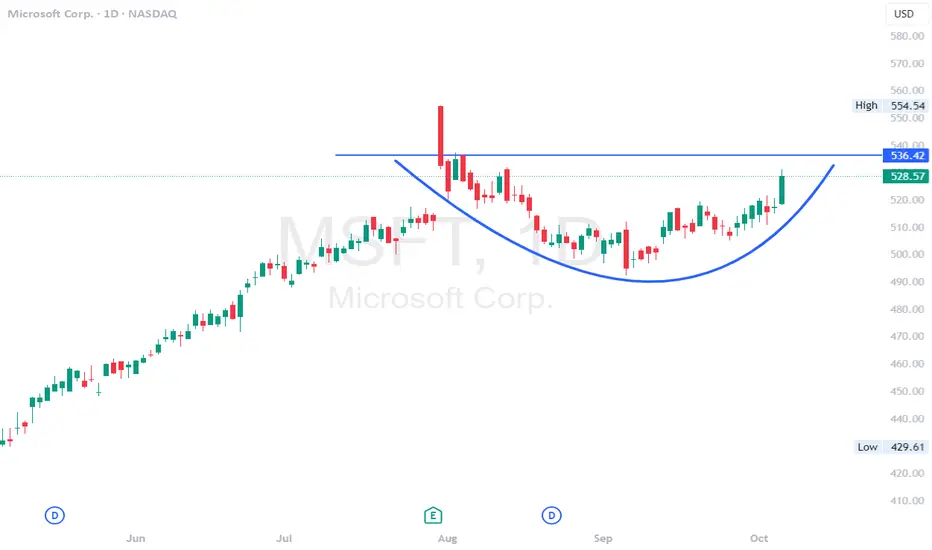
MSFT - Cup style reversal here. upside move incomingMSFT - Stock making a cup style reversal on the daily time frame after post earnings pull back. Looking for calls above $530 for a move towards $536 and $550. 2 months out calls coming in here. looking strong for a move to the upside.
How to study a stock chart for earnings season.Earnings Season 3rd Quarter 2025 starts October 13. Getting reading for earnings seasons is a critical part of being successful trading stocks or investing in stocks. Rather than chasing an HFT gap up or a "good news earnings report" you can learn to study and read the chart and have a good indication of what that report is going to show for that company.
MSFT is in a platform trend which is a narrow trend sideways that has consistent highs and lows. If price moves above or below the Buy Zone, then the price quickly moves back into that range of price as Dark Pool accumulation TWAP orders pause when the stock is above its fundamentals. When it drops below the fundamental levels then the Dark Pool TWAP orders trigger and move the stock slightly upward back into the platform range of price.
There are also professional independent traders in the mix. Some are individual professional traders working from their home office and Trading as a Business. Others are small Trading companies that cater to the Buy Side Institutions and provide trading of stocks on behalf of the Dark Pool corporation. Both are growing in numbers. These are the professionals you should b trading with.
Unfortunately, most times retail day and swing traders are chasing Small Funds Managers who do not typically use technical analysis. VWAP orders trigger more and more orders as volume increases. This causes panic selling or speculative buying. It also alerts the professionals who trade against the smaller funds managers.
Earnings Season is an important time to be ready to trade. a Platform trend is more profitable than most other trading styles, takes far less work and time, and nets higher income due to the longer hold time.

$MSFT Call Alert – Oct 31 ’25 $515 Calls | 125% ROI PotentialEnter: NASDAQ:MSFT OCT 31 2025 $515 CALLS
Buy in Price: $16.89 - $17.00
Take Profit: $38.00
Stop Bleeding: $14.86
ROI Potential: 125%
Exit Within: 160 Minutes
Possible break of Upper TrendlinePrice looks like it is set to break this trendline. If it breaks, watch for a retest and buy in after confirmation.
*Not financial advice, or whatever.
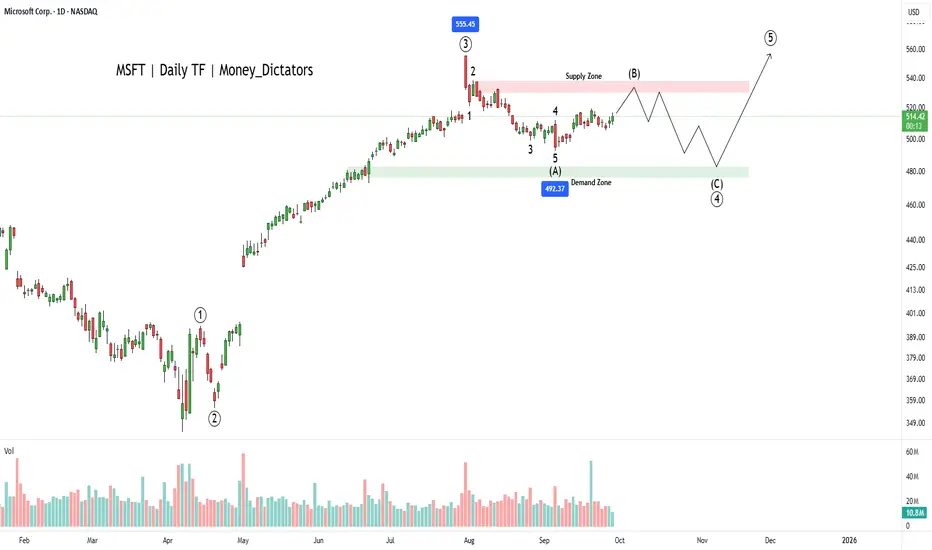
Why MSFT Could Be a Smart Pick in 2025?MSFT has bullish signals from the multiple moving averages, RSI and volume analysis. However, wave principle asks evidence from the buyers. The wave count suggests that the corrective wave (B) is ongoing, and bears will control the final wave of the primary wave 3.
Wave C will start falling nearby the supply zone and high of the 2nd wave of wave intermediate wave A. Wave C can fall up to 476 which will be the strength for wave primary wave 5. As per the chart, breakout above 540 will be a good signal for bulls to take charge back.
Zones:
Supply zone: 538 - 528
Demand zone: 482 - 476
I will update the chart and details shortly.
MSFT Hovering at $520 – Will Gamma Unlock the Next Leg? (Oct 2)Intraday (15-Min Chart)
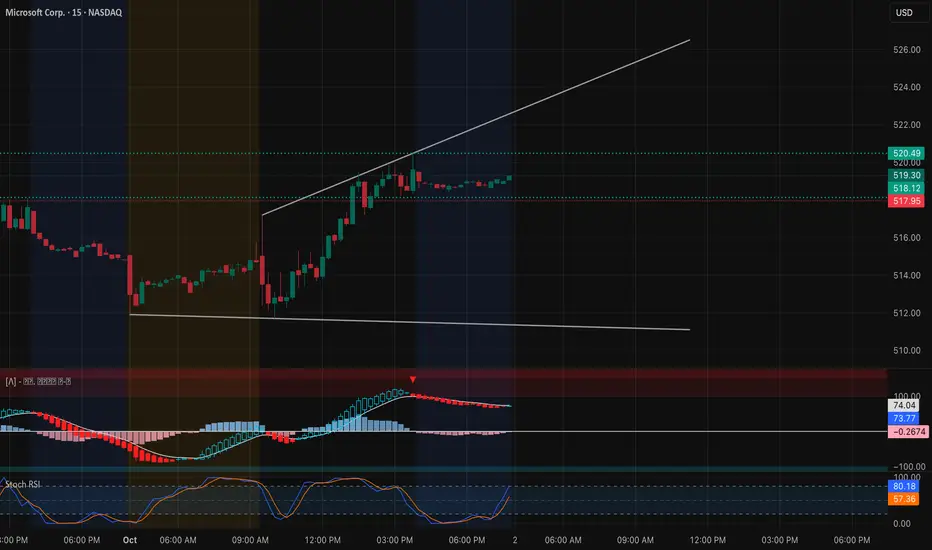
Microsoft extended its rally into the $519–$520 zone, where it’s consolidating after a strong push. On the 15-min chart, the trendline remains supportive, but momentum is starting to flatten. MACD is rolling sideways, and Stoch RSI shows MSFT is cooling after overbought readings earlier in the session.
* Immediate support: $518.1 intraday pivot, then $515.9 for trendline support.
* Upside trigger: A breakout above $520.5 could fuel a run toward 522–525.
* Downside risk: Break below $515 risks a pullback toward 511.7–510, where buyers likely defend.
Bias intraday: constructive above 515, but the $520 wall is proving sticky — momentum traders need a clean break.
Options / GEX (1-Hour Chart)
Gamma positioning highlights where the next move could emerge:
* Call walls: Clustered at 522.5 and 525, with a heavy stack at 525 acting as the gamma ceiling.
* Put walls: Strong at 510, deeper at 505 and 500, outlining the risk floor.
* Sentiment: Options flow isn’t overly bullish (only ~10% calls), showing weaker speculative appetite compared to TSLA/PLTR.
This suggests MSFT could remain range-bound if it fails to clear 520. A breakout through 522.5–525 would shift hedging dynamics bullish and potentially unlock 530–535 as upside targets. Conversely, rejection here pulls MSFT back toward 510–505.
My Thoughts
For Oct 2, MSFT is coiling at resistance. Intraday plays favor long scalps above 515 targeting 522–525. For options traders, the clean play is a 520/525 call spread, defined risk into the gamma ceiling. If weakness emerges under 515, hedges with short puts toward 510 provide protection.
Bias: Bullish leaning, but the real breakout requires 522.5+. Until then, MSFT likely chops between 515–520.
Disclaimer: This analysis is for educational purposes only and does not constitute financial advice. Always do your own research and manage risk before trading.
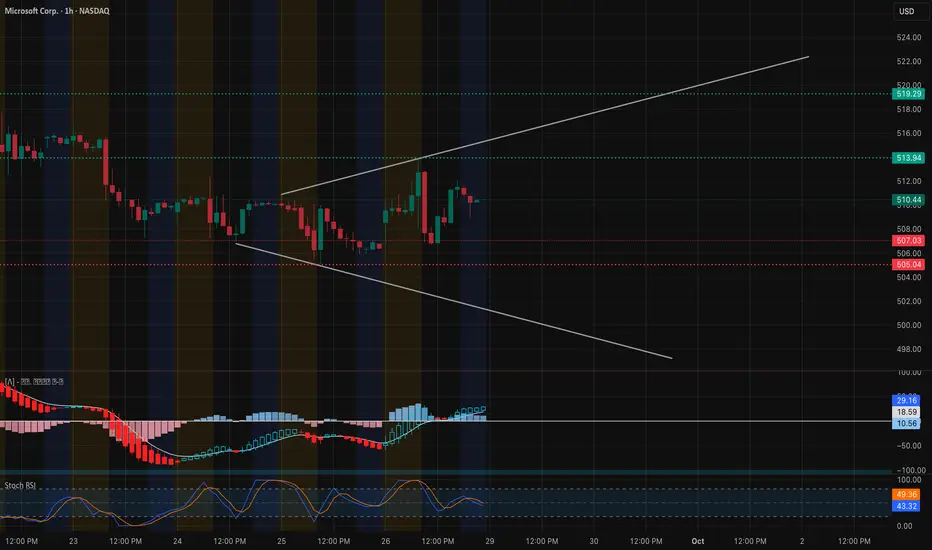
MSFT Setting Up for a Key October Move! 🚀Intraday View (15-Min Chart)
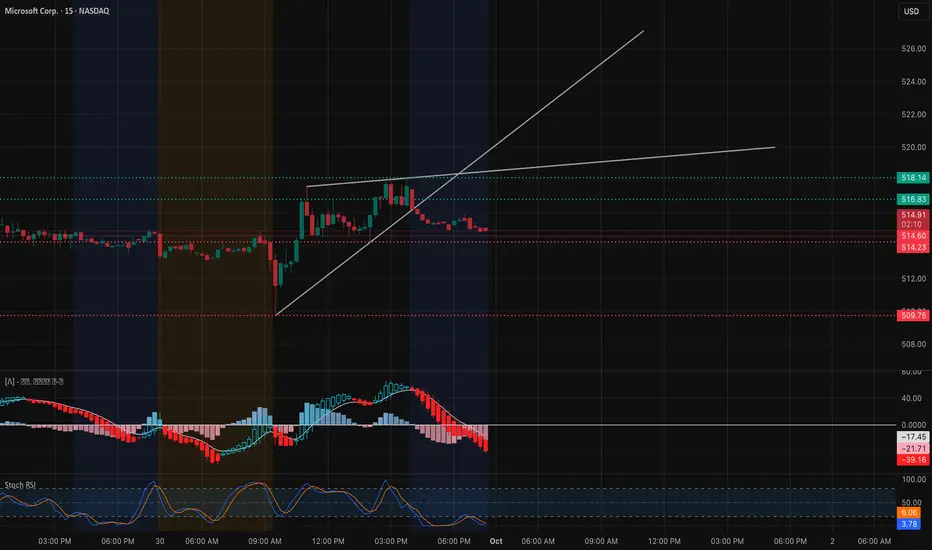
MSFT opened strong but momentum cooled into the close. Price is consolidating just above $514 support, with rejection near $518 showing sellers stepping in. The short-term trendline has already broken.
* Support Levels: $514.20, $509.75
* Resistance Levels: $516.80, $518.14
* Indicators: MACD is firmly red with downside momentum. Stoch RSI is bottoming, hinting at a possible oversold bounce.
📌 Intraday Thought: Watch $514 — if it holds, bounce potential back to $516.8–$518. A break below exposes $510. Scalpers can trade the $514 support bounce with tight stops, or fade $518 if retested.
Options & Swing View (1H + GEX)
The Gamma map is clear:
* Call positioning: Heavy between $522–$530, with a big wall at $524.
* Put support: Strong around $507–$505.
This sets up a coil between $514–$524. A breakout over $524 could fuel a gamma squeeze toward $530+, while failure at $514 risks a drop back to $507.
* Bullish Play: Debit call spread targeting $524 → $530 if $518 reclaims with volume.
* Bearish Hedge: Short-dated puts toward $514 → $507 if support cracks.
* Neutral Play: Iron condor between $507–$524 to capture premium while MSFT stays pinned.
My thoughts:
MSFT is gearing up for volatility into October. Intraday pressure favors caution, but the GEX landscape signals explosive potential if $524 breaks. Best approach: scalp intraday ranges, but keep eyes on $524 breakout vs. $507 breakdown for swing setups.
Disclaimer: This analysis is for educational purposes only and does not constitute financial advice. Always do your own research and manage risk before trading.
MSFT / MICROSOFT / Fractal and Seasonality inspiredHere is my view on MSFT from seasonal and fractal point of view.
Price gonna break the recent 516 high, shall turn and break recent 505 low than head upside for end of the year ralley.
i put 2 Longs into the chart. Smaller for first partial take profit and the larger one for rest.
All this should play out until 15th of November or latest until End of January.
After January 2026 downside. Be careful!
(This is not a trade call, just educational analysis, trade at your own risk)
Feel free to comment so we can learn and improve together!
Cheers!
MSFT – Building a Base Breakout as Gamma Aligns Price. Sep 291-Hour Technical Outlook
Microsoft is forming an expanding wedge after a week of sideways-to-up action. Price is trading around $510–$511, testing mid-wedge support after a strong bounce from the $505 floor. MACD histogram is positive and climbing, and the Stoch RSI is curling up from mid-range, signaling that momentum is resetting for another potential leg higher.
Key resistance to watch is $513.9, with heavier supply stacked at $519–$520. On the downside, the critical support remains $505, with a safety net near $500.
Gamma Exposure (GEX) Confirmation
Options positioning provides solid backup to the chart:
Largest positive GEX / Call Resistance sits at $512, now acting as the key breakout trigger.
Next call walls cluster at $519–$520 (~44% call interest), matching the top of the expanding wedge.
On the downside, put support is significant at $500, aligning with the technical safety zone.
This GEX structure suggests that a strong hourly close above $513.9 could unleash dealer hedging that pushes MSFT quickly toward $519–$520. If $505 fails, negative gamma flow may accelerate selling to the $500 area.
Trade Ideas & Option Plays for This Week
Bullish Play: Go long on a sustained move above $513.9, targeting $519–$520. Options: 1-week 515 calls or 515/520 call spreads to keep risk contained.
Protective Hedge / Bearish Setup: Short below $505, looking for a slide to $500. Suitable instruments: 505/500 put spreads or short-dated puts.
With IVR near 21.4 and IVx around 22.9, premiums are relatively mild—ideal for debit spreads.
My Take
MSFT is showing early signs of accumulation inside a broadening formation. Gamma levels perfectly reinforce the $512 breakout line and the $505 fail-safe. Unless sellers regain control under $505, the stock leans toward a bullish continuation this week.
Disclaimer: This analysis is for educational purposes only and does not constitute financial advice. Always do your own research and manage risk before trading.
MSFT: The “Top Pick” Trap? Or Real Breakout Fuel?Microsoft is testing a critical support zone — and with Morgan Stanley just naming it a top pick in tech, buyers may be gearing up for control. 📈
Quantitative stats back the setup: Sortino Ratio of 0.42 and 90% win rate on this pattern.
👉 What’s your call — breakout to new highs… or one more dip before the rally?

Microsoft Challenges Chinese Tech Firms with Its Expansion into Microsoft Expands Its Healthcare Footprint: Pressure on Chinese Tech Stocks and Strengthening Market Value
By Ion Jauregui – Analyst at ActivTrades
Healthcare technology stocks in Hong Kong saw significant declines on Thursday, affected by a wave of profit-taking following a strong rally and reports confirming Microsoft’s (NASDAQ:MSFT) growing presence in the digital health sector. The move reinforces the global outlook of the U.S. company, which continues to diversify its growth lines beyond corporate software and cloud services.
From a macroeconomic perspective, the announcement comes at a time when the global tech market is showing signs of sector rotation. After months of favoring pharmaceutical and biotech firms, investors are beginning to shift toward large technology players with solid financial structures and strong innovation capacity, such as Microsoft. The company recently signed an agreement with Harvard University to enhance healthcare content within its AI assistant Copilot, representing a decisive step toward integrating intelligent medical tools into the generative AI ecosystem.
Dominic King, Microsoft AI’s Vice President of Health, stated that the goal is for Copilot to provide more accurate and professional health-related responses than any other tool currently available. This move could intensify global competition in the digital healthcare sector, particularly for Chinese health-tech firms that may face pressure in international markets from Microsoft’s innovation capacity and vast resources.
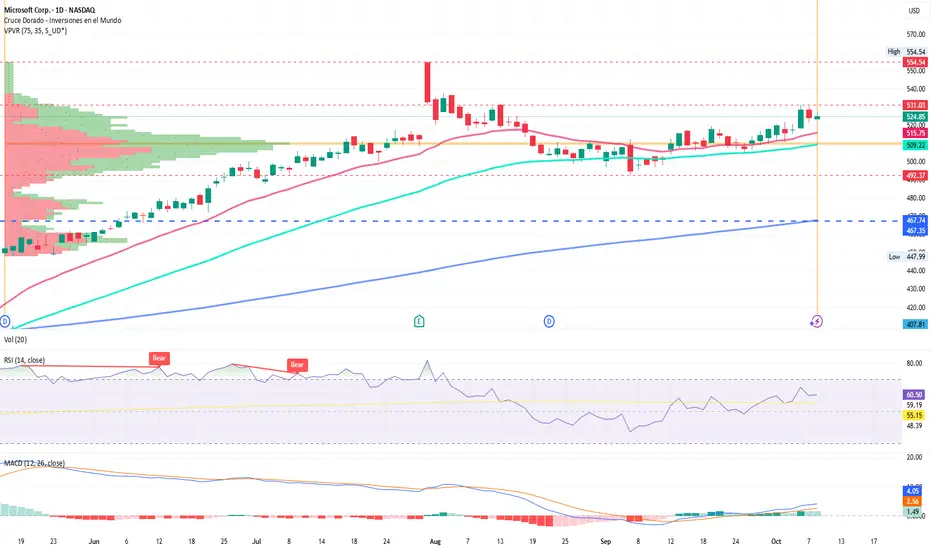
Microsoft Analysis (Ticker: MSFT)
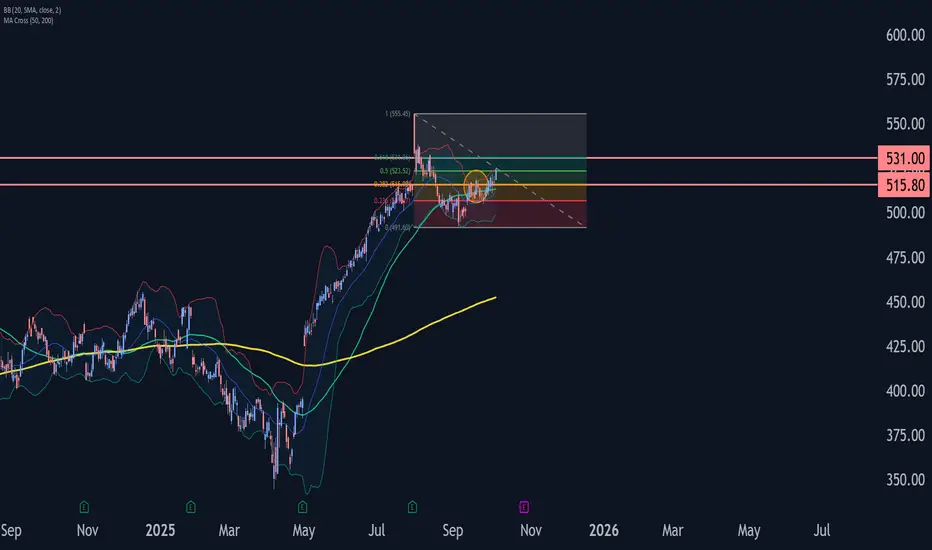
From a technical standpoint, Microsoft maintains a consolidated bullish structure, supported by strong fundamentals and sustained growth in its AI and cloud segments. Following the recent rally that pushed prices to a weekly high of $531.03, the stock stabilized around $524.85, a level that coincides with a consolidation zone within its ascending channel.
The Point of Control (POC) is currently located near $509.80, where the price has repeatedly found technical support. Key support levels lie at $515 and then $509, while the structural range support remains at $492.37. On the upside, a sustained break above $531 could project the stock toward July’s high at $554.54, reinforcing the continuation of the bullish trend. Failure to hold this level could trigger a correction toward the lower band of the $492.37–$531.03 range.
The daily RSI, at 60.5 points, suggests that the uptrend still has room for extension. The moving averages crossover that began in September remains active, supporting the price above the 50-day moving average, while the MACD maintains a positive, upward configuration consistent with ongoing momentum.
Microsoft: A Global Leader
In summary, Microsoft continues to strengthen its position as a global technology leader, channeling its AI expertise into strategic sectors such as healthcare. This development not only puts pressure on Asian competitors but also reinforces investor confidence in Microsoft’s long-term growth potential.
*******************************************************************************************
The information provided does not constitute investment research. The material has not been prepared in accordance with the legal requirements designed to promote the independence of investment research and such should be considered a marketing communication.
All information has been prepared by ActivTrades ("AT"). The information does not contain a record of AT's prices, or an offer of or solicitation for a transaction in any financial instrument. No representation or warranty is given as to the accuracy or completeness of this information.
Any material provided does not have regard to the specific investment objective and financial situation of any person who may receive it. Past performance and forecasting are not a synonym of a reliable indicator of future performance. AT provides an execution-only service. Consequently, any person acting on the information provided does so at their own risk. Political risk is unpredictable. Central bank actions can vary. Platform tools do not guarantee success.
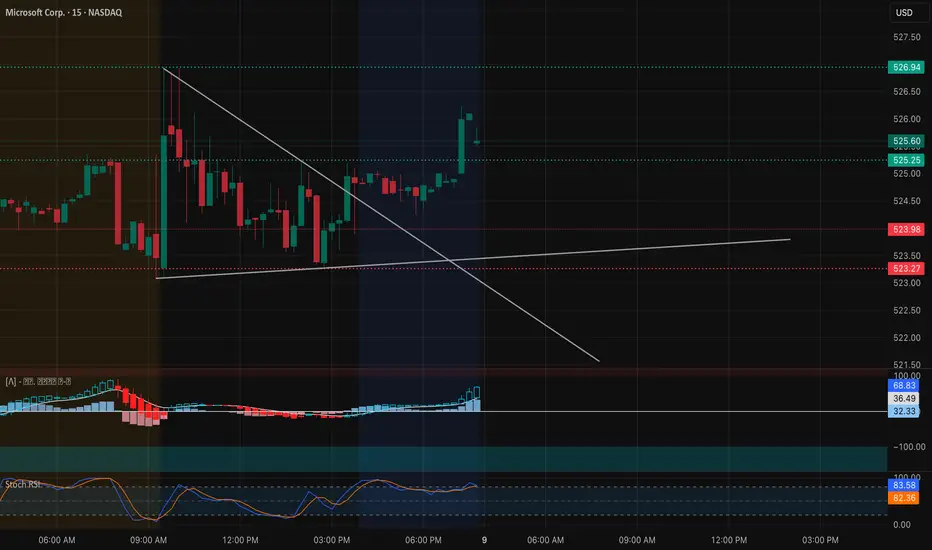
MSFT Oct. 9 — Bulls Regain Momentum Above $525Eyeing $531 Breakout 🚀
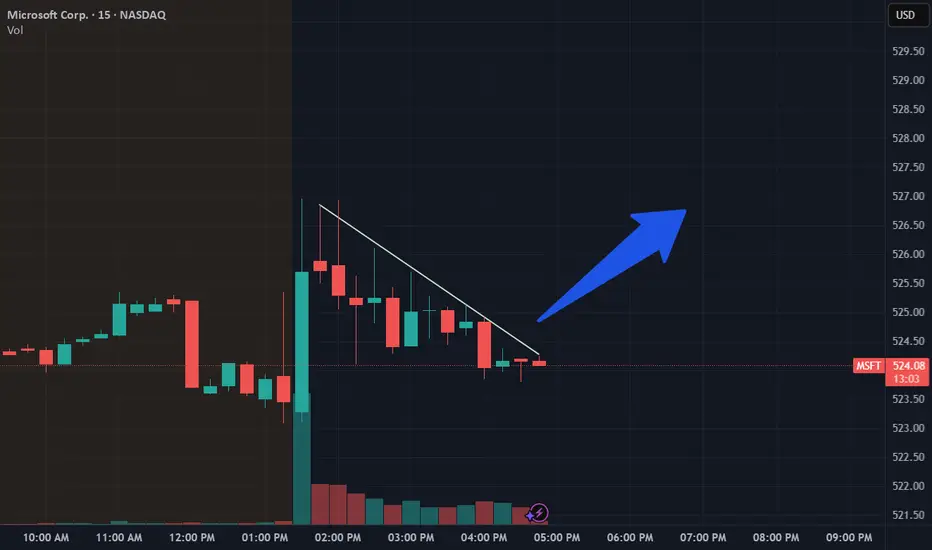
Microsoft (MSFT) is showing a strong bullish reversal after clearing its descending trendline on the 15-minute chart. Price reclaimed $525 support with a solid impulsive candle, confirming a short-term CHoCH followed by upward momentum. The breakout from the compression zone has opened room toward $528–$531 resistance.
MACD flipped bullish with increasing histogram bars, while Stoch RSI remains elevated but not yet signaling exhaustion. As long as $523 holds, momentum favors continued upside into the next gamma resistance zone.
On the 1-hour chart, MSFT is trading between $517.5 (HVL support) and $531 (gamma resistance) — a clean range that aligns with its recent breakout structure. Volume confirms accumulation near $522–$525, reinforcing the bullish bias for continuation.
Support and Resistance Levels:
* Immediate Resistance: $526.9 → $528
* Major Resistance (Gamma Wall): $531 → $535
* Immediate Support: $523.9 → $523.2
* Key Support Zone: $517.5 → $511
GEX & Options Sentiment (1H GEX Chart):
* The highest positive Call Gamma sits near $531, forming the next magnet if momentum continues.
* Strong Put Support lies around $505–$500, providing a solid floor for bulls.
* IVR 33.2 and Call sentiment 11.8% suggest room for fresh upside exposure — a potential gamma squeeze if MSFT breaks $528.
* The GEX curve steepens positively above $525, supporting price expansion once breakout volume sustains.
Trade Scenarios:
Bullish Setup:
* Entry: Above $526 breakout
* Target 1: $528
* Target 2: $531
* Stop-Loss: Below $523
* Rationale: Clear trendline break, bullish MACD momentum, and supportive GEX profile indicate strong continuation potential.
Bearish Setup:
* Entry: Below $523 breakdown
* Target 1: $517.5
* Target 2: $511
* Stop-Loss: Above $526
* Rationale: Rejection at $526.9 could trigger a pullback toward the HVL range before rebounding.
MSFT has regained strength with clear bullish intent above $525. Watch for volume confirmation above $526 for the next leg toward $531. As long as price stays above $523, bulls remain firmly in control.
Disclaimer:
This analysis is for educational purposes only and does not constitute financial advice. Always do your own research and manage your risk before trading.
If anyone needs me to TA any stock, PM me.
MSFT Oct 7 – Testing Mid-Channel Support Before Next Breakout15-Min Chart Analysis (Intraday Trading Setup):
MSFT continues to hold its ascending channel firmly, with price now consolidating near $527.33 after rejecting the upper boundary at $531. The structure shows clean bullish control, but short-term momentum has cooled off — typical of a mid-channel reset before continuation.
The MACD has crossed down from high levels, reflecting a temporary cooldown, while the Stoch RSI sits near oversold territory (13.23), hinting that buyers could soon regain strength.
If MSFT holds the $520.50–$522 demand zone (where previous breakout originated), the bullish bias remains intact.
A retest and bounce from that zone would likely push MSFT back toward $530.95 → $535, aligning with channel resistance and previous intraday highs.
However, if $518 breaks decisively with volume, a short-term correction toward $516–$514 becomes likely before the next leg higher.
1-Hour GEX Confirmation (Options Sentiment Insight):
Gamma Exposure (GEX) levels align perfectly with this 15-min setup:
* Strong CALL walls sit at $528–$536, showing continued bullish hedging pressure.
* Highest positive NETGEX is concentrated around $540, signaling potential upside magnet if momentum resumes.
* Major PUT support lies between $505–$510, marking it as a deep safety net where downside gamma is likely to stall.
This configuration favors a bullish-to-neutral bias for the week — suggesting dips are likely to be absorbed, and any bounce above $530 could accelerate toward $535–$540, backed by dealer hedging.
My Thoughts:
The technical and options data both tell the same story: MSFT is in a controlled bullish channel with institutional flow still supportive. The pullback looks like a healthy reset rather than reversal. I’ll be watching $520 closely — a hold there could offer a strong risk/reward setup for a continuation play.
If price reclaims $530.95, that could trigger breakout momentum, potentially reaching the $535–$540 zone this week.
Options Outlook (Oct 7–11):
* Bullish setup: Buy-to-open 530C or 535C (Oct 11 expiry) if price breaks and holds above $530.50 with volume confirmation.
* Bearish scalp: Consider 520P only if price rejects hard below $517.50, confirming breakdown structure.
* Implied Volatility: IVR 30.6 with stable IVx (26.4) — conditions still favorable for directional trades with measured premium exposure.
Conclusion:
MSFT remains bullish as long as $520 holds. A sustained move above $530.95 will confirm strength toward the next gamma target near $540. Watch for volume-supported reclaim and MACD reversal for the next leg higher.
Disclaimer: This analysis is for educational purposes only and does not constitute financial advice. Always do your own research and manage your risk before trading.

Microsoft Wave Analysis – 6 October 2025
- Microsoft rising inside impulse wave (3)
- Likely to rise to resistance level 531.00
Microsoft recently broke the resistance zone between the key resistance level 515.80 (which stopped the previous impulse wave (1) in September) and the 50% Fibonacci correction of the downward correction from July.
The breakout of this resistance zone accelerated the active medium-term impulse wave (3) from the end of September.
Given the clear daily uptrend, Microsoft can be expected to rise to the next resistance level 531.00 (former top of wave B from August).
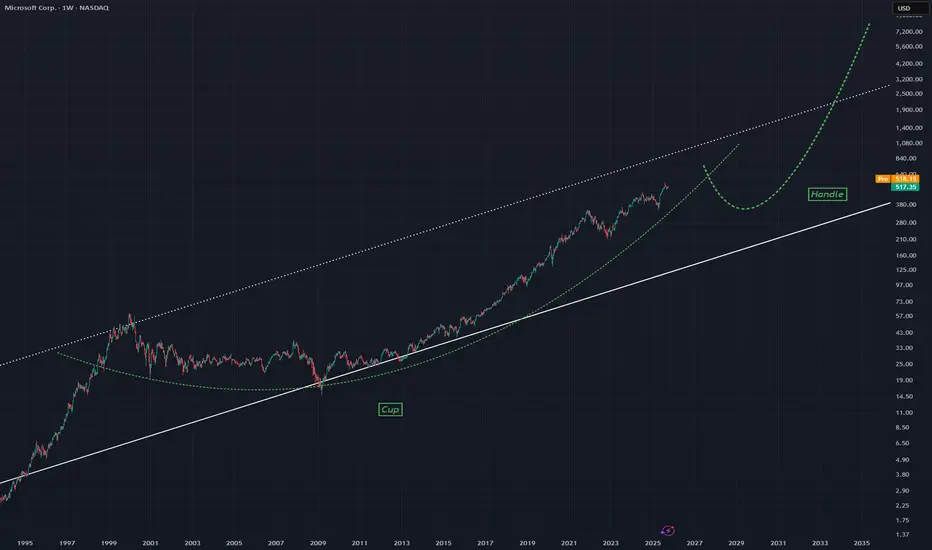
MSFT - Long Term Cup and Handle The price rising now could be considered a large cup formation with the handle still yet to be seen following a bearish move
Cup and Handle patterns are considered bullish on this timeframe.
Lower solid white trend line is a well respected trend line.
Weekly chart
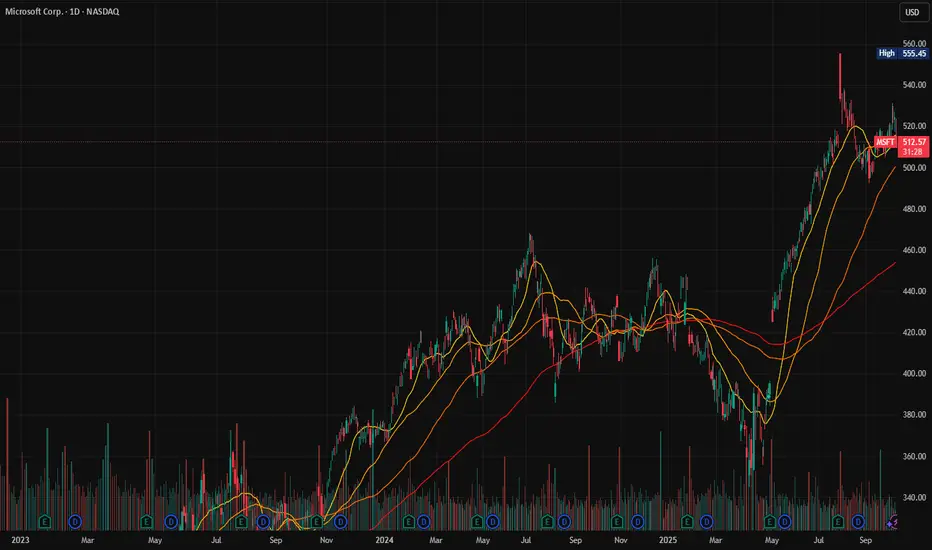
Microsoft Macro BullMSFT is currently in grand wave 3/5!
PT: ~$500
Lengthening cycles & diminishing returns!
2nd Great Recession - Corrective Grand Wave 4 - 60-80% correction
Roaring 20s after - liquidity for final grand wave 5!

MSTF OCT 2025MSFT (4H): Price is coiling inside a 510–525 range after reclaiming the 500 area. Buyers continue to defend 500/490 (key support cluster). Overhead, prior institutional distribution remains at 550–565 (≈15.9B sold). Acceptance above 550 would imply absorption of that supply; rejection keeps price rotating back toward 500/490 and potentially 480/470.
Target to the upside
550 first pass; stretch to 560–565 if supply is absorbed
Target to the downside
500/490; extension to 480–470 if that cluster breaks
#MSFT #globaltrade #investment #investing #stockmarket #wealth #realestate #markets #economy #finance #money #forex #trading #price #business #currency #blockchain #crypto #cryptocurrency #airdrop #btc #ethereum #ico #altcoin #cryptonews #Bitcoin #ipo

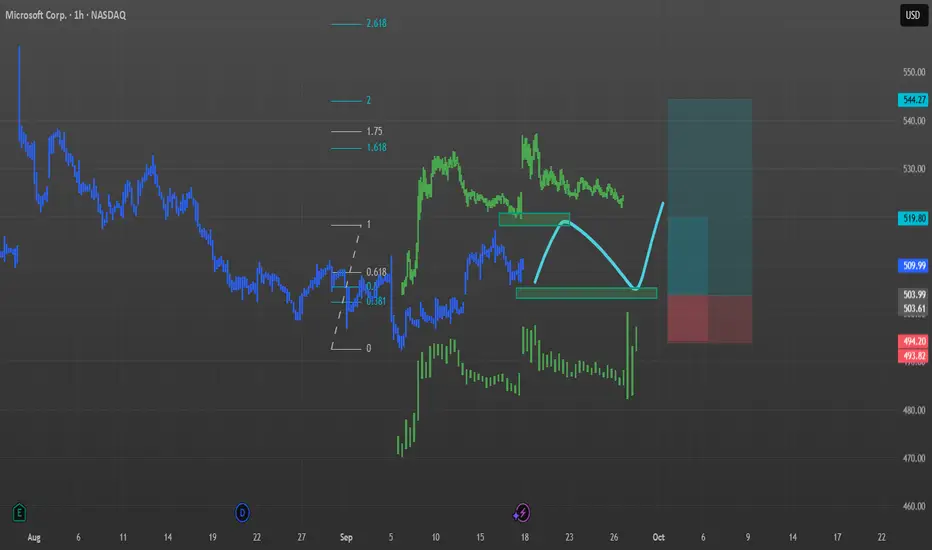
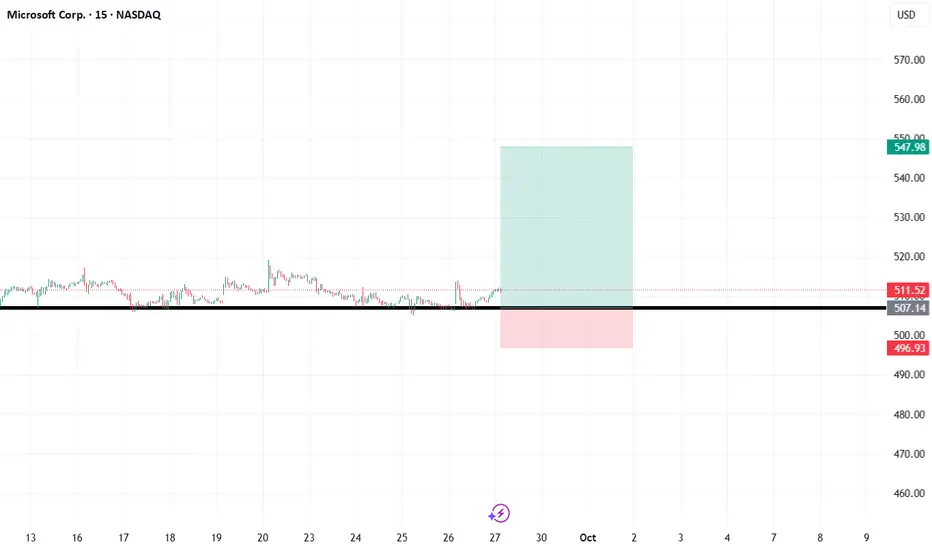
MSFT: Potential Long Opportunity from Key Support LevelThis is a technical analysis of Microsoft Corp. (MSFT) on the 15-minute chart. The idea presented is based on the price action consolidating above a significant support level, suggesting a potential move to the upside.
Analysis:
The chart indicates that MSFT has been trading within a range, establishing a strong horizontal support level at approximately $507.14. The price has respected this level on multiple occasions, indicating strong buying interest and accumulation in this zone. This repeated defense of the support line suggests it is a critical level to watch.
The current trade setup anticipates a bounce from this consolidation area, betting on the continuation of the support's strength.
Trade Setup:
Entry: The proposed entry is around the current price level of $511.52, acting on the assumption that the support will hold.
Take Profit: The upside target is set at $547.98. This level represents a significant potential reward if the bullish momentum resumes.
Stop Loss: A stop loss is placed at $496.93, positioned below the key support zone. This is a crucial risk management measure to protect against a breakdown if the support level fails.
Risk/Reward:
This setup offers a favorable risk-to-reward ratio. By risking the distance between the entry and the stop loss for the potential gain up to the take-profit level, traders can aim for a reward that is substantially larger than the initial risk.
Disclaimer: This analysis is for educational and informational purposes only and should not be considered investment advice. All trading involves risk. Please conduct your own research and due diligence before making any trading decisions.
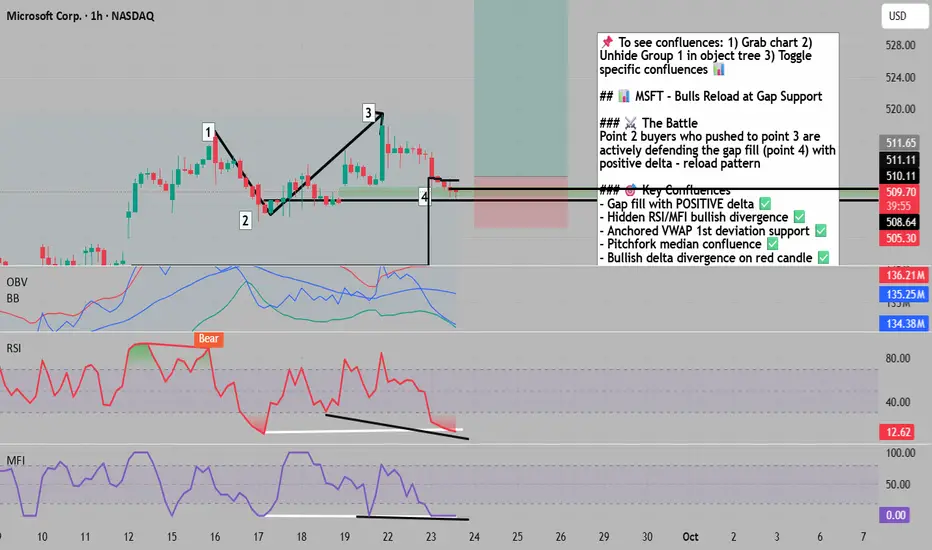
Bulls Reload at Gap Support - Spring Loads for Breakout📌 To see my confluences and/or linework, step 1: grab chart, step 2: unhide Group 1 in object tree, step 3: hide and unhide specific confluences. 😊
🎯 MSFT: Bulls Reload at Gap Fill - Spring Loads for Breakout
The Market Participant Battle:
The bulls who drove price from point 2 to point 3 have successfully defended their conviction zone at point 4 (the gap fill area). When point 3 closed above point 1, it validated point 2 buyers' strength. Now these same participants are reloading at their original entry zone with positive delta confirmation, setting up for another leg higher as buyers overwhelm sellers at this critical support level.
Confluences:
Confluence 1: Gap Fill Support with Positive Delta
The gap area at point 4 represents where buyers previously showed extreme conviction, creating upward price gaps to demonstrate urgency. Price has returned to this zone with POSITIVE volume delta, showing buyers are actively defending and accumulating at these levels. The Volume Footprint confirms buying dominance at this critical level, suggesting institutional accumulation rather than distribution.
Confluence 2: Hidden Bullish Divergence on RSI/MFI
Both RSI and MFI display hidden bullish divergences - price makes higher lows while indicators make lower lows. Additionally, both oscillators are oversold at the gap area (point 4), creating a second-degree layered bullish divergence. This technical setup typically precedes strong upward moves, particularly when occurring at historically significant price levels.
Confluence 3: Anchored VWAP Support Convergence
The anchored VWAP from point 1 brings point 4 precisely to the 1st standard deviation - a mathematically significant support level. This same reaction occurs when anchoring VWAP at the previous gap, suggesting algorithms and institutions are defending this price zone. The developing POC shows buyers stepping in below and then pushing price above, indicating active accumulation.
Confluence 4: Pitchfork Median Line Confluence
Anchoring the pitchfork at pivots 0, 1, and 2 creates a median line that intersects perfectly with the turning point where point 2 buyers defeated sellers from point 1. This geometric confluence at the gap fill zone suggests a high-probability bounce point.
Confluence 5: OBV Bollinger Band Extreme & Delta Divergence
The OBV touching the lower Bollinger Band extreme marks a capitulation point. Combined with the current candle showing bearish price action but BULLISH delta (buyers absorbing selling), this creates a powerful bullish divergence signal.
Web Research Findings:
- Technical Analysis: RSI at 64.861 suggests Buy signal, MACD at 2.850 indicates Buy
- Recent News/Earnings: Q4 earnings beat with $3.65 EPS vs $3.37 expected, revenue $76.44B vs $73.81B expected
- Analyst Sentiment: Average 12-month price target $625.78 with 20.82% upside potential
- Data Releases: Next earnings late October 2025
- Interest Rate Impact: Quarter-point Fed cut implemented with more cuts signaled for 2025
Layman's Summary:
Microsoft crushed earnings with AI and cloud revenue exploding. The stock pulled back to a key support level where big buyers previously showed strong interest (the gap). Now they're buying again at these levels (positive delta), while technical indicators are oversold and showing bullish divergences. With Fed rate cuts helping tech stocks and analysts targeting 20% upside, this looks like a solid reload opportunity.
Machine Derived Information:
- Image 1: Channel pattern with numbered reference points - Significance: Shows clear support test at gap fill area - AGREES ✔
- Image 2: Volume Footprint with positive delta at point 4 - Significance: Confirms buyer accumulation at gap support - AGREES ✔
- Images 3-6: Multiple timeframe confirmation - Significance: Consistent support holding around $509-510 gap zone - AGREES ✔
- Images 7-8: Moving average structure - Significance: Price testing key support with oversold bounce setup - AGREES ✔
- Images 9-10: Current consolidation - Significance: Bullish flag formation after support test - AGREES ✔
Actionable Machine Summary:
All machine-derived analysis confirms the bullish thesis. The gap fill area is holding with positive delta, multiple timeframes show support at this zone, and the consolidation pattern suggests accumulation before the next leg up. The combination of technical support, positive volume dynamics, and oversold indicators creates a high-probability long setup.
Conclusion:
Trade Prediction: SUCCESS
Confidence: High
The convergence of gap support with positive delta, multiple bullish divergences, and strong fundamental backdrop creates an excellent risk/reward setup. Machine analysis confirms buyer accumulation at these levels. Target the recent high at $518 initially, then $525-530 on a breakout. Stop loss below $508 for a favorable 3:1 risk/reward ratio.
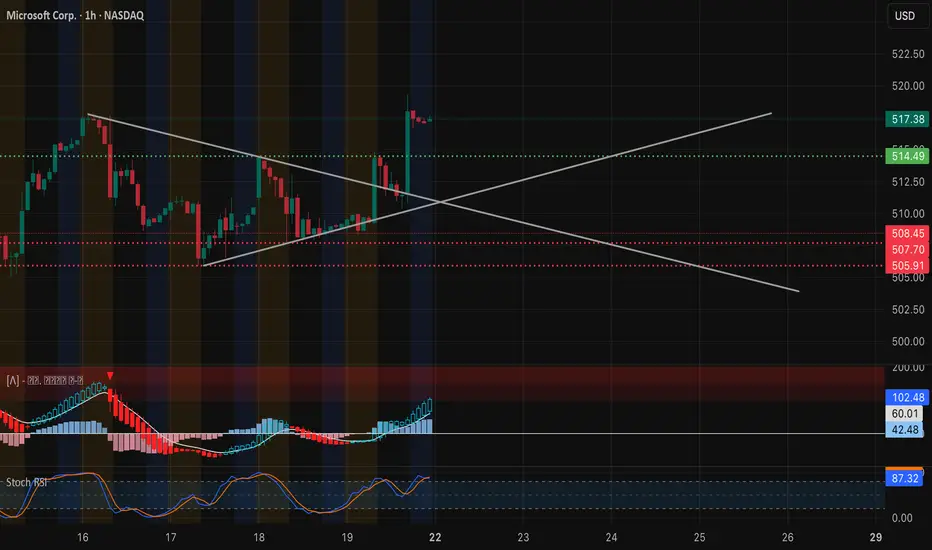
MSFT Sep 22 TA – “Breaking the Ceiling or Back to the Box?”
1️⃣ Big Picture on the 1-Hour Chart
* Price action: Microsoft closed around 517.38, breaking out of a multi-day consolidation. Price ripped above 514.5 and is holding gains just under the next resistance zone.
* Key levels:
* Resistance: 519.3 → 525 (recent high and call wall)
* Support: 514.5 → 510 (former resistance and trendline retest area)
* Indicators:
* MACD is strong and rising, showing solid bullish momentum.
* Stoch RSI is elevated near 87, signaling overbought conditions that could lead to a short pause or pullback.
The short-term structure is bullish, but after a sharp pop, MSFT might need to consolidate to build fresh energy.
2️⃣ GEX / Options Flow
* Largest call clusters appear around 525 and 540, with notable resistance at 520 already being tested.
* Key put support stands at 502.5, with heavier walls near 497.5 and 495.
* IVR sits at 7.8—low compared to historical norms—indicating that option premiums remain relatively cheap for quick trades.
The options board suggests market makers may try to pin MSFT in the 514–520 area if momentum cools. A decisive close above 520 would shift gamma flows toward 525–530 quickly.
3️⃣ Trading Thoughts & Suggestions
* Scalp / day trade: Watch for a sustained push over 519–520 with strong volume. Target 523–525, with a tight stop below 516.
* Support bounce: A controlled dip back to 514–515 that holds could provide a fresh long entry.
* Fade setup: A quick rejection at 520–523 with heavy selling pressure could send price back to 510–505.
4️⃣ Bottom Line
MSFT just broke out of its consolidation box and is testing key resistance. Bulls need a clean break above 520 for another leg higher. Bears want to see a rejection at 520 with a fade back toward 510.
Disclaimer: This is just market opinion for educational discussion. It’s not financial advice. Always manage your own risk before trading.