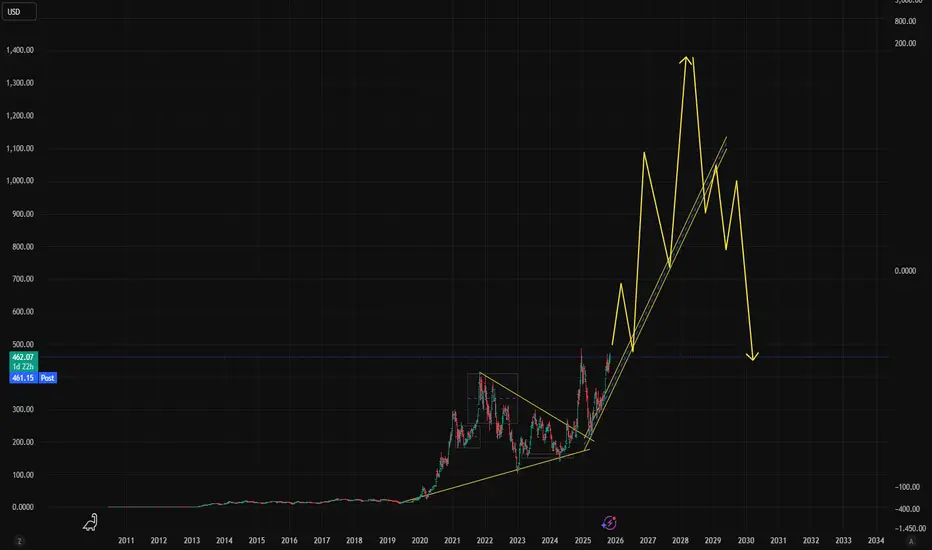
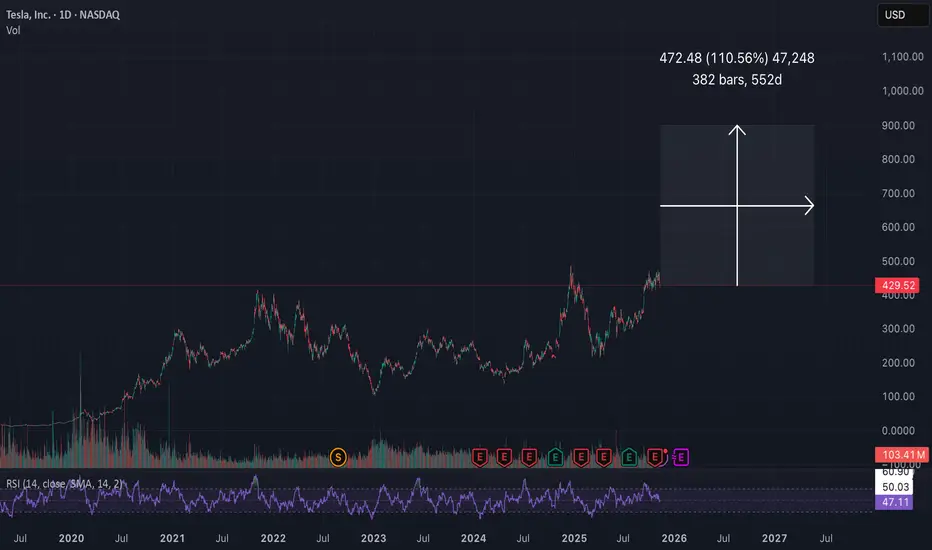
$TSLA - Reaching $1050 in 2026 is NOT a Dream!I can't ignore how bullish Tesla stocks chart looks right now. A massive ascending triangle with horizontal resistance ($430) was broken upwards and currently the price is consolidating above it, the resistance also perfectly correlates with the 0.786 lvl by Fibo.
Taking into account the overall company's plan regarding its growth (talking about recent news that 75% of shareholders voted in favour of a compensation plan that could award Musk up to $1T in stock if Tesla could achieve $8.5T market capitalization) , we can easily expect NASDAQ:TSLA to reach point 1 by Fibo ($1050 mark) .
By the way, by pointing out to the news about providing $1T, I don't mean that Tesla could really achieve $8.5T market capitalization any time soon, if only in 10 years as the overall money supply is drastically increasing. This news highlights the plan, in other words - creative way of sharing what is their "plan maximum" in terms of 10 years.
I believe Tesla will cost $2T in 2026.
Trade ideas

$TSLAHi we are back again with another banger: NASDAQ:TSLA
This is not financial advice but it is very much just key insight.
Here we have NASDAQ:TSLA trading at $462.07 with a potential %, which can bring 100%+ in profits.
Elon musk is doing great things for humanity, and TSLA is going to be a pillar of earths future success. With saying that we know Elon wont let earth of his NASDAQ:TSLA share holders down.
Possible bull market until the end of 2026 which is where we can start to see a break down in trend which would possibly be above $1000+ per share.
Don't forget to use your NASDAQ:TSLA shares to vote today :)
Thank You Elon Musk for everything !!
Don't forget to Comment Like & Share with a friend for good luck, peace out !!
Tesla IdeaShort to
430 then
up again
___________________________
summary
Tesla, Inc. continues to make bold promises about autonomous driving, robotaxis, Cybercab, and Optimus robots that remain unfulfilled or face legal and technological barriers.
TSLA's $1.5 trillion valuation is extremely high at a 348X Forward GAAP P/E, making the stock risky if Elon Musk's ambitious vision fails to materialize.
Despite repeated delays, broken promises, and shifting timelines, somehow investor enthusiasm for TSLA persists, driven by Musk's compelling narrative.
TSLA investors should exercise caution and conduct thorough due diligence rather than relying solely on Musk's visionary promises.
I continue to recommend a strong sale or even a long-term short of TSLA stock

TESLA Bearish Breakout! Sell!
Hello,Traders!
TESLA broke below a key horizontal structure, confirming a bearish breakout. SMC perspective suggests smart money could drive price to mitigate inefficiency near $375 support zone. Time Frame 12H.
Sell!
Comment and subscribe to help us grow!
Check out other forecasts below too!
Disclosure: I am part of Trade Nation's Influencer program and receive a monthly fee for using their TradingView charts in my analysis.

$TSLA double top neckline breakoutNASDAQ:TSLA double top neckline gave way, could be sending price toward the 𝗺𝗮𝗷𝗼𝗿 𝘀𝘂𝗽𝗽𝗼𝗿𝘁 𝘇𝗼𝗻𝗲 𝘀𝗶𝘁𝘁𝗶𝗻𝗴 𝗶𝗻 𝘁𝗵𝗲 𝟯𝟱𝟬–𝟯𝟳𝟬 𝗿𝗮𝗻𝗴𝗲. That area has been a key battleground, and it’s where bulls will need to dig in if they want to stop the slide.
Until that support is tested, this chart is telling a story of weakness after a failed attempt to push higher.
If the support zone holds, the reversal could be powerful. If it doesn’t, the next chapter could get rough.

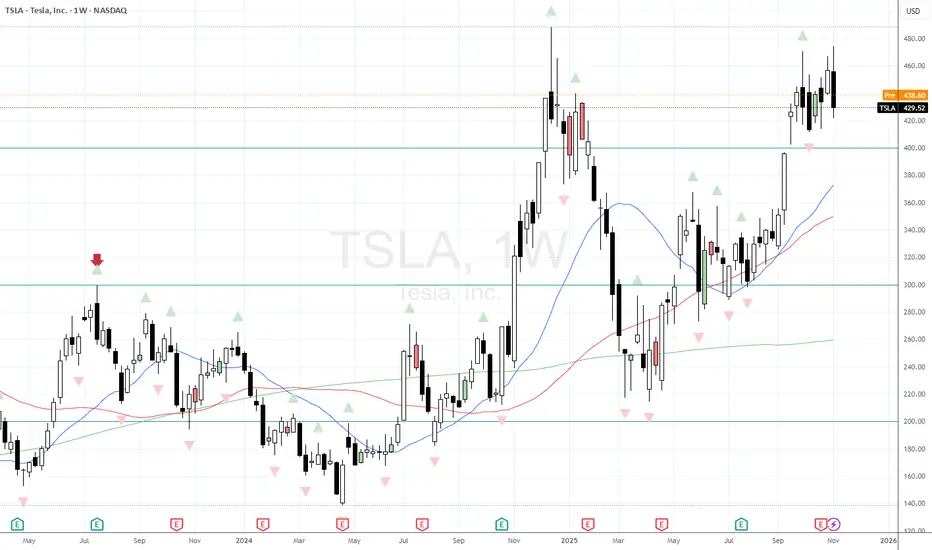
Tesla prints a weekly Key Reversal as part of a triple topTesla has been a volatile stock this year - and difficult to trade because of that.
However I now see that we've printed a weekly bearish key reversal as part of a double/ triple top. Is this now indication that we're likely to flow lower in the immediate future?
Well I am expecting some giddiness if they manage to end the US Gov't Shutdown, so it may help push prices higher for a day or two...and then the trend re-exerts itself?
Bearish in the short term after the relief rally bump.
TSLA Pitchfork Breach | Neutral RSI, Weak VolumeFollow GoldenZoneFX for more content and valuable insights about financial markets.

THE WEEK AHEAD FOR MARKETS (11.9.2025)In this video going over my watchlist of individual stock names
Also forgot to mention in addition to buying Shopify this week, I may be looking at small buys for AMD & potentially NVDA in the coming weeks ahead

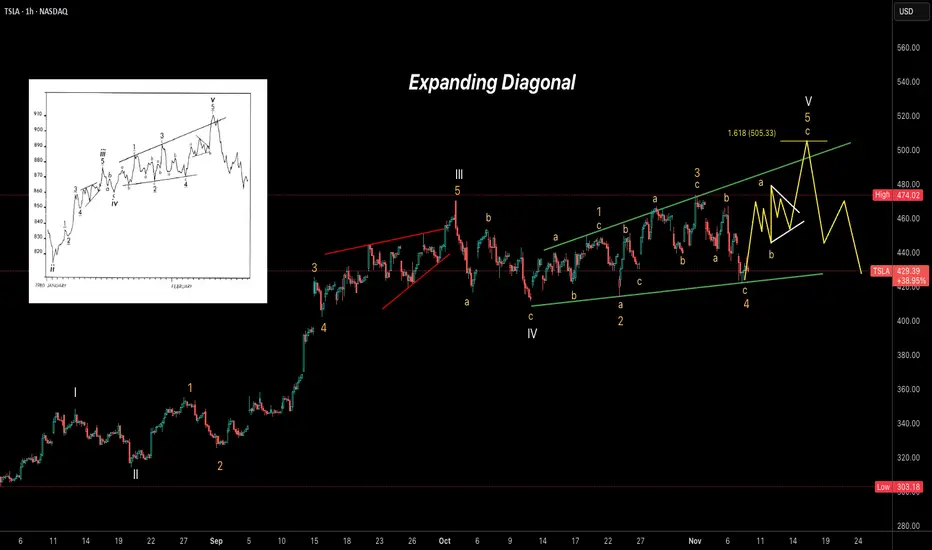
TSLA – Expanding Diagonal in Progress Tesla (TSLA) appears to be forming an Expanding Ending Diagonal pattern on the 1-hour chart, suggesting the final stages of a larger impulsive structure. Wave (V) seems to be unfolding with internal subdivisions visible, possibly targeting the 1.618 Fibonacci extension near 505 before a sharp reversal.
Key observations:
Structure resembles a textbook expanding diagonal (5-3-5-3-5).
Wave 4 found support near the lower trendline.
Wave 5 projection aims toward the 500–505 area.
Expecting a potential pullback or reversal once the diagonal completes.
Tesla - Stay patient and don’t rush in 🔮 Tesla (TSLA) – Long-Term Weekly Outlook
Based on the weekly timeframe, Tesla has completed its historical bullish cycle, topping out at $488.54, and has since entered a major corrective phase that has lasted for nearly two years.
This structural correction now appears to be in its final stages, as the price consolidates within what looks like a clear institutional accumulation zone.
---
⚙️ Key Technical Zones
The 2020 Point of Control (POC) around $219.42 represents the core price level that supported Tesla’s previous major rally.
The long-term ascending trendline passes right through this area, reinforcing it as a major structural support.
Just below lies the $183–$185 region, which marks a powerful confluence zone of:
Fibonacci 0.786 retracement,
a historical VWAP level near $183.60, and
the beginning of a strong volume node on the profile.
> This region is what institutions often refer to as the “final accumulation zone” — where large investors quietly rebuild positions before the next expansion phase begins.
---
📉 Expected Scenario Before the Next Rally
During the first quarter of 2026, Tesla is expected to experience one last corrective leg, gradually pulling back toward the $185 level, which aligns perfectly with the 0.786 Fibonacci retracement.
This move will likely act as a liquidity sweep — shaking out late buyers and triggering stop-losses — before institutions start accumulating heavily again.
---
💰 Smart Buying Zone
Optimal entry range: $183 – $190
Entry confirmation: A strong bullish weekly candle with rising volume emerging from the support zone
Protective stop: Weekly close below $170
Projected upside targets:
1. $295
2. $340
3. $396
4. $475
5. $520
These represent the key stages of Tesla’s expected bullish recovery cycle for 2026–2027.
---
🧠 Institutional Perspective
Large funds (“the whales”) are patiently waiting for this final phase of the correction to rebuild their long-term positions at discounted prices.
Between March and May 2026, the accumulation process is expected to complete, marking the beginning of Tesla’s next major bull cycle.
---
✅ Summary
The final downside scenario projects a move to around $185,
right at the 0.786 Fibonacci level — the last golden buying zone before the next historical rally begins.
⏳ Recommendation:
> Stay patient and don’t rush in — the real buying opportunity will come with the whales 🐳
in the $183–$185 zone, where smart money quietly re-enters the market.

$TSLA: in a trading rangeNASDAQ:TSLA seems to be in a trading range to complete wave (4) of 3, and wave 4. Buying at the range low ($420-$430) and selling $450, $460 call options is my TSLA strategy for now for short term shares. I also have uncovered long term shares.

TSLA 3-Drive & ABCD Pattern – Path to $500 Before a PullbackThis chart highlights multiple harmonic and Elliott structures aligning for a potential bullish extension in Tesla (TSLA). A well-defined ABCD pattern and 3-Drive pattern suggest momentum building toward the $500 zone, supported by Fibonacci projections and channel resistance.
The current wave structure points to an imminent 5-wave advance, likely completing the “Drive 3” and pattern D confluence area near $500–505. Following that move, a corrective pullback (ABC) is anticipated, possibly retesting prior support near $440–400.
Key elements featured:
ABCD completion zone: around $500
3-Drive pattern: confirming exhaustion at upper trendline
Elliott 5-wave projection: short-term bullish continuation
Possible corrective phase: after the final wave up
📈 Watching for confirmation of Wave iii and potential exhaustion signals near $500 before considering downside setups.

1 trillion dollar pay package to elon muskTesla shareholders agreed to pay Elon Musk a package of 1 trillion dollars, and that's 12% of total gains if he reached his promised goal to shareholders of making Tesla the most valuable company in the world, and it stays that way for 5 years. If Musk delivers, the stock price should jump to 1000 dollars price per share in 5 years.
PS: If Musk misses the target but a few thousand dollars, he gets nothing. Hence, the current most valuable company is now Nvidia with a 5 billion dollar evaluation, and Tesla is currently worth 1.35 trillion.
TSLA SELL++++ $360-370 to be testedAs I posted last week, and, clearly too early TSLA needs to test the $370 range where it broke out from. I do pat myself on the back for the epic bounce off support at $324.80 that needed to hold to see $426's and TSLA always goes further then we think both ways. We're way overdone and todays reversal shows it. $370's imminent in coming weeks

$TSLA Update NASDAQ:TSLA has a solid finish today during the market stress test.
Please watch the recording for levels and price targets.
Cheers.

Tesla BuyTesla has reclaimed the breakdown zone after a liquidity hunt, showing early bullish momentum. Price is pushing back into the previous range, offering a clean long setup with tight risk below the recent rejection zone. Upside targets align with the unfilled imbalance and overhead liquidity.
entering @415.3 keeping target as 445 trailing
NASDAQ:TSLA

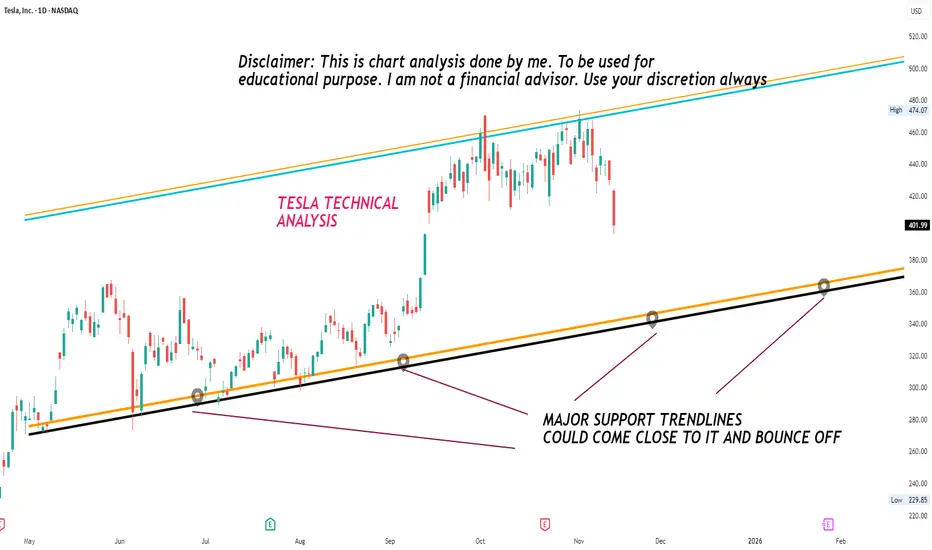
My technical analysis on TESLA based on the daily ChartShowing on chart major support trend line from where it can bounce off based on
TSLA Slips Despite Record Q3 Deliveries AI Growth Play?TSLA – Financial Performance & SWOT Analysis
TSLA Slips Despite Record Q3 Deliveries AI Growth Play?
(1/9)
Good Morning, folks! TSLA is pulling back 📉, at $ 436.33 up 7.85% YTD per October 10, 2025. AI integration shakes up this EV play , let’s dive in! 📊🔥 Tag a friend who needs this investing hack!
(2/9) – PRICE PERFORMANCE
• Last day: $ 436.33, down slightly pre-market 📉
• YTD 2025: up 7.85%, lagging S&P 500 🔄
• Q3 2025: record deliveries, but stock dips 🚀
This EV stock’s volatility, AI hype pops! 💥
(3/9) – MARKET POSITION
• Market Cap: $ 1.45T, industry giant 🏆
• Avg Volume: 88.96M shares, high liquidity 💧
• Trend: high P/E amid growth expectations 👑
This asset’s dominance, holding tight! 🔒
(4/9) – KEY DEVELOPMENTS
• Q3 deliveries: record highs, beat estimates 💰
• Stock dip: despite beats, tax credits end 🏭
• AI focus: Robotaxi event Oct 22, autonomy push 📈
This EV move, AI-driven surge! ⚡
(5/9) – RISKS IN FOCUS
• High volatility: beta 2.09 swings ⚠️
• Subsidies end: EV tax credit phaseout 🆚
• Market liquidations: $700M crypto-wide impact 📉
This ticker’s exposure, watch these twists! ⚠️🔄
(6/9) – SWOT: STRENGTHS
• EV leadership (deliveries.): market share 🌟
• AI integration (FSD/Robotaxi.): growth edge 🤖
• Institutional demand (ETFs.): sentiment boost 👥
This asset’s edge, built tough! 💪
(7/9) – SWOT: WEAKNESSES & OPPORTUNITIES
• Weaknesses: high valuation, subsidy reliance ⚖️
• Opportunities: AI boom, EV rebound 🌍
Can this ticker beat the odds? 🎲 Reply with your take!
(8/9) – POLL TIME!
TSLA’s $ 436.33 value, your vibe?
• Bullish: $500+ soon, AI beats 📈🚀
• Neutral: Steady, risks balanced ⚖️🛡️
• Bearish: $400 looms, subsidy hits 📉⚠️
Chime in below! 💬 Tag a friend for this poll!
(9/9) – FINAL TAKEAWAY
TSLA’s $ 436.33 position shows resilience 💪, AI fuels it ⚡. Risks bite 🦈, yet dips are DCA gold 💎. We grab ‘em low, climb like pros! Gem or bust? not advice, just our spin!
#TSLA #Investing #Markets #Trading #Finance #ETF #Commodities #DCA #Trends
TSLA is mixed as of October 10, 2025, at $ 436.33, up 7.85% YTD per TradingView. Q3 deliveries shape its path in the EV space. Here’s a factual financial and strategic breakdown.
**Financial Performance**
Price Movement: YTD at $ 436.33, up 7.85%. Broader period shows pullback from highs. Q3 adds upside, with record deliveries.
Volume & Market Cap: Avg volume 88.96M shares. Market cap at $ 1.45T.
Key Metric: Trailing P/E 256.20, forward P/E 172.41.
**SWOT Analysis**
Strengths:
- Record Q3 deliveries.
- AI and autonomy integration.
- Institutional interest.
Weaknesses:
- High valuation multiples.
- Subsidy phaseout impact.
- Recent stock pullback.
Opportunities:
- AI and Robotaxi growth.
- EV market rebound.
- New model launches.
Threats:
- Intense competition.
- Market corrections.
- Regulatory changes.
**TSLA vs. SPY: Key Comparisons**
| Aspect | TSLA | SPY |
|--------|------|-----|
| Purpose & Scope | EV and AI focus | Broad market index tracking |
| Dynamics | Beta 2.09 volatility vs. lower 1.00 | Steady benchmark |
| Market Position | Up 7.85% YTD, high P/E vs. S&P gains | Stable exposure |
**Investor Considerations: DCA**
Dollar Cost Averaging: TSLA’s volatility suits dip-buying. At $ 436.33, $10,000 buys ~23 shares; a 10% dip to $ 393 nets ~25 shares. Time in the market, not timing it, wins.
**Outlook & Risks**
TSLA’s $ 436.33 position shows AI edge, with delivery beats. Subsidy ends loom, yet dip grabs turn volatility into gains. AI or EV growth could sway it, but time’s our edge. Gem or fade? Depends on autonomy adoption.

TSLA: risky pullback, but potential long view planTSLA:
.
Risky pullback, but potential long view plan.
Just a shakeout as plan.
Wait n buy the dip!
.
US STOCKS- WALL STREET DREAM- LET'S THE MARKET SPEAK!

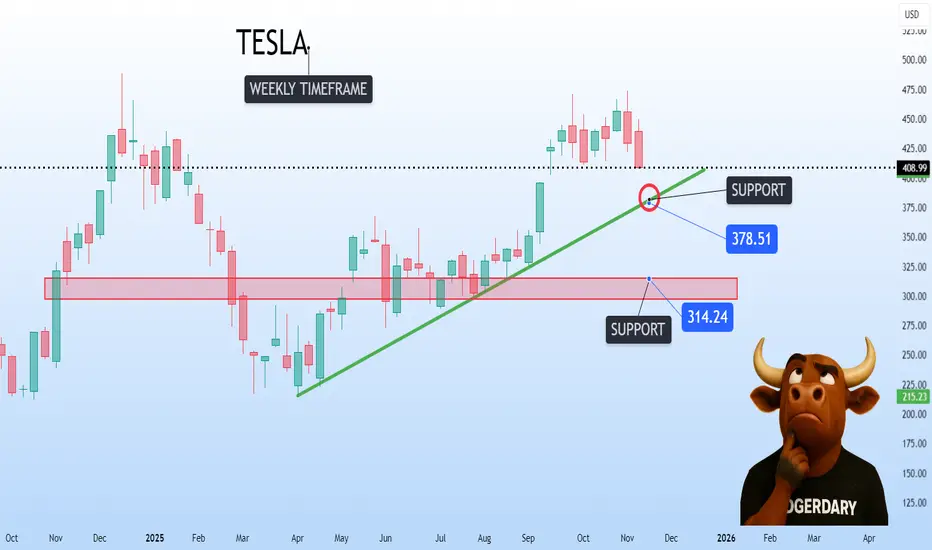
$TSLA could be pulling back right into 𝘀𝘂𝗽𝗽𝗼𝗿𝘁 NASDAQ:TSLA could be pulling back right into a major 𝘀𝘂𝗽𝗽𝗼𝗿𝘁 𝘇𝗼𝗻𝗲 𝗼𝗻 𝘁𝗵𝗲 𝘄𝗲𝗲𝗸𝗹𝘆 𝗰𝗵𝗮𝗿𝘁 𝗮𝗿𝗼𝘂𝗻𝗱 $𝟯𝟴𝟬.
This is the kind of retest that often decides the next chapter. Hold this level, and the structure stays intact with room to rebuild momentum. 𝗟𝗼𝘀𝗲 𝗶𝘁, 𝗮𝗻𝗱 𝘁𝗵𝗲 𝗱𝗼𝗼𝗿 𝗼𝗽𝗲𝗻𝘀 𝘁𝗼𝘄𝗮𝗿𝗱 𝘁𝗵𝗲 𝗹𝗼𝘄𝗲𝗿 𝘀𝘂𝗽𝗽𝗼𝗿𝘁 𝗻𝗲𝗮𝗿 𝟯𝟭𝟱.
tesla is bulish ...Two bullish scenarios are conceivable for Tesla: 1. A return to the broken level and a price pump 2. A move upwards without a return due to the intense buying pressure resulting from hitting the strong demand level.
lets see ....

TSLA: WaverVanir Edge – $TSLA Daily Outlook⚡ WaverVanir Edge – NASDAQ:TSLA Daily Outlook
NASDAQ:TSLA rejected from the 0.382 Fib ($466.9) and is hovering near $445, showing short-term weakness after an extended rally.
Auto-Fib map reveals liquidity clusters:
🟢 Premium Zones: $484 → $501 → $525 (target expansion levels)
🔴 Discount Zone: $411.6 major support
⚖️ Current equilibrium around $445 — consolidation before directional break.
WaverVanir DSS: Bearish divergence (−14% 30-day projection)
Institutional Model: Bullish rebound (+9% target → $485.6)
Edge Consensus: ⚠️ Range compression — volatility pocket between $411 and $466.
🌍 Macro & Catalysts
⚙️ FSD/AI expansion and Energy storage growth remain medium-term bullish
💰 Margins still under pressure amid price cuts & China competition
🏦 Fed tone mildly dovish → liquidity supportive, but yield volatility persists
🔋 Watch raw material cost trends (lithium, nickel) into Q1-2026
Base Path (WaverVanir Scenario):
Pullback → $420–$411 → re-accumulation → breakout >$466 to retest $484
“When volatility converges, conviction breaks. Patience over bias.”
#TSLA #WaverVanir #VolanXDSS #Fibonacci #SmartMoneyConcepts #AITrading #Macro #ElonMusk #StockMarket #RiskOn

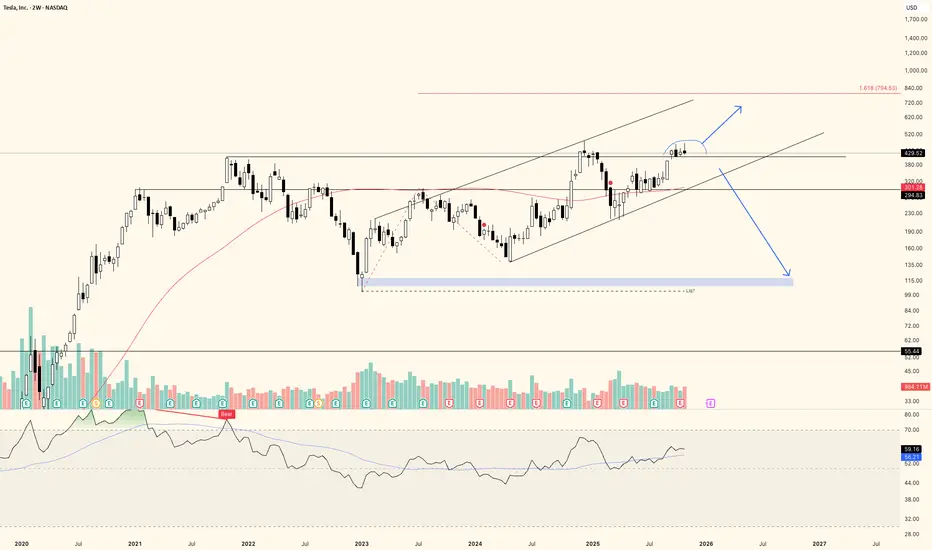
TSLA is giving mixed signals. Range low next move?I must say I have a very dualistic view on TSLA here. I think there is certainly a possibility of this becoming a prolonged consolidation with another move towards the downside of the range. On the other hand, that 1.618 extension to the upside als looks like a very valid target. Needless to say, while most people seem to stare blindly at TESLA great promises, I'm a little more skeptical to say the lest.
- Earnings have been going down over the years
- Revenue has stayed somewhat flat, with high odds of continuing to decline in China
- First their cars were going to change the world, then it was their energy solutions, then FSD became the narrative (Once done, FSD would instantly scale to worldwide usage and work everywhere, but currently their taxi service that would expand rapidly is geofenced), now Optimus is the narrative.
Elon is holding a carrot
- My point is: Elon is holding a carrot in front of us. I'm not saying Tesla is not doing great things. Their progress on FSD is real. But unless they will actually start to deliver real revenue and real profit, it will continue to be hyped up promises.
- For example, the EPS of XETR:VOW is 13x higher than Tesla's. Current Price to Earnings ratio for Tesla is at 300x.
So is it that weird to find that TA is giving mixed signals and possibly pointing towards range low?
Simple outlook
Anyway, this is my plan:
- I'll assume we are going up for 1.618 UNLESS
- We deviate back below previous ATH level. Then I think odds are starting to shift in favor of a bigger downward move.