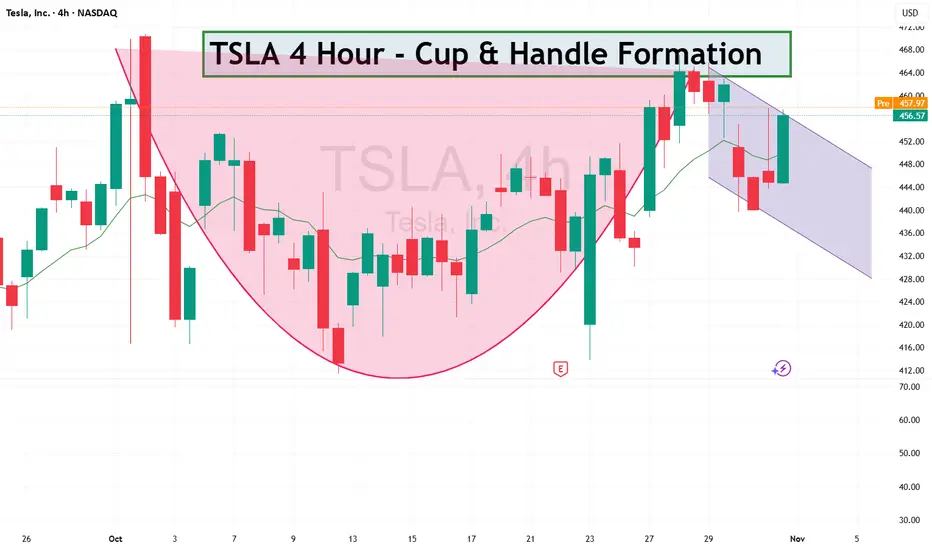
TALS - Cup and Handle FormationTSLA looks quite bullish, as you can see cup and handle formtion on 4 hour.
#TSLA #Tesla #Stocks #Trading #StockMarket #TechnicalAnalysis
Trade ideas
TSLA Is Building Momentum Toward New HighsTesla continues to show strong momentum, with higher lows forming across recent sessions. The trend structure remains constructive, and momentum indicators are pointing toward a possible extension toward new highs in the coming week i.e. $500+
According to my Trade Navigator model — a data-driven system that tracks breakout momentum and overall market strength; the readings remain elevated, suggesting that bulls still have room to run.
A sustained close above recent resistance could confirm the next leg higher.
(Educational content only — not financial advice.)
#TSLA #stocks #TradeNavigator #Momentum
Tesla Share Price at Key Technical LevelTesla’s share price has returned to a well-established upward trendline. The key question now is: will this trendline act as support and trigger a bounce, or will it be breached, attracting further selling pressure and pushing the price lower?
We’d love to hear your thoughts — will the bulls defend this level, or are the bears gaining ground?
TESLA COULD BREAK $500 IMMINENTLYIn this video, we look at the current setup on Tesla and I give my reasoning on why we are bullish

TSLA QuantSignals V3 Swing 2025-11-01TSLA QuantSignals V3 Swing 2025-11-01
TSLA Swing Signal | 2025-11-01
• Direction: BUY CALLS | Confidence: 55%
• Horizon: 20 days to 2025-11-21
• Strike Focus: $425.00
• Entry Range: $43.52
• Target 1: $65.28
• Stop Loss: $32.48
• 1W Move: -0.44%
• 2W Move: +0.11%
• Volume vs Prior Swing: 0.8×
• Swing Range: $439.61 - $467.00
• 🔴 HIGH RISK WARNING: Use only small position size due to lower confidence and high uncertainty.
⚖️ Compliance: Educational swing commentary for QS Premium. Not financial advice.
🎯 TRADE RECOMMENDATION
Direction: BUY CALLS
Confidence: 55%
Conviction Level: LOW
🧠 ANALYSIS SUMMARY
Katy AI Signal: NEUTRAL with bearish bias (target $452.89, stop $462.94) - but institutional guidance shows BUY CALLS primary bias (+1.8 composite score)
Technical Analysis: Strong bullish gap (+0.11%), price in upper swing zone (60.2%), all EMAs aligned bullish, but MACD bearish and trend strength WEAK
News Sentiment: Mixed with high-impact Tesla stories - Michael Dell/Cathie Wood supporting Musk's pay package is bullish, but political/regulatory uncertainty creates headwinds
Options Flow: Extremely bearish Put/Call Ratio (10.99) suggests institutional pessimism, max pain at $455.00 below current price
Risk Level: HIGH - conflicting signals between directional guidance and options flow, weak momentum despite recent 5.40% gain
💰 TRADE SETUP
Expiry Date: 2025-11-21 (20 days)
Recommended Strike: $425.00
Entry Price: $43.40 - $43.65
Target 1: $65.28 (50% gain from entry)
Target 2: $86.95 (100% gain from entry)
Stop Loss: $32.48 (25% loss from entry)
Position Size: 2% of portfolio (low conviction requires reduced exposure)
⚡ COMPETITIVE EDGE
Why This Trade: Multi-timeframe STRONG_BULLISH alignment vs single-day noise creates swing opportunity
Timing Advantage: 20-day expiry provides buffer for weak momentum to strengthen, gap support at $433.22
*
Image
QS Analyst
APP
— Yesterday at 8:56 PM
*Risk Mitigation: Balanced delta (0.725) provides optimal risk/reward, stop protects against Katy's bearish $462.94 resistance
🚨 IMPORTANT NOTES
⚠️ CRITICAL CONFLICT**: Options flow shows extreme bearish positioning (P/C ratio 10.99) contradicting directional guidance
⚠️ Katy AI actually signals NEUTRAL with bearish bias - trade goes against primary AI engine recommendation
⚠️ Weak bullish signal (score: 0.8) requires cautious position sizing and tight risk management
⚠️ Monitor $455.00 max pain level as potential resistance zone
📊 TRADE DETAILS 📊
🎯 Instrument: TSLA
🔀 Direction: BUY 📈
🎯 Strike: 425.00
💵 Entry Price: 43.52
🎯 Profit Target: 65.28
🛑 Stop Loss: 32.48
📅 Expiry: 2025-11-21
📏 Size: 2.0
📈 Confidence: 55%
⏰ Entry Timing: N/A
🕒 Signal Time: 2025-11-01 23:56:15 EDT
🔴 HIGH RISK WARNING: Use only small position size due to lower confidence and high uncertainty.

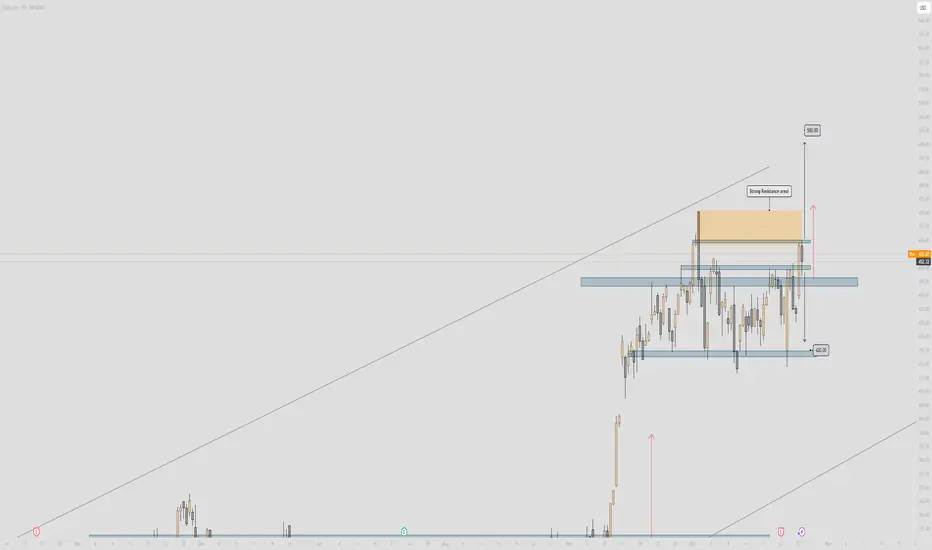
Is Tesla Setting Up for a Rebound? Key Entry Levels Inside🎯 TSLA: The "Thief Strategy" Playbook | Swing/Day Trade Setup 📈
🔥 Quick Overview
Asset: Tesla, Inc. (TSLA)
Bias: 🐂 BULLISH
Strategy Type: Thief Layering Entry Method
Risk Level: Medium-High (Swing/Day Trade)
💰 The "Thief" Entry Strategy Explained
The "Thief Strategy" uses multiple limit orders (layering method) to accumulate position at different price levels. Think of it like setting traps at various floors of a building—you catch opportunities wherever price decides to visit! 🎣
📊 Entry Zones (Layer Your Orders):
Layer 1: $430.00
Layer 2: $435.00
Layer 3: $440.00
💡 You can add more layers based on your own risk appetite and account size. The beauty of layering? You average your entry and reduce timing risk!
🛡️ Stop Loss (SL):
Thief SL: $415.00
⚠️ Important Note: This is MY stop loss level based on the Thief Strategy framework. You're the captain of your own ship! 🚢 Adjust your SL based on YOUR risk tolerance and account management rules. Trade at your own risk—make money, take money, manage wisely!
🎯 Target (TP):
Primary Target: $490.00
🚨 Why $490? This zone represents a confluence of:
Strong resistance area
Potential overbought conditions
Historical trap zone where bulls get exhausted
📢 Thief OG's Reminder: I'm NOT saying you MUST take profit only at my TP level. If you see profits that make you smile, SECURE THEM! 💵 The market gives, and the market takes. Be greedy when you can, be smart always.
🔍 Technical Analysis Breakdown
Tesla is showing bullish momentum structure with potential for continuation toward the $490 resistance zone. The layering strategy allows us to build position as price potentially dips into demand zones before the next leg up.
Key Technical Levels:
Support Zone: $430-$440 (Our entry layers)
Invalidation: Below $415 (Stop loss)
Resistance Target: $490
📌 Related Pairs to Watch (Correlation Play)
Understanding correlated assets helps confirm your thesis:
AMEX:SPY (S&P 500 ETF)
TSLA often moves with broader market sentiment
Watch SPY for overall risk-on/risk-off environment
NASDAQ:QQQ (Nasdaq 100 ETF)
Tech-heavy index where TSLA is a major component
Strong correlation with TSLA price action
NASDAQ:NVDA (NVIDIA)
Both are high-beta tech growth stocks
Often move together during risk appetite shifts
TVC:DXY (US Dollar Index)
Inverse correlation: Strong dollar = pressure on growth stocks like TSLA
Weak dollar = tailwind for equities
💡 Key Point: If SPY/QQQ are bullish + DXY weakening = Strong confirmation for TSLA upside!
⚡ Trading Tips for Thief OG's
Don't FOMO — Let price come to your layers
Manage position size — Each layer should be equal weight
Trail your stop — Once profitable, protect gains
Watch volume — Confirm breakouts with volume spikes
Stay flexible — Market conditions change; so should you!
🎬 Final Words
This setup is all about patience, precision, and profit extraction! 🎯 The Thief Strategy isn't about stealing from the market—it's about being SMART and setting yourself up for success with calculated entries.
Remember: The best trades are the ones where you're prepared, not scared! 😎
✨ If you find value in my analysis, a 👍 and 🚀 boost is much appreciated — it helps me share more setups with the community!
#TSLA #TeslaStock #SwingTrading #DayTrading #ThiefStrategy #LayeringStrategy #StockMarket #TradingIdeas #TechnicalAnalysis #BullishSetup #TradingStrategy #RiskManagement #StockTrading #MarketAnalysis #TradingCommunity

TSLA shorts may get toastedA rising trendline acting as strong dynamic support from the August lows.
Resistance zone near $470–475 (yellow line, recent double-top area).
Current price at $456, holding above trendline support.
Support floor near $290, far below current levels — indicating we’re in a mid-term uptrend phase, not deep correction.
This pattern fits a rising channel consolidation near resistance — the next move depends on whether the trendline holds.
📈 Bullish Scenario
Setup:
TSLA is holding the ascending trendline while consolidating just below resistance — a classic bullish continuation structure.
Confirmation Triggers:
Break and daily close above $470–475 (clear breakout).
Follow-through volume or a strong gap-up session confirming momentum.
Short-Term Targets:
$490–495 → initial breakout target (projected move from last swing).
$510–520 → extended target if buyers sustain momentum.
Catalysts:
Broader tech strength (QQQ, NASDAQ rally).
Positive EV demand data or production updates.
Institutional accumulation at the breakout level.
Invalidation:
Break and close below $445, violating trendline support.
Probability: ~60% (uptrend intact, momentum favors bulls).
📉 Bearish Scenario
Setup:
If TSLA fails to break $470 again and loses the $445 trendline, momentum could unwind toward prior support.
Confirmation Triggers:
Close below $445 with increased volume.
Failed retest near $450–455 forming lower high.
Short-Term Targets:
$420–425 → first support zone from early October.
$390–400 → deeper correction toward base of last breakout.
Catalysts:
Weak market sentiment or NASDAQ pullback.
Negative headlines on delivery numbers or margins.
Broader EV sector weakness.
Invalidation:
Breakout above $475 with strong follow-through.
Probability: ~40% (depends on strength of support at $445).
⚖️ Neutral / Sideways
If TSLA oscillates between $445–475, expect continued range consolidation along the trendline — typically preceding a directional breakout in 1–2 weeks.
🧩 Summary Table
Bias Confirmation Target Zone Invalidation Notes
Bullish Close > $475 $490 → $520 < $445 Continuation of uptrend
Bearish Close < $445 $425 → $400 > $475 Trendline break
Neutral Range $445–475 — — Coiling near apex
🕒 2–3 Week Projection
Bullish path: Hold $450–455 → breakout above $475 → reach $495–500 by mid-Nov.
Bearish path: Reject $470 → break below $445 → pull back to $420 by late Nov.

Tesla Stock: Poised for a MASSIVE CRASH? Buckle Up!🚀 Tesla Stock: Poised for a MASSIVE CRASH? Buckle Up! 📉
🔥 Explosive Technical Breakdown!
On the 4-hour timeframe, Tesla is teetering on the edge! A break below $411.42 screams a BEARISH SETUP! 🚨 But hold up – this only kicks in if the price fails to BLAST through $454.43 resistance.
💥 Bigger Picture? It’s BRUTAL! Tesla just SMASHED a critical support level, paving the way for a VICIOUS DOWNtrend! Bears are circling, and the stage is set for a MELTDOWN! 😈
Will Tesla CRUMBLE or pull a last-second escape? Who’s next to get WRECKED?
🚀 Analysis + LIGHTNING-FAST Signals? Follow NOW! ✅
📊 Want a GOLD Decision-Making Chart? Smash LIKE! ✅
💬 Got Thoughts? Comment – Replying to the BEST! ✅

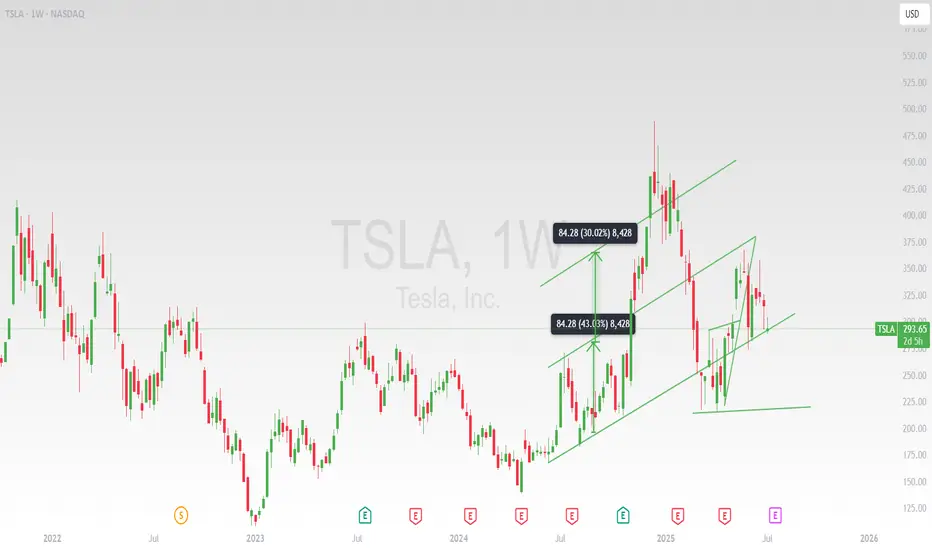
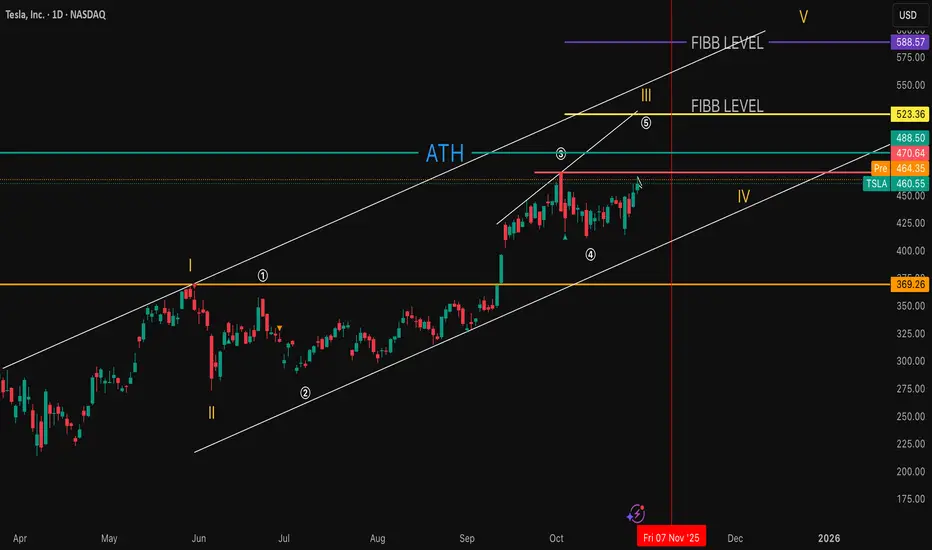
TSLA, consolidation below ATH often leads to a breakout..Tesla sentiment was very negative in April as Trump and Elon argued online causing a lot of whipsaw volatility and scaring out investors. The bottom quickly followed.
Price is ranging below all time high. Price is above the weekly pivot and 200EMA which is bullish and has momentum.
Wave © of C appears to be underway into price discovery with a target of $693 the R2 weekly pivot. This is because it has been printing a series of 3 wave structures. Wave B printed a triangle which is a pattern found before a terminal move reinforcing the Elliot wave count.
🎯 Terminal target for the business cycle could see prices as high as $690 based on weekly pivots
📈 Weekly RSI is just below oversold with no divergence and can remain here for months as price keeps increasing.
👉 Analysis is invalidated if we close back below wave (B), $280

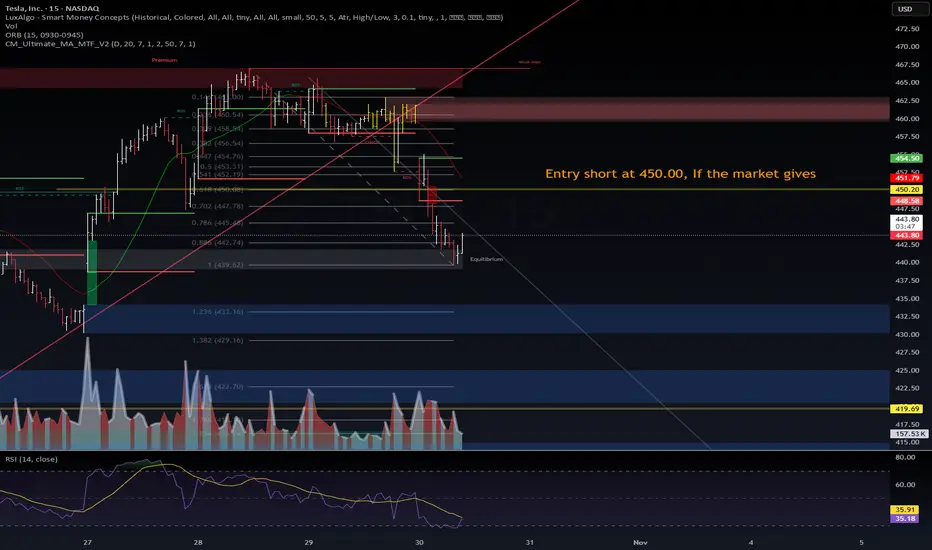
$TSLA | Short Setup Loading — 450 is the Line in the Sand⚙️ NASDAQ:TSLA | Short Setup Loading — 450 is the Line in the Sand
Tesla continues its controlled descent after rejecting the weak high at 465–470.
Price retraced into the 0.786 Fib (≈ 445) zone, finding short-term equilibrium before the next leg.
📊 VolanX DSS Technical Outlook (15m):
Structure confirms bearish displacement with multiple CHoCH breaks.
Retrace zone: 447 → 450 = ideal short re-entry if market allows.
Target zones: 433 → 420 → 419.69 (liquidity shelf).
RSI = 35 → momentum favors continuation; no confirmed divergence yet.
Volume dropping into equilibrium = possible redistribution phase.
🎯 Trade Plan:
Entry short @ 450.00 if market gives.
Maintain stop above 452; scale out near 433–420.
VolanX Liquidity-Reversal-Guard (LRG) stays inactive until RSI divergence appears.
Macro Context (Oct 30 2025):
Fed tone = hawkish → yield = 4.10 %.
Risk assets fading post-earnings; AI and EV names seeing capital rotation.
NASDAQ:TSLA tracking NASDAQ:QQQ correlation ≈ 0.83 → expect synchronized intraday volatility.
VolanX DSS Bias:
🟥 Bear 60 % 🟨 Neutral 25 % 🟩 Bull 15 %
“450 is the battlefield — equilibrium decides who walks away.”
#TSLA #WaverVanir #VolanX #SmartMoney #Liquidity #Macro #Fed #AITrading #SPY #QQQ #Tesla #ShortSetup
Tesla Wave Analysis – 30 October 2025
- Tesla reversed from the key resistance level 467.30
- Likely to fall to support level 415.60
Tesla recently reversed from the resistance area between the key resistance level 467.30 (which stopped the previous impulse wave I at the start of October) and the resistance trendline of the daily up channel from April.
The downward reversal from this resistance level 467.30 is likely to for the daily Japanese candlesticks reversal pattern Evening Star Doji – strong sell signal for Tesla.
Given the strength of the resistance level 467.30 and the overbought daily Stochastic, Tesla can be expected to fall toward the next support level 415.60 (low of waves ii, c and a).

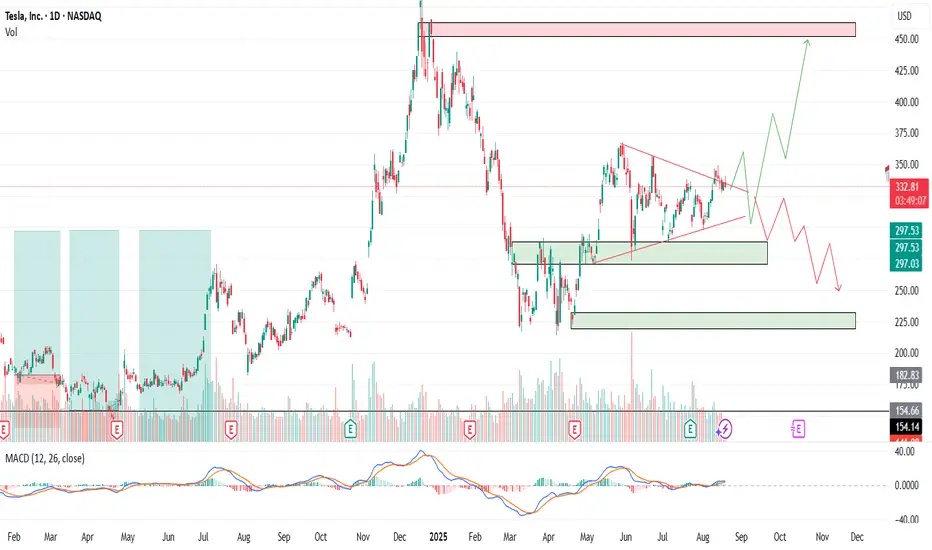
TSLA – Buy the Fear or Wait for the Setup?Tesla (TSLA) is once again in the spotlight. Between robo-taxi hype, new product launches, and ongoing political noise around Elon Musk, the stock has become one of the hottest trading stories on the market. But as always the chart tells us where to act.
Entry Levels
$330 – First line of defense, early buyers may step in here
$295 – Stronger support, better reward-to-risk zone
$255 – Deep pullback level, only triggered on market weakness
🎯 Profit Targets
TP1: ~$345 → ~5% move from $330 entry
TP2: ~$370–$380 → 12–15% move depending on entry
TP3: ~$400–$420 → 18–20% move on a sustained breakout
Tesla remains a trader’s stock: volatile, narrative-driven, and technically reactive. If it holds the $330 zone, momentum traders could see a quick bounce. If we dip to $295 or even $255, that could be the bigger opportunity for those with patience.
No one knows which path the market chooses, but the plan is set. Trade the structure, not the noise.
⚠️ Disclaimer: This is not financial advice. I’m sharing my personal analysis and trade levels. Always do your own research and manage risk responsibly.
TSLA Bullish Breakout? Flag Resolution Toward 525–530Hello, traders. TSLA’s 1D chart has been trending higher since the early-September breakout, then cooling into a neat bull flag. Price is holding above the MA20, MA60, and MA120, with the MA20 around ~$440 acting as first dynamic support. Volume expanded on the run-up and faded during the flag—classic continuation behavior—while volatility has eased but remains elevated.
The key battleground is the resistance at $481, the early-October peak and upper boundary of the flag. A daily close above $482 would confirm the breakout and put the psychological $500 on the table, with extension toward the $525–$530 supply zone if momentum and volume expand. If buyers don’t force the break immediately, a dip toward the $430–$440 area (near MA20) is a constructive retest zone before another attempt at the highs.
The idea fails on a decisive daily close below $415. That would break the flag support, flip the short-term structure, and expose downside toward the MA60 region near $390. Until then, the primary path favors continuation: breakout entries on a daily close >$482, with partial profits near $500 and runners into $525–$530; conservative stops live below $415–$417 depending on tolerance.
This is a study, not financial advice. Manage risk and invalidations.

TSLA | Smart Money FlowNASDAQ:TSLA | Smart Money Flow
Tesla’s building pressure right at the distribution zone (460–470) liquidity’s loading up top.
Below sits a clean accumulation block (400–430) stacked with FVGs waiting to get tapped.
A quick sweep → bounce from that zone could send it straight toward $500+.
Structure still clean, bulls still in control.

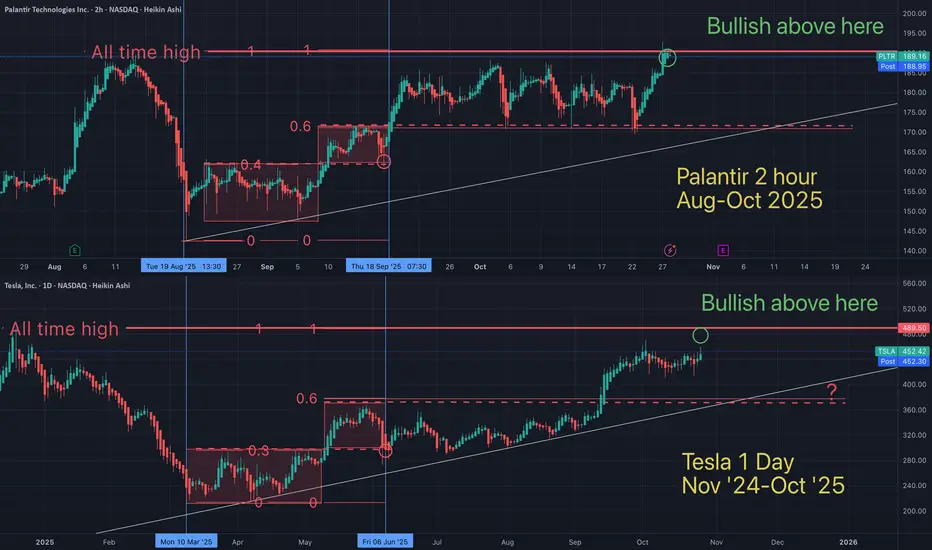
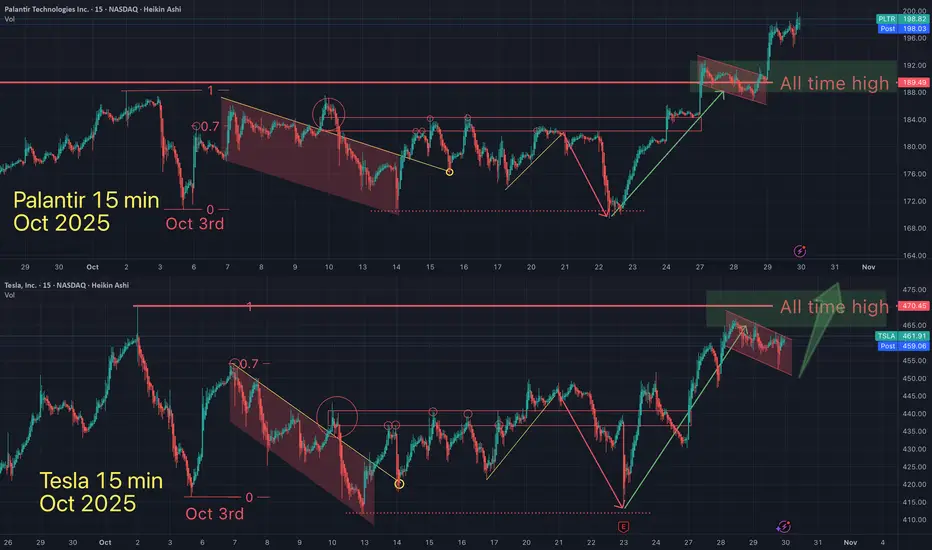
You will ask yourself, "how did he know Palantir would do that"?On Oct 7th I suggested that Palantir & Tesla were in a very bullish long term pattern and were both about to *soon break out into new all time highs (ATH). Palantir just did...is Tesla next?
Blow off top next?
May the trends be with you.
Tesla Consolidates Before Next Bullish BreakoutTesla Consolidates Before Next Bullish Breakout — Eyes on $550, $600, and $650 Targets
Tesla’s price action has formed a series of bullish continuation patterns, each followed by strong upward moves. Currently, the stock is consolidating between $413 and $470, creating a potential accumulation zone before the next breakout.
The repeated triangle breakout patterns suggest a continuation of the bullish trend if Tesla manages to hold above the $413 support level.
Once price breaks above the $470 resistance, Tesla could accelerate toward the next targets at $550, $600, and $650, as indicated on the chart.
In the short term, some sideways movement within the current range is possible before the next strong impulse upward.
You may find more details in the chart!
Thank you and Good Luck!
❤️PS: Please support with a like or comment if you find this analysis useful for your trading day❤️

TSLA is going UP! .. time to buy!Tsla aka Tesla was stuck in-between 2 powerful support and resistance zones (the red and green lines) .. It finally broke to the upside and broke above the resistance level. It is now very likely to head to the next resistance zone which was the previous high (the next resistance zone has been drawn as the white line shown on the chart) - this is where we will be taking profit at. BUY NOW!

TSLA - Important!🔥 Tesla Analysis (Daily Structure) 🔥
Alright, let’s break this one down 👇
🧱 Structure Overview
Tesla’s price is currently hovering around $452, sitting right below a major resistance zone between $455 – $470 (highlighted in orange). This area has acted as a strong ceiling multiple times — every approach has been met with rejection pressure.
Below, the support floor sits clean around $420 – $425, which has been holding the range low for a while. We’re essentially trapped in a sideways consolidation box — a range between that $420 low and the $470 resistance cap.
🧭 Bias
Current structure = Neutral to Bearish
Price just wicked into resistance, showing signs of rejection. Unless we see strong follow-through above $470 with clean volume, this is likely a reaction zone for shorts.
💡 Key Zones
Resistance (Sell Zone): $455 – $470
Strong supply — expect sellers to defend this area.
Support (Buy Zone): $420 – $425
Range demand base — liquidity resting below.
🎯 Scenarios
Bearish Setup (Higher Probability for Now)
If Tesla fails to break and close above $470, look for a move back down to $420 — possibly a liquidity grab under the range. Confirmation would be bearish engulfing or a strong rejection candle from resistance.
Bullish Setup (Breakout Play)
If price cleanly closes above $470 and retests it as support, we could open the door toward $500 (measured move target). That’d be a breakout from the range and continuation of the larger bullish channel.
⚖️ Risk Management
Bears: Stop above $475 – $480
Bulls: Stop below $445 if entering after breakout retest
Keep R:R ≥ 1:2
🧠 Summary
Tesla’s in a tight range — smart money likely accumulating or distributing near these highs. Watch for rejection signs around $470 for short plays, or confirmation above it for the next leg to $500.
This is the make-or-break zone — the next move will define Tesla’s mid-term direction. ⚡️
The Impact of International Trade PolicyIntroduction
International trade policy plays a central role in shaping the global economic landscape. It encompasses the set of laws, agreements, and regulations that govern how countries trade goods, services, and capital across borders. The policies that a nation adopts determine its trade openness, competitiveness, and relationship with other economies. These decisions influence economic growth, employment, industrialization, innovation, and even geopolitical alliances. Over time, trade policy has evolved from protectionist models to liberalized frameworks, reflecting changing political ideologies and global economic realities.
The impact of international trade policies is profound. They influence prices, productivity, income distribution, and global supply chains. Whether it’s tariffs, quotas, free trade agreements, or export subsidies, every trade measure carries consequences for domestic industries and the international community. Understanding the implications of these policies helps policymakers strike a balance between protecting local interests and promoting global cooperation.
1. The Nature and Objectives of International Trade Policy
International trade policy refers to the set of strategies and regulations that guide a country’s transactions with other nations. The primary objectives of trade policy include:
Promoting Economic Growth:
Trade policies aim to enhance national income through exports and foreign investments. By opening markets, countries can leverage comparative advantages and increase efficiency.
Protecting Domestic Industries:
Some trade policies impose tariffs or quotas to shield local producers from foreign competition, particularly in emerging sectors.
Ensuring Balance of Payments Stability:
Trade regulations help maintain equilibrium between imports and exports, reducing dependence on foreign debt.
Encouraging Employment:
Strategic trade policies promote industries that create jobs and sustain livelihoods.
Advancing Geopolitical Goals:
Trade policies are also used to strengthen diplomatic ties or exert economic pressure, such as through sanctions or preferential trade agreements.
Fostering Innovation and Technology Transfer:
Open trade environments often accelerate the diffusion of technology and innovation across borders.
Ultimately, international trade policy reflects the economic philosophy of a nation—whether it leans toward protectionism or free trade liberalization.
2. Major Instruments of Trade Policy
Trade policy uses a range of instruments to regulate international transactions:
a. Tariffs
Tariffs are taxes imposed on imported goods. They raise import prices, protecting domestic industries from cheaper foreign products. However, high tariffs can provoke retaliation and reduce global trade efficiency.
b. Quotas
Quotas limit the quantity of goods that can be imported or exported. While they protect local industries, they often lead to inefficiencies and higher consumer prices.
c. Export Subsidies
Subsidies encourage domestic firms to export by lowering production costs. While this can boost competitiveness, it may distort market competition and lead to trade disputes.
d. Trade Agreements
Bilateral, regional, or multilateral agreements—such as NAFTA (now USMCA), the European Union, or ASEAN—facilitate freer movement of goods and services by reducing barriers.
e. Non-Tariff Barriers
These include product standards, licensing requirements, and customs procedures that indirectly restrict trade.
f. Exchange Rate Policies
A country’s currency valuation can influence trade competitiveness. A depreciated currency makes exports cheaper and imports costlier, affecting trade balances.
Each of these instruments has a specific impact on domestic markets and the global economy.
3. Historical Evolution of International Trade Policy
The history of trade policy reflects the global struggle between protectionism and liberalization.
Mercantilist Era (16th–18th Century):
Nations viewed wealth in terms of gold and silver reserves. They imposed high tariffs to maximize exports and minimize imports.
Free Trade Movement (19th Century):
The Industrial Revolution and the works of economists like Adam Smith and David Ricardo popularized the idea of comparative advantage, leading to lower tariffs and greater global trade.
Post–World War II Liberalization:
The establishment of the General Agreement on Tariffs and Trade (GATT) in 1947 marked a turning point toward multilateral trade liberalization.
World Trade Organization (WTO) Era (1995–Present):
The WTO institutionalized global trade rules and dispute resolution mechanisms, promoting freer and fairer international commerce.
Recent Protectionist Resurgence:
Events like Brexit, U.S.–China trade tensions, and supply chain disruptions have reignited debates over economic nationalism and trade protectionism.
This historical evolution shows that trade policy continuously adapts to changing political and economic dynamics.
4. Economic Impact of International Trade Policy
a. Impact on Economic Growth
Open trade policies generally promote higher growth. Countries like South Korea, Singapore, and Germany have leveraged export-led strategies to achieve rapid industrialization. By contrast, overly restrictive policies often hinder competitiveness and innovation.
b. Impact on Employment
Trade liberalization can both create and destroy jobs. While export industries grow and employ more workers, import-competing sectors may experience layoffs. Hence, labor retraining and social safety nets are crucial to manage transitions.
c. Impact on Prices and Inflation
Trade liberalization reduces the cost of imported goods, benefiting consumers with lower prices. Conversely, protectionist tariffs increase costs and contribute to inflationary pressures.
d. Impact on Industrial Development
Strategic trade policies can nurture infant industries by protecting them from international competition until they become globally competitive—a strategy used successfully by Japan and China.
e. Impact on Income Distribution
Trade liberalization often benefits skilled workers and capital owners, while unskilled labor may face downward pressure on wages. Thus, inequality may rise without inclusive policies.
5. Political and Social Implications
International trade policy is not merely economic—it is deeply political. Trade decisions influence national sovereignty, labor rights, and even cultural identity.
Political Influence:
Governments use trade policy as a diplomatic tool. Sanctions, embargoes, or preferential agreements can shift power balances in international relations.
Social Consequences:
Global trade can reshape social structures. While it creates wealth, it can also lead to job displacement and social unrest if benefits are unevenly distributed.
Environmental Impact:
Trade policies can either encourage sustainable practices through green standards or exacerbate environmental degradation through overexploitation of resources.
6. The Role of International Institutions
Institutions like the World Trade Organization (WTO), International Monetary Fund (IMF), and World Bank play critical roles in shaping and enforcing trade policy.
World Trade Organization (WTO):
The WTO ensures that trade flows as smoothly and fairly as possible by setting global rules and resolving disputes.
International Monetary Fund (IMF):
The IMF stabilizes exchange rates and provides financial assistance to countries facing balance-of-payments crises, indirectly supporting trade stability.
World Bank:
The World Bank supports trade-related infrastructure and development projects to integrate developing nations into the global economy.
These institutions provide a framework for cooperation, transparency, and accountability in global trade.
7. Regional Trade Agreements and Blocs
Regional integration has become a cornerstone of modern trade policy. Examples include:
European Union (EU):
A single market allowing free movement of goods, services, labor, and capital among member states.
North American Free Trade Agreement (NAFTA/USMCA):
Strengthens trade ties between the U.S., Canada, and Mexico by reducing tariffs and harmonizing regulations.
Association of Southeast Asian Nations (ASEAN):
Promotes economic cooperation and market integration in Southeast Asia.
African Continental Free Trade Area (AfCFTA):
Aims to create a unified market across Africa, enhancing intra-continental trade.
These agreements stimulate economic cooperation and regional stability while creating large integrated markets that attract foreign investment.
8. Trade Policy Challenges in the 21st Century
Modern trade policy faces several emerging challenges:
Protectionism and Trade Wars:
Rising nationalism has led to tariff battles, particularly between major economies like the U.S. and China.
Digital Trade and E-Commerce:
Policies must adapt to data flows, digital services, and cybersecurity concerns in global online commerce.
Supply Chain Disruptions:
Events like the COVID-19 pandemic exposed the vulnerabilities of global supply chains, prompting calls for “reshoring” or “friend-shoring.”
Climate Change and Green Trade Policies:
Nations are incorporating environmental standards into trade deals to encourage sustainable production and carbon reduction.
Inequality and Labor Standards:
Policymakers must address the social costs of globalization, ensuring fair wages and ethical labor practices.
Technological Advancements:
Automation, AI, and robotics influence trade competitiveness, requiring rethinking of industrial and education policies.
9. Impact on Developing Economies
For developing countries, trade policy can be a double-edged sword.
Positive Impacts:
Trade liberalization opens access to global markets, encourages investment, and fosters technology transfer. Nations like Vietnam and Bangladesh have used export-oriented strategies to lift millions out of poverty.
Negative Impacts:
Weak infrastructure, lack of competitiveness, and dependency on raw material exports make developing economies vulnerable to global shocks. Poorly designed liberalization can lead to deindustrialization and income inequality.
Therefore, balanced trade policies that combine openness with domestic capacity building are crucial for sustainable development.
10. The Future of International Trade Policy
Looking ahead, the future of trade policy will likely focus on sustainability, digitalization, and inclusivity. The next generation of trade agreements will emphasize:
Green Trade: Incentivizing low-carbon production and renewable energy trade.
Digital Economy Governance: Regulating data flows, privacy, and digital taxation.
Resilient Supply Chains: Diversifying trade partners and promoting regional production hubs.
Inclusive Growth: Ensuring that trade benefits reach small businesses, women, and underrepresented communities.
Geopolitical Cooperation: Strengthening trade diplomacy to mitigate conflicts and foster global stability.
The trade policy of the future will balance national security with economic efficiency and social welfare.
Conclusion
International trade policy is one of the most powerful tools in shaping global prosperity and stability. Its impacts span economic growth, employment, innovation, and geopolitical relations. While liberalization has fostered unprecedented global integration, it has also exposed vulnerabilities—inequality, environmental strain, and dependence on fragile supply chains.
The challenge for policymakers lies in designing trade frameworks that are fair, resilient, and sustainable. Balancing national interests with global cooperation remains the cornerstone of effective trade policy. In an increasingly interconnected world, the success of any nation’s trade policy depends not only on its domestic priorities but also on its capacity to collaborate, adapt, and lead within the global economic system.

TSLA – Key Resistance Retest AheadNASDAQ:TSLA stock price continues to show strong bullish momentum, recently breaking above short-term consolidation near the $440–$445 zone. The current move suggests buyers are regaining control after a period of sideways accumulation, with the next key resistance area sitting between $470–$490, where previous supply triggered multiple rejections.
If price can sustain above the $440–$445 demand zone, a breakout above $470 could confirm bullish continuation toward $520–$540, aligning with the next liquidity pool. This area could attract profit-taking or a short-term retracement before further upside extension.
However, if the price fails to clear the $470–$490 resistance and forms a rejection candle, sellers may attempt to push price back into the previous consolidation range. A clean break below $430 would invalidate the bullish structure, potentially exposing downside toward $400.

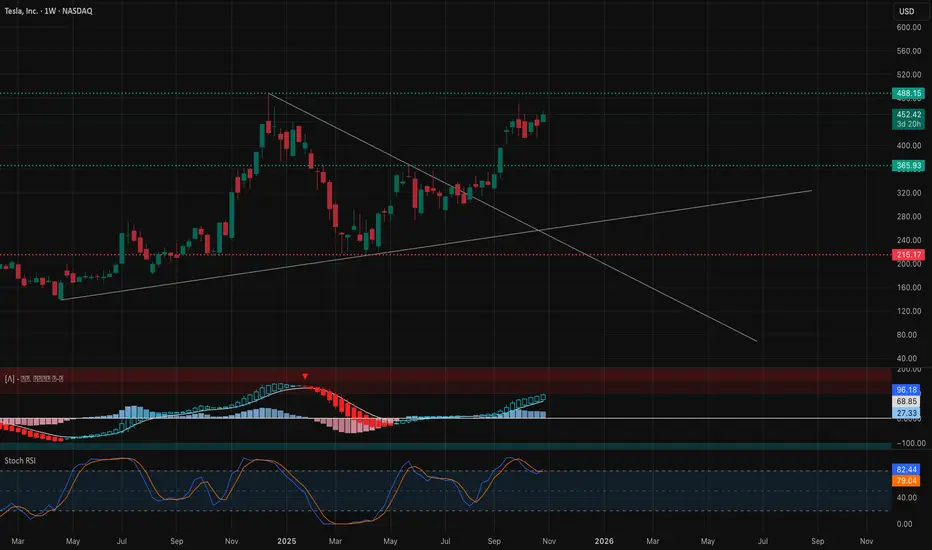
TSLA Weekly Outlook (Oct 28–31)TSLA Weekly Outlook (Oct 28–31): “Charging Toward 470 or Cooling at the Top?” ⚡
1. Weekly (1W) Structure – Big Picture
Tesla is in a strong bullish continuation phase, showing a clear Break of Structure (BOS) above $367 and holding momentum above $450. The downtrend line from the 2023 high was broken, confirming a long-term structural reversal. Price is now consolidating near $452–$460, forming a possible higher-low setup before a push to $488–$500 zone.
* Bias: Bullish continuation unless price closes below $411.
* Support: $367 → $411 zone
* Resistance: $470 → $488 zone
* MACD: Expanding bullish histogram, showing momentum strength.
* Stochastic: Near overbought but still trending upward.
💡 Weekly Thought:
Tesla’s higher timeframe looks ready for another leg up, but a mild pullback to $430–$440 wouldn’t hurt the structure—it would actually create a healthy base for November.
2. Daily (1D) – Momentum Check
The daily chart confirms a strong BOS and ascending channel. After testing the channel’s lower boundary ($411–$420), Tesla rebounded cleanly toward $452. Price is attempting to reclaim the midline of the ascending channel, signaling renewed bullish control.
* Bias: Bullish bias, but short-term profit-taking likely near $460–$470.
* Support: $411 → $420 (demand zone)
* Resistance: $460 → $470 (channel top)
* Indicators:
* MACD turning positive after extended red bars.
* Stochastic curling up from mid-levels — bullish swing signal.
💭 Daily Suggestion:
Buyers should stay patient for pullbacks near $440–$445 to re-enter. Short-term traders can target $468–$470 if price holds above $452 with volume.
3. 1-Hour (1H) – Short-Term Game Plan
Tesla is holding above the intraday uptrend line, with clear Breaks of Structure (BOS) around $451–$455. The immediate zone to watch is the $449–$451 range, acting as dynamic support. As long as Tesla holds this area, intraday bulls maintain control.
* Scalp Bias: Bullish as long as price stays > $449
* Immediate Resistance: $455 → $465
* Support: $439 → $445
* Setup Idea:
* Call scalp: Above $455 for target $462–$468
* Put scalp: Only if breaks below $445 with volume
📈 1H Thought:
If Tesla consolidates sideways around $450–$455 early week, it sets up a launch toward $470 later in the week.
4. GEX & Options Sentiment – Institutional Flow Insight
The Gamma Exposure (GEX) map shows clear call dominance:
* Highest positive GEX wall / resistance: $455–$460
* 2nd & 3rd Call Walls: $465 → $470 → $480
* Put walls / downside support: $430 → $415 → $400
Key Metrics:
* GEX Bias: +57.2% Calls
* IVR: 15.5 (low volatility environment)
* IVx avg: 60.2% (vol compression likely → bullish)
Institutions are positioned bullishly with heavy call exposure at $460–$470, acting as a near-term magnet. The $430–$415 range remains protected by put walls—making it a tough zone to break down through unless macro turns negative.
5. Suggested Option Plays
* Bullish Setup (Preferred):
* Buy-to-open 460C (1DTE/2DTE) if price reclaims $455–$457 with volume.
* Target: $470
* Stop: Below $445
* Reason: Strong call gamma wall at $460 + breakout potential.
* Bearish Hedge (Cautious traders):
* Buy 440P (1DTE/2DTE) only if TSLA breaks $445 on volume.
* Target: $430
* Stop: Above $455
6. My Take for Oct 28–31
Tesla is showing clean bullish structure across all timeframes.
* Weekly confirms a higher low and BOS continuation.
* Daily is aligned within an ascending channel.
* 1H shows intraday bullish trendline support.
* GEX confirms call-dominant sentiment toward $470.
If macro markets remain stable, TSLA likely tests $468–$470 this week, possibly stalling there for profit-taking. A rejection near that level would bring $440–$445 back into play for reload.
🎯 Primary Bias: Bullish toward $470
⚠️ Watch For: Failing to hold $445 = possible short-term correction.
Disclaimer:
This analysis is for educational purposes only and not financial advice. Always manage your risk and perform your own due diligence before trading options or equities.
Tesla / Palantir fractal showing both will hit ATH soonFractals are a mathmatical anomaly, if you understand linear equations (and believe the market is "random"). All assets are doing the same patterns over and over, on all time frames. You just need to see it for what it is.
May the trends be with you.