Get Rich Slowly with this index fund over the long termFollow what Warren Buffett has been saying for years. It works.
Read article here
Now that the price action has break up of the resistance , I expect the rally to continue provided the FED gives no more surprises along the way.
Trade ideas

Choosing which stocks to buy is a mind boggling gameFor simplicity, I chose 3 of my vested assets to show the difference the yearly returns (beginning of 2023 to end 2023) namely, VOO ETF (tracking the SPX500 index), PG (Proctor & Gamble) and Meta (Facebook) stocks respectively.
One can see that PG has given the worst performance returns out of the 3 assets , registering a single negative digit returns of 1.87% , probably worse off had you invested the capital in a bond. The ETF was not too bad, given a 1 year return of 24% and the champion of course is the tech darling, Meta offering a staggering 177% return.
Selecting which stocks to buy is part science (studying the business model, financials,etc) and part luck. I said luck because there is sector rotation at play each year and if you happen to ride on the right sector, you are going to win bigger and faster in the same time frame. However, putting all your eggs in one sector can be dangerous as it could quickly falter or goes out of favour this year for many reasons that an individual investor cannot control.
Therefore, I park some of my funds in the VOO ETF which offers me a not too bad returns consistently and the winning stocks I selected are a bonus. I make sure that capital allocation does not get too big so that if anything happen, my pot of diversified assets will help to rebalance the losses.
For those new to the market, you might want to consider an ETF that you like based on your selection criteria - dividends, geography, sectors, risk exposure,etc.
Please DYODD and manage your capital wisely

YTD Relative comparison of the ARK fundsYear to date relative comparison of the ARK funds shows that the ARK Next Generation Internet ETF (ARKW) is outperfing the rest of the pack.

Get the feeling its going to continue downFast movement up, seems like its going to slowly continue down.

#VOO#The market is about to welcome a bullish reversal.The Vanguard S&P 500 ETF (VOO) remains a quintessential pick for investors seeking to mirror the performance of the S&P 500 Index. The ETF boasts a dividend yield of 1.5736%, with a return of 7.15% over the past year, slightly outpacing the SPY's return of 6.52%.
A technical analysis suggests that VOO is currently in a complete impulse wave pattern, having concluded a corrective phase within its smaller cycle structure. The RSI indicator is nearing the overbought territory on the 4-hour chart, signaling a potential minor price retracement in the short term, which is a natural part of the upward trend.
On the daily chart, the MACD indicator has started to rebound from its lows, indicating a reduction in bearish momentum. Additionally, prices have maintained above the 200-day moving average, signaling positive momentum. A weekly chart review clearly suggests an upcoming bullish market reversal within the next year. The first resistance target is anticipated around $515, with a secondary target near $635.78. The diminishing bearish momentum in the MACD indicator, coupled with the RSI breaking above resistance levels, suggests a hold position on VOO would be prudent. The S&P 500's performance in the upcoming period also looks promising.


Exploring the Publish Idea FeatureExploring the Publish Idea Feature, and the possible options for sharing.

Choose ETF for Longterm InvestmentsChoose ETF for long term investment is always beneficial ,With lowest amount you have ,the investments can keep on be added .
Here are some of the key inputs :
NYSEARCA: VOO is the ticker symbol for the Vanguard S&P 500 ETF, an exchange-traded fund (ETF) managed by Vanguard Group. This ETF seeks to track the performance of the S&P 500 Index, which is one of the most widely followed equity indices in the world. Here are some additional useful insights about VOO:
Investment Objective: VOO aims to provide investors with exposure to the largest and most liquid companies in the United States by tracking the S&P 500 Index. It's designed to replicate the performance of this benchmark index.
Diversification: By investing in VOO, you're essentially buying a piece of all 500 companies listed in the S&P 500. This provides a high level of diversification across various sectors of the U.S. economy.
Low-Cost Investing: Vanguard is known for its low-cost investment products, and VOO is no exception. It typically has a very low expense ratio, making it an attractive option for cost-conscious investors.
Liquidity: VOO is one of the most heavily traded ETFs, which means it tends to have high liquidity. This makes it easy for investors to buy and sell shares on the stock market.
Dividend Yield: The ETF generally pays dividends based on the income earned from the underlying S&P 500 stocks. These dividends are typically distributed to shareholders on a quarterly basis.
Tax Efficiency: ETFs like VOO are often tax-efficient investment vehicles. They may generate fewer capital gains compared to mutual funds because of their unique structure, which can be advantageous for taxable accounts.
Long-Term Investment: VOO is commonly used by long-term investors who want to build wealth gradually over time. It's often included in retirement portfolios and other investment accounts with a long-term horizon.
Benchmark for Performance: Many investors and financial professionals use the S&P 500 as a benchmark for gauging the performance of their investments. VOO can be used to assess how well a portfolio is doing compared to the S&P 500.
Risks: While VOO provides diversification, it's important to note that it is still subject to market risk. If the overall stock market experiences a downturn, VOO's value will likely decline as well. It's important for investors to have a diversified portfolio that includes a mix of asset classes to manage risk effectively.
Options for Investors: VOO also offers options contracts, allowing investors to use strategies like covered calls or protective puts to tailor their risk exposure or generate additional income.
Dividend Growth: The S&P 500 companies have a history of paying dividends, and over time, these dividends have generally increased. This can make VOO attractive for income-seeking investors.
Capital Gains: Investors who hold VOO may also benefit from capital gains as the underlying stocks appreciate in value. This can be a source of potential long-term wealth accumulation.
Compound Annual Growth Rate (CAGR): The CAGR for VOO is primarily linked to the performance of the S&P 500 Index, as VOO seeks to replicate its performance. The CAGR represents the annualized rate of return over a specific time period. Historically, the S&P 500 has delivered an average CAGR of around 7-9% over long-term periods, but this can vary significantly based on the time frame considered and market conditions. Keep in mind that past performance is not indicative of future results.
Risk Factors:
Market Risk: VOO is exposed to market risk, meaning its value can fluctuate with the performance of the S&P 500 Index. If the index experiences significant declines, VOO's value will also drop.
Sector Concentration: VOO is heavily concentrated in the sectors represented in the S&P 500. Therefore, it may be more sensitive to the performance of these sectors, and any issues affecting them can impact the ETF.
Interest Rate Risk: Like other equity investments, VOO may be influenced by changes in interest rates, particularly if there are significant shifts in the yield curve.
Liquidity Risk: While VOO is generally highly liquid, there may be instances where market conditions affect the liquidity of the ETF, potentially leading to wider bid-ask spreads.
Price-to-Earnings (P/E) Ratio: The P/E ratio is a measure of a company's or index's valuation. It's calculated by dividing the current price by the earnings per share (EPS) or, in the case of an ETF like VOO, by the aggregate earnings of the underlying companies in the index. As of my last knowledge update, the P/E ratio of the S&P 500 (and consequently VOO) tends to fluctuate based on market conditions, earnings reports, and economic factors. Historically, the P/E ratio of the S&P 500 has averaged around 15-20x, but this can vary widely.

VOO long positionOn the chart we can see a bullish trend. Our strategy is enter a long position as the price is breaking resistance.
Invalidation of this thesis would be if the price comes back below the support.

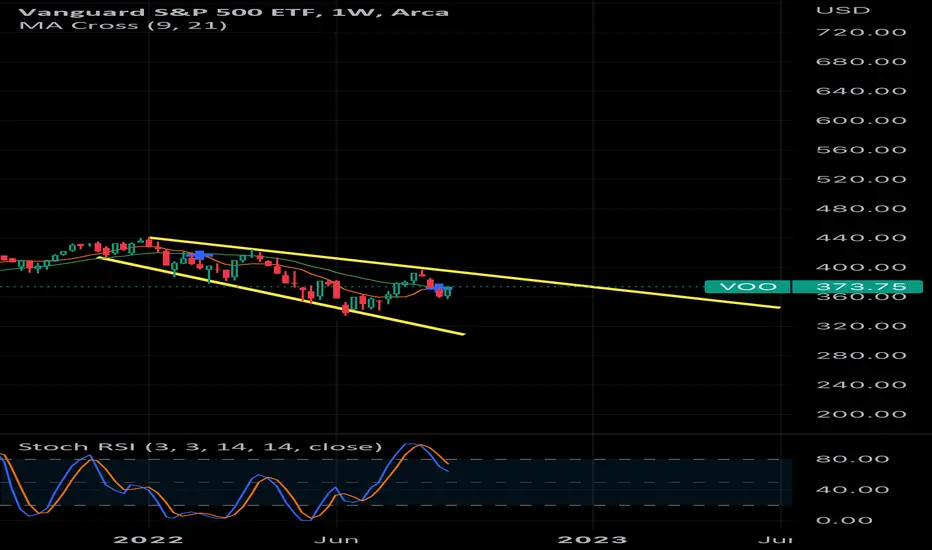
SB CROSSsb cross for ma
Looking at two moving averages crossing each other to estimate a market entry in this kind of market environment.

VOO - Rising Trend Channel [MID -TERM]🔹Strong rising trend channel in the medium long term.
🔹POSITIVE signal breakout 401 resistance in Rectangle Formation.
🔹Between support 395 and resistance 424, 439.
🔹RSI rises to 70 due to recent price rise.
🔹Technically POSITIVE for the medium long term.
Chart Pattern;
🔹DT - Double Top | BEARISH | 🔴
🔹DB - Double Bottom | BULLISH | 🟢
🔹HNS - Head & Shoulder | BEARISH | 🔴
🔹REC - Rectangle | 🔵
🔹iHNS - inverse head & Shoulder | BULLISH | 🟢
Verify it first and believe later.
WavePoint ❤️

VOO possibel bullishpossible bullish movement we can expect a test to for LPS and then a push to the upside
look for smaller time frames schematics and possible moves for the overall bullish bias


VOO : Not out of the woods yetI believe the VOO for the S&P500 is still in the bear market range. Likely that the index will trade sideways within the support and resistance levels until the inflation rates are showing signs of improvement. Or when the Fed starts to reduce interest rates.
The index will have to surpass the 396 level to get out of the bear market and enter a bull market. This is around 20% gain from the recent low of 328 back in Sep 2022.
Despite ongoing concerns on the weakening of USD and potential falls of more banks globally, I believe the market decline thus far has priced in those impact.
Note that USD strengthened to never before seen levels during the pandemic. Hence I believe, it is currently correcting its levels to normalcy.
Risks to the VOO;
- Further increase in interest rates
- USD weakening to below the pre-pandemic levels
- Hyperinflation environment in the US economy
- Unforeseen black swan

VOO ETF S&P 500From TA it is will 343. it it does not hold it goes down to 332. if that does not hold it goes down to 321. i expect it to turn at this level. But if it doesn't next stop will be around 300-7 level.


S&P 500 Recession PlanYahoo Finance's Jared Blikre breaks down Thursday's market action with both the S&P 500 and Nasdaq closing the day in the red.
Video Transcript
SEANA SMITH: We're counting down to the closing bell. Jared Blikre is at the big board with some of the moves that we're seeing. What do you got, Jared?
JARED BLIKRE: Well, we're all awaiting Amazon and Apple earnings after the bell. But let's just focus on Meta one more time, down 24%, 24 and 1/2% here. Now, market on a market cap basis, we are now looking at a $263 billion handle. I remember when Meta used to take up all of this space. Here was Nvidia. Here was Tesla. Now we got this little quadrant down here-- something to consider.
Want to take a look at the price action in the sectors today. And let's get it back to a percentage basis. Here we go. Industrials, financials, utilities, energies, and now staples all in the green, mainly favoring the value trade here. Let's take a look at what's happened over the last four days. Pretty similar-- industrials, staples, financials, real estate, utilities, all of those outperforming.

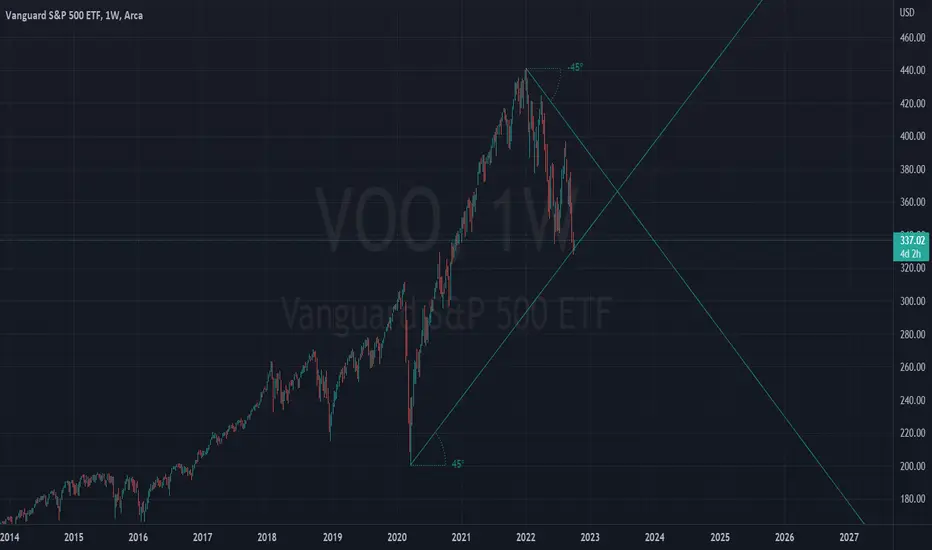
always darkest before dawnwatch for a reversal here to the long side.
130 points in 130 weeks. price and time are equal on a weekly basis.
the 45-degree angle can be used as a stop loss since a move below will indicate much lower prices.
Down trend , not down wave The trend is over all contain several wave
We was in correction wave for the over all down trend
What to expect ?
So i think we can move higher but iam full selling power now
Daily stochastic is moving up but be careful from weekly its showing down trend and we can move down any time soon
Selling is winning here
VOO approaching previous support, does it act as resistance? :)just like spy this previous support level has acted as resistance once in the last bear market rally, but break above 384 area and we can see 400+ short term.
watching longs above 384.76 / shorts below 367

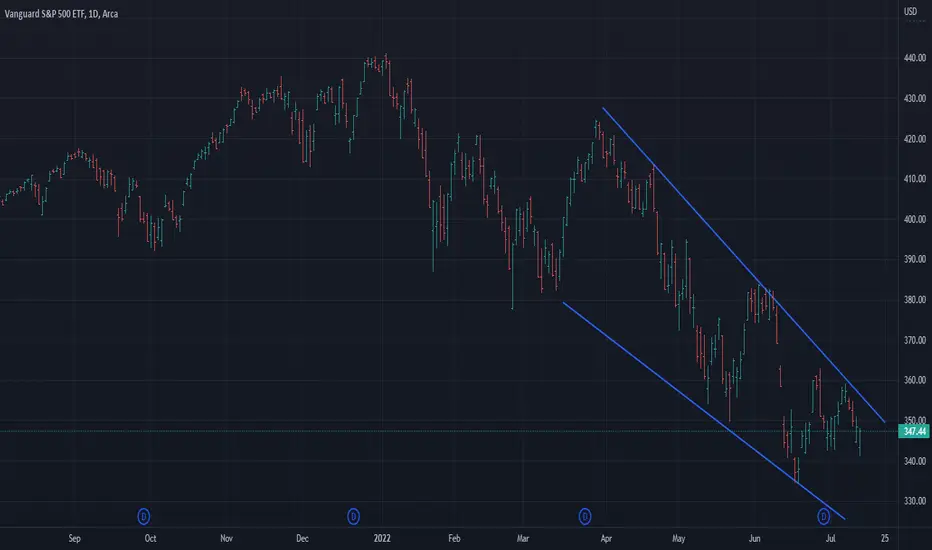
VOO headed toward a falling wedge?Looks like it's getting really close to a falling wedge.
If the trend continues downward I will likely buy back into VOO.