AMAT LongI've just spotted a nice pattern on AMAT.
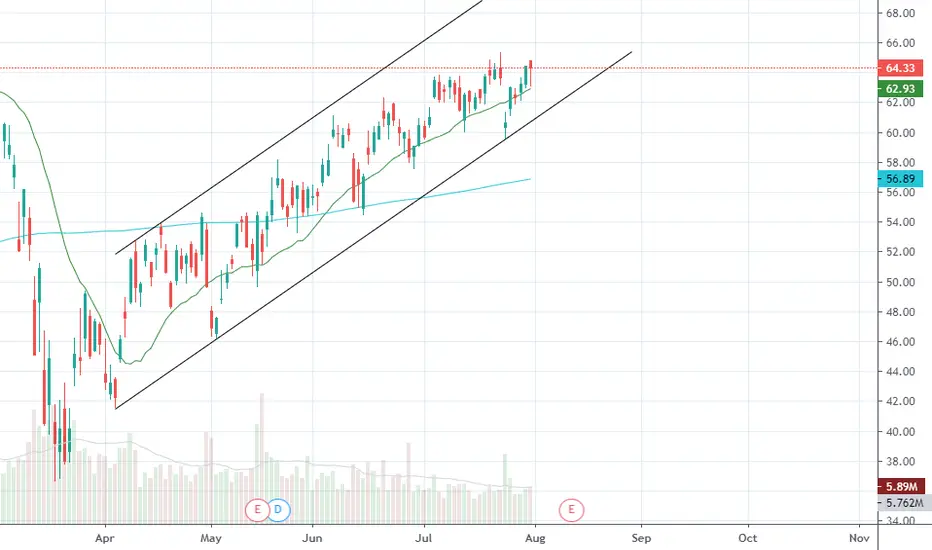
We can see 3 recent bounces off the 50 EMA, and the stochastic indicator at the lows. with a rapid trendline up, this gives a good buying oppotunity.
Best of luck to all!
Trade ideas


Applied Materials - Bullish pullback trade ?Applied Materials ( NASDAQ:AMAT ) has an interesting chart in that it tends to pull back below the 21 EMA on the daily chart. I tried to identify a clear area of support for each pullback, but it seems arbitrary. You can see the Keltner Channel falls just short of where the stock reverses the second time and the most recent pullback is actually pulling back to the 34 EMA which I initially did not want to put on my chart to avoid too many lines... but I figured, seeing is believing, so I put a big fat orange line to add to the chart.
AMAT is an upward trending stock and has decent volume...approx 5 million shares traded today...I sorted the S&P 500 constituents by volume and AMAT was #19 in volume (#1 being highest volume which was GE). I did see other stocks that were pulling back as well, but something about their charts didn't convince me.
OK prediction time... so based on what I see on the charts I think we might see AMAT find support at $62.65 ... from there I think its going to ride back up. It is oversold based on the 60 min time frame, but not quite there on the daily time frame... so keep an eye on it tomorrow. If it comes down to $62.65 or to the lower Keltner channel band I wouldn't be surprised... but be wary if it breaks below that. Those considering to go long now, might be a little early...or could be lucky and end up hitting it right on the nose because it doesn't tend to stray too far below the 21 EMA and today's red candle was a decent size.

Dip on the UptrendClear uptrend on NASDAQ:AMAT within health retracement session.
We shall see bullish price action above point of control to signal an entry.
Trade not significant if price move to low transaction zone (which is below 50MA in this chart), indicating weakening of bullishness.

AMAT: a fast and a guaranteed Win Easy, quick and guaranteed are the qualities that characterized the most this stock market. Practically talking, we should enter the stock market with a buying position and leave though a selling one. It's really easy to decide.
The suitable time to realize each action is shown in the chart.
traders who are concerned: write in commments.


AMAT - Applied Materials Stock AnalysisBased on Technical Analysis, the idea is to go long as per major trend - watch out the possible price set back before starting a new rally.
Applied Materials (AMAT) – Applied Materials reported adjusted quarterly earnings of $1.06 per share, 11 cents above estimates, while the maker of semiconductor manufacturing equipment also saw revenue beat Wall Street forecasts. Applied Materials also gave an upbeat current-quarter forecast amid rebounding demand.

Applied Materials 1 Hour Chart Applied Materials 1 Hour Chart
Buy & Hold
A Profit & Solutions Strategy

$AMAT Applied Materials Catchup trade
By no means a certainty but expectations are for a beat on earnings but much depends on commentary and guidance.
While most have popped on earnings, XLNX &WDC for example have failed to impress.
Safer to wait for earnings and trade the breakout rather than carry risk into the event.
PLEASE GIVE US A LIKE IF YOU FIND OUR CONTENT HELPFUL, THANK YOU.
$AMAT Applied Materials Long Into earnings
Potential long above $68.00
Upside breakout target $75.00
Stop loss $66.00

Applied Materials earnings previewOn Thursday, Applied Materials (AMAT), the global leader in materials engineering solutions for the semiconductor industry, is expected to post 3Q EPS of $0.94 compared to $0.74 last year on sales of $4.2B vs $3.6B a year ago. The stock has an expected move of 5.2% and dropped 4.4% after the last earnings release. The stock has 22 buys, 5 holds and 0 sell recommendations according to Bloomberg Consensus.

$AMAT possible bounceNice little "red to green" day on Friday
Price found support just above EMA50 and 23.6FibR ( move from Dec 18 lows)
Volume on Friday was double the 20MA VolAvg
Target 62s and then 64s

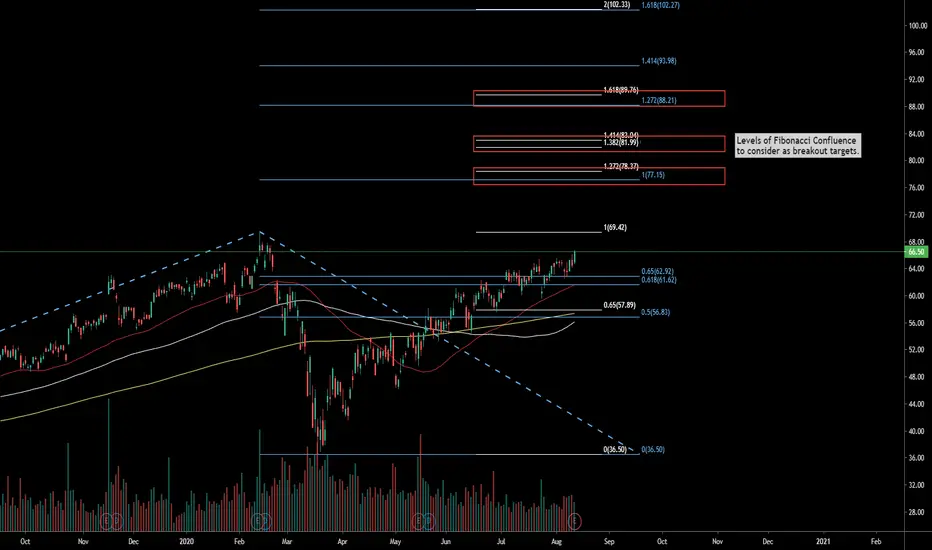
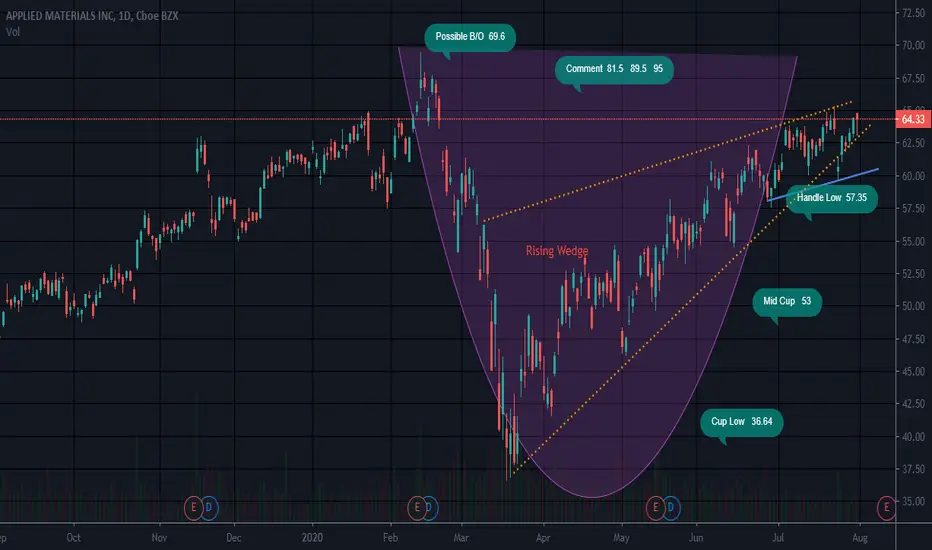
C&HEarnings estimated to be on 8-13 AMC Targets 81.9 89.5 95
Stop under handle Low
I own this but I do not recommend it.
Small rising wedge but has dipped past the bottom trendline of the rising wedge at 58 to 59(ish) Beware as it has just barely pierced bottom trend line 6 trading days ago. Was saved by handle low
The Handle Low can provide support. But we all know that support and resistance levels were made to be broken or everything would be ranging all of the time (o:

AMAT good momentum build $65 Target$AMAT Good looking stock building and setting up nicely. Target $65

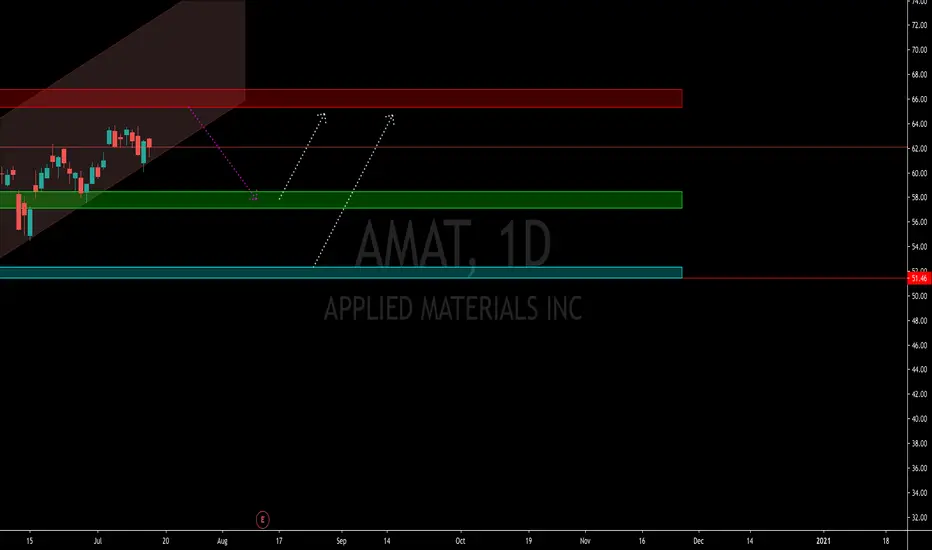


AMAT SWING TRADING OPPORTUNITYRISING WEDGE AND PRICE ACTION SETUP.
BUY RANGE : $59.5 TO $61.5
STOP LOSS : $58.00
ENJOY YOUR TRADE!

AMAT 19% profit / Long trade 57.86 -> 69.00 / Stop Loss: 55.08Short-term trade idea for NASDAQ:AMAT .
Long trade 57.86 -> 69.00 / Stop Loss: 55.08 (use Trailing Stop with 2.79 below the market).
Profit: 19%, Risk: 4.75%, Risk ratio = 1/4 for all our ideas.
Size: no more 5% of the portfolio for all our ideas.
Idea trade based on patterns: Fibonacci 61.8%.
Stay tuned with more ideas and market signals with our Telegram-bot.

