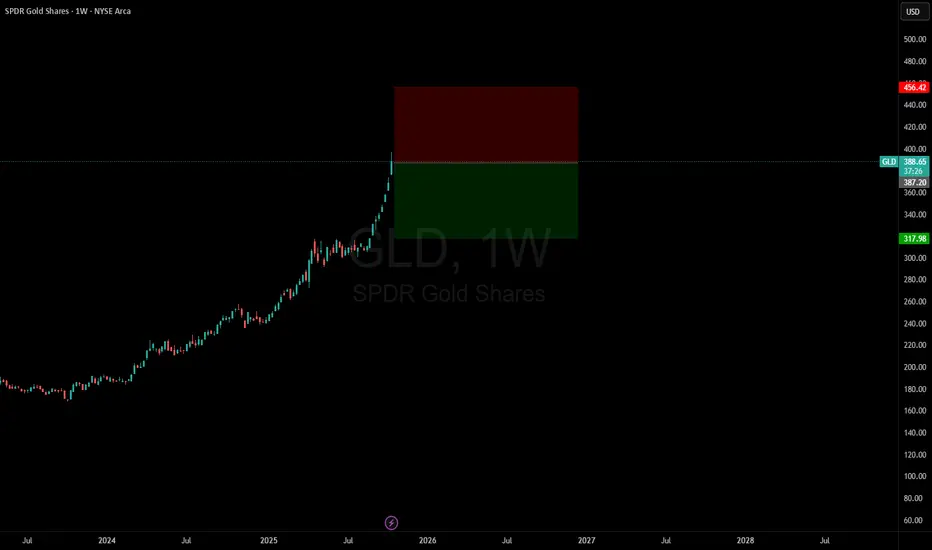
Buy the dip in GLD? Back above $400From a sentiment perspective, everyone is bearish GLD now that it's fallen so much over the last week. However, from the chart perspective, it looks like a great place to buy the dip.
If I turn on Bollinger bands, price is the furthest it's been outside of the bands to the downside from as far as I
Key stats
About SPDR Gold Shares
Home page
Inception date
Nov 18, 2004
Structure
Grantor Trust
Replication method
Physical
Distribution tax treatment
Return of capital
Income tax type
Collectibles
Max ST capital gains rate
39.60%
Max LT capital gains rate
28.00%
Primary advisor
SSgA Funds Management, Inc.
Distributor
State Street Corp. (Fund Distributor)
ISIN
US78463V1070
GLD is the first to market to invest directly in physical gold. The product structure reduced the difficulties of buying, storing and insuring physical gold bullion for investors. Actively traded, the shares provide deep liquidity. NAV for the fund is determined using the LBMA PM Gold Price (formerly the London PM Gold Fix), so GLD has an extremely close relationship with spot prices. Its structure as a grantor trust protects investors, trustees cannot lend the gold bars. However, taxes on long-term gains can be steep, as GLD is deemed a collectible by the IRS. Also, GLD's NAV has a larger handle, which corresponds to more gold exposure per share. As such, those impacted by per-share trading costs may prefer GLD over similar funds.
Related funds
Classification
What's in the fund
Exposure type
Miscellaneous
Bonds, Cash & Other100.00%
Miscellaneous100.00%
Top 10 holdings
$GLD: CD = 0.618 ABAMEX:GLD had a craze run and got hit with a big wave of shorts and profit taking above $4400/oz. I don't think the bull market in gold is over, only that it's in a correction.
It looks like a zigzag correction is unfolding. CD has reached 0.618 AB this morning, which enticed a bounce. It can go t

Gold is Heating Up – Watch GLD for Big BUY MovesTechnical analysis of GLD highlights a setup with strong upside potential. Traders should observe volume spikes and price behaviour around Support areas for confirmation

GLD Have a Majory PullBack Coming? Few weeks ago I mentioned how overpriced Gold was. Some people wanted to debate and argue with me at 400 but today we can see who was right. But I'm giving another trade idea here today of Gld dropping again. Enjoy

Gold UpdateThis week, gold took a bit of a beatdown not surprising given it just hit an all-time high (ATH). I’m still bullish with call options expiring in 2026. On the 1-hour chart I’m watching for a short-term bounce. A lot of traders are expecting a deeper pullback since the 1-week and 1-month RSIs are bot

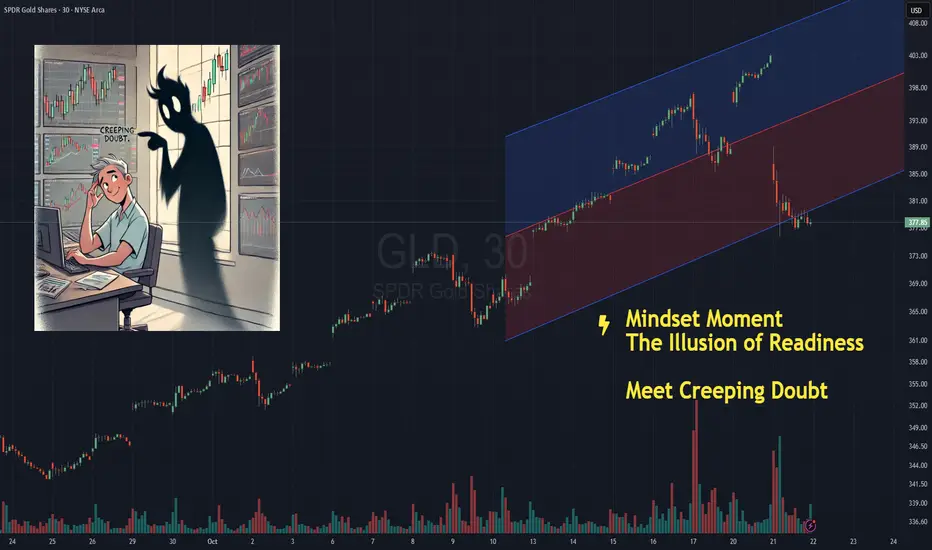
The Illusion of Readiness - Creeping DoubtNOTE – This is a post on mindset and emotion. It is not a trade idea or strategy designed to make you money. My intention is to help you preserve your capital, energy, and focus - so you can trade your own system with calm and confidence.
You know that feeling before you click buy or sell .
Y
$GLD may have further to fallAMEX:GLD has had 6 days in 6 weeks where both the closing price has been lower than the preceding day's close, and the volume has been higher than the preceding day.
I think this is bearish.

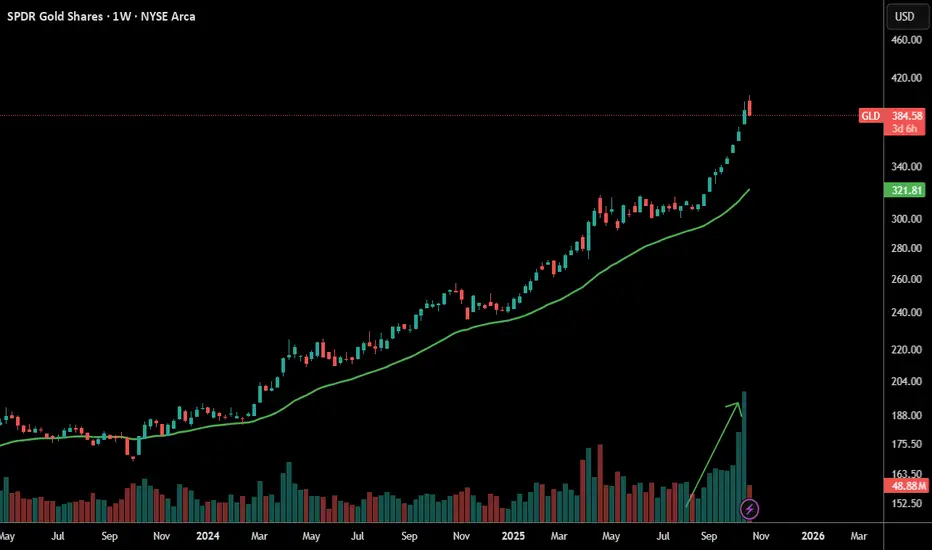
Gold in correctionGold likes the 30 week EMA, in all its bull trends it checks up on the 30 week ema frequently. Will be healthy to test, doesn't mean it's a top! See what happens at support.
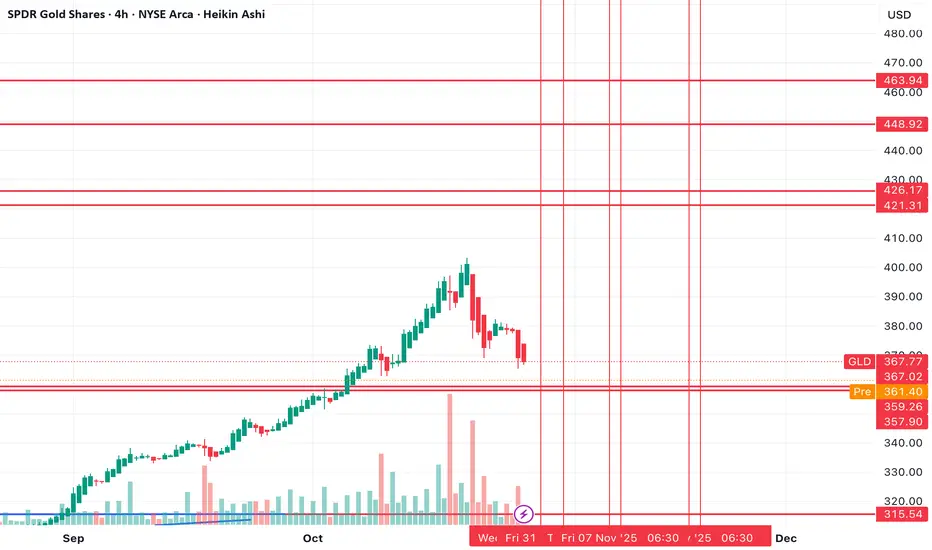
GLD OCT 2025GLD (SPDR Gold Shares) 4H Analysis
Price rejected the $400 resistance zone after a strong institutional rally, showing early signs of distribution near the top. There’s a visible gap around $370, likely to be retested before any continuation higher. Below, the $345–$340 range remains a key absorpti

Short GLDGold is now over $4,200 and I believe there is a trade to the down-side.
Understand, it VERY hard to call a top in such a powerful bull market move. Most of the time, you WILL lose this trade.
Even when you do win these type of trades, the price action will usually go against you before it goes in
See all ideas
Summarizing what the indicators are suggesting.
Oscillators
Neutral
SellBuy
Strong sellStrong buy
Strong sellSellNeutralBuyStrong buy
Oscillators
Neutral
SellBuy
Strong sellStrong buy
Strong sellSellNeutralBuyStrong buy
Summary
Neutral
SellBuy
Strong sellStrong buy
Strong sellSellNeutralBuyStrong buy
Summary
Neutral
SellBuy
Strong sellStrong buy
Strong sellSellNeutralBuyStrong buy
Summary
Neutral
SellBuy
Strong sellStrong buy
Strong sellSellNeutralBuyStrong buy
Moving Averages
Neutral
SellBuy
Strong sellStrong buy
Strong sellSellNeutralBuyStrong buy
Moving Averages
Neutral
SellBuy
Strong sellStrong buy
Strong sellSellNeutralBuyStrong buy
Displays a symbol's price movements over previous years to identify recurring trends.
Frequently Asked Questions
An exchange-traded fund (ETF) is a collection of assets (stocks, bonds, commodities, etc.) that track an underlying index and can be bought on an exchange like individual stocks.
GLD trades at 365.80 USD today, its price has risen 0.52% in the past 24 hours. Track more dynamics on GLD price chart.
GLD net asset value is 365.10 today — it's risen 2.09% over the past month. NAV represents the total value of the fund's assets less liabilities and serves as a gauge of the fund's performance.
GLD assets under management is 134.37 B USD. AUM is an important metric as it reflects the fund's size and can serve as a gauge of how successful the fund is in attracting investors, which, in its turn, can influence decision-making.
GLD price has risen by 1.33% over the last month, and its yearly performance shows a 44.24% increase. See more dynamics on GLD price chart.
NAV returns, another gauge of an ETF dynamics, have risen by 2.09% over the last month, showed a 17.45% increase in three-month performance and has increased by 44.12% in a year.
NAV returns, another gauge of an ETF dynamics, have risen by 2.09% over the last month, showed a 17.45% increase in three-month performance and has increased by 44.12% in a year.
GLD fund flows account for 58.47 B USD (1 year). Many traders use this metric to get insight into investors' sentiment and evaluate whether it's time to buy or sell the fund.
Since ETFs work like an individual stock, they can be bought and sold on exchanges (e.g. NASDAQ, NYSE, EURONEXT). As it happens with stocks, you need to select a brokerage to access trading. Explore our list of available brokers to find the one to help execute your strategies. Don't forget to do your research before getting to trading. Explore ETFs metrics in our ETF screener to find a reliable opportunity.
GLD expense ratio is 0.40%. It's an important metric for helping traders understand the fund's operating costs relative to assets and how expensive it would be to hold the fund.
No, GLD isn't leveraged, meaning it doesn't use borrowings or financial derivatives to magnify the performance of the underlying assets or index it follows.
In some ways, ETFs are safe investments, but in a broader sense, they're not safer than any other asset, so it's crucial to analyze a fund before investing. But if your research gives a vague answer, you can always refer to technical analysis.
Today, GLD technical analysis shows the neutral rating and its 1-week rating is buy. Since market conditions are prone to changes, it's worth looking a bit further into the future — according to the 1-month rating GLD shows the buy signal. See more of GLD technicals for a more comprehensive analysis.
Today, GLD technical analysis shows the neutral rating and its 1-week rating is buy. Since market conditions are prone to changes, it's worth looking a bit further into the future — according to the 1-month rating GLD shows the buy signal. See more of GLD technicals for a more comprehensive analysis.
No, GLD doesn't pay dividends to its holders.
GLD trades at a premium (0.19%).
Premium/discount to NAV expresses the difference between the ETF’s price and its NAV value. A positive percentage indicates a premium, meaning the ETF trades at a higher price than the calculated NAV. Conversely, a negative percentage indicates a discount, suggesting the ETF trades at a lower price than NAV.
Premium/discount to NAV expresses the difference between the ETF’s price and its NAV value. A positive percentage indicates a premium, meaning the ETF trades at a higher price than the calculated NAV. Conversely, a negative percentage indicates a discount, suggesting the ETF trades at a lower price than NAV.
GLD shares are issued by State Street Corp.
GLD follows the LBMA Gold Price PM ($/ozt). ETFs usually track some benchmark seeking to replicate its performance and guide asset selection and objectives.
The fund started trading on Nov 18, 2004.
The fund's management style is passive, meaning it's aiming to replicate the performance of the underlying index by holding assets in the same proportions as the index. The goal is to match the index's returns.