Nightly $SPY / $SPX Scenarios for August 12, 2025 🔮 Nightly AMEX:SPY / SP:SPX Scenarios for August 12, 2025 🔮
🌍 Market-Moving News 🌍
🇨🇳 Tariff Truce Extended 90 Days
The White House signed an order late Monday extending the U.S.–China tariff pause by 90 days—removing a key overnight risk into CPI day. Watch AMEX:SPY / SP:SPX , TVC:DXY , NASDAQ:TLT for the reaction.
💵 Dollar Firms Into CPI
The dollar edged higher ahead of this morning’s inflation print as traders recalibrate rate-cut odds; stocks and long U.S. yields were choppy into the release.
🗓️ Quiet Tape, Big Catalyst
Futures and global markets stayed cautious into CPI; positioning is tight after Monday’s drift lower.
📊 Key Data Releases & Events (ET) 📊
📅 Tue, Aug 12
6:00 AM — NFIB Small Business Optimism (July).
8:30 AM — CPI (July) & Core CPI (official BLS release).
10:00 AM — Richmond Fed Pres. Tom Barkin speaks (Chicago; 9:00 CT).
10:30 AM — Kansas City Fed Pres. Jeff Schmid speaks (9:30 CT).
2:00 PM — Monthly U.S. Federal Budget (July) (Treasury MTS, 8th business day).
⚠️ Disclaimer: Educational/informational only — not financial advice.
📌 #trading #stockmarket #economy #CPI #Fed #SPY #SPX #DXY #TLT
Trade ideas

Spy looking to jump and dump? August 11-22This week watching AMEX:SPY I am looking at the Spy's rsi on a few time frames wanting more bullishness but lacking the strength. Watching some data this week or any news- this might be the catalyst to achieve the clear want for more upside (642-645) before any further flush. I see us, in this bullish case, to touch highs again and possibly test it or go a bit higher before playing out the bearish divergence and weakness that has been showing on the Adx, rsi, and price action (candles) over the last 2 weeks. I still see a flush this weak based on lack of strength in adx, and rsi possibly down to 624- 619 if not this week, next.
I also see the possibility due to weakness again that we drop immediately this week instead of a 14 day outlook this could very well be playing out this week, again maybe with the assistance of the data incoming this week. In this case if we drop before Wednesday I feel like the weakness will possibly be completed and we will see returning bullishness by end of week Friday or Monday- Tuesday next week. We are very low on the adx, meaning I do see big movement coming and good opportunity to be Ready and Prepared.
watch key support and resistance lines drawn horizontally and angled around trends and gathering of price action. A break of the lines could signal key support (bullishness) or key resistance (bearish) levels. Pay attention to places of interest and watch the bull v bear volume this next few days.
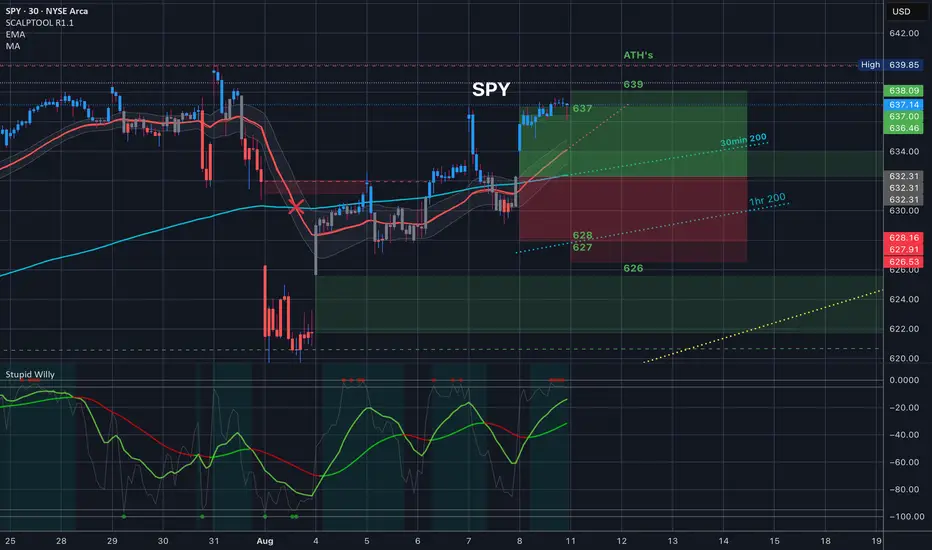
$SPY All Time High’s in view // Last Friday reviewThis is a review of last Friday’s price action. We opened with a gap up and a rally to the top of the implied move. We actually took it to the top of the 30 day average volatility, which rounded out was the same number 637.
The expected move for the next day (Monday) was 639 so spreads at 637/639 paid if you went in at 35% of the width of the spread (.70).
(hit GRAB THIS CHART) under the chart to populate my chart and setting onto your chart. 💃🏻
Weekly $SPY / $SPX Scenarios for August 11–15, 2025🔮 Weekly AMEX:SPY / SP:SPX Scenarios for August 11–15, 2025 🔮
🌍 Market-Moving News 🌍
🇺🇸 Inflation Double-Header: CPI Tue + PPI Thu set the tone for AMEX:SPY / SP:SPX , rates, TVC:DXY , $TLT.
🏦 Fed Speaker Blitz: Barkin, Schmid, Goolsbee, Bostic—watch headlines for rate-path hints.
🛍️ Consumer Pulse Friday: Retail Sales + Industrial Production/Capacity Utilization = read on demand & output.
🧭 Keep it tight: Focus on CPI, PPI, Claims, Retail Sales, IP/CapU. Everything else is background noise.
📊 Key Data Releases (most impactful only) 📊
📅 Tue, Aug 12
• CPI (July) — Headline & Core (8:30 AM ET)
• Fed: Barkin & Schmid speak (10:00 AM ET)
📅 Thu, Aug 14
• Initial Jobless Claims (8:30 AM ET)
• PPI (July) — Headline & Core (8:30 AM ET)
• Fed: Barkin (2:00 PM ET)
📅 Fri, Aug 15
• Retail Sales (July) — Headline & Ex-Autos (8:30 AM ET)
• Industrial Production (July) (9:15 AM ET)
• Capacity Utilization (July) (9:15 AM ET)
• Consumer Sentiment (Prelim, Aug) (10:00 AM ET)
⚠️ Disclaimer:
Educational/informational only — not financial advice. Consult a licensed financial advisor before investing.
📌 #trading #stockmarket #economy #CPI #PPI #retailsales #Fed #SPY #SPX
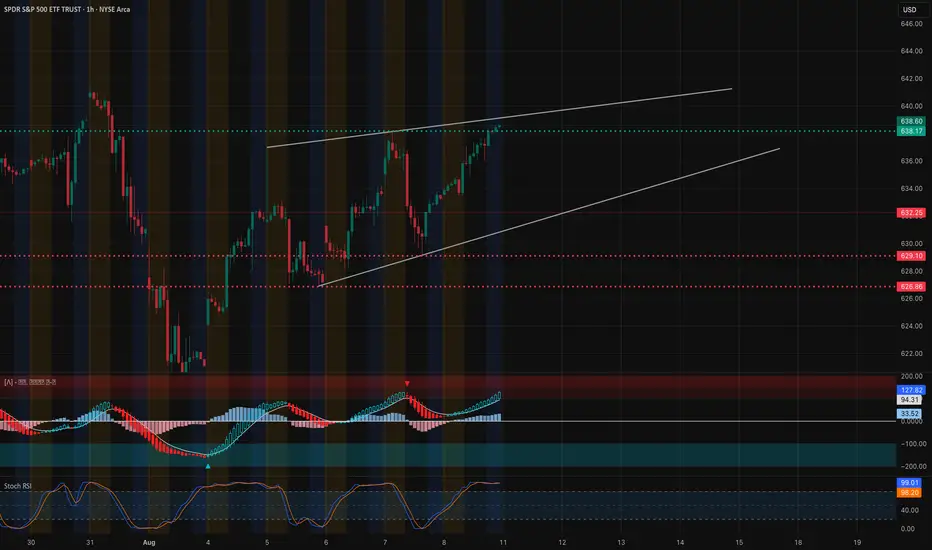
SPY Technical Analysis & GEX OutlookTechnical Analysis (1H Chart)
SPY is currently pressing into the upper boundary of a rising wedge pattern, approaching the 638–642 resistance zone. Price action has been in a controlled uptrend since the bounce from the 625 demand level, supported by higher lows. However, MACD shows strong momentum but is nearing extended territory, while Stoch RSI is overbought at ~99, signaling potential exhaustion. If price rejects at this wedge top, a pullback toward 632.25 (trendline & prior support) becomes likely. A clean breakout above 642 would invalidate the immediate bearish wedge bias and open a path to higher highs.
Key Support Levels:
* 632.25 – First support / trendline confluence
* 629.10 – Major shelf support
* 626.86 – Last strong demand zone before breakdown
Key Resistance Levels:
* 638.17 – First upside target
* 642.35 – Rising wedge breakout level & gamma wall
GEX & Options Sentiment
Options data shows the highest positive NET GEX at 638.60 (CALL resistance / gamma wall), with additional resistance stacking at 642. These levels act as dealer short gamma zones, meaning moves into them could slow unless there’s significant buying pressure. On the downside, large PUT support sits at 631 and heavier protection at 625 — losing this level could accelerate downside momentum.
Options Flow Snapshot:
* IVR: 12.4 (low vol environment; cheaper premiums)
* Call positioning concentrated at 638 & 642
* Put positioning heavier below 631, especially at 625
* GEX: Mildly bullish bias as long as SPY stays above 631
Trade Thoughts:
* Bullish Scenario: Break and hold above 642 → Target 646–648; favor short-dated calls or debit spreads while IV is low.
* Bearish Scenario: Rejection at 638–642 → Short with puts targeting 632, then 629.
* In both cases, watch for momentum shift as Stoch RSI resets.
Disclaimer: This analysis is for educational purposes only and is not financial advice. Always manage risk and trade according to your plan.
SpySo, all bearish weekly technicals from last week did not give a follow through. From experience, I've learned that if a stock closes bearish on the weekly candle then by Wed of the following week we should start heading lower and if that's not happening then I need to be open to upside.. Technicals analysis is not to be followed like the 10 commandments, it is a tool here to help take your trading/investment from a 50/50 gamble to a 80/20 Risk.
With that being said, in one of my previous Spy ideas I mentioned Spy 650, I think we are headed there now. I don't want to to rehash everything from that post so if you like , you can see the link at the bottom.
Market runs on tech...
This is where we stand with NASDAQ:QQQ
4 hour chart here
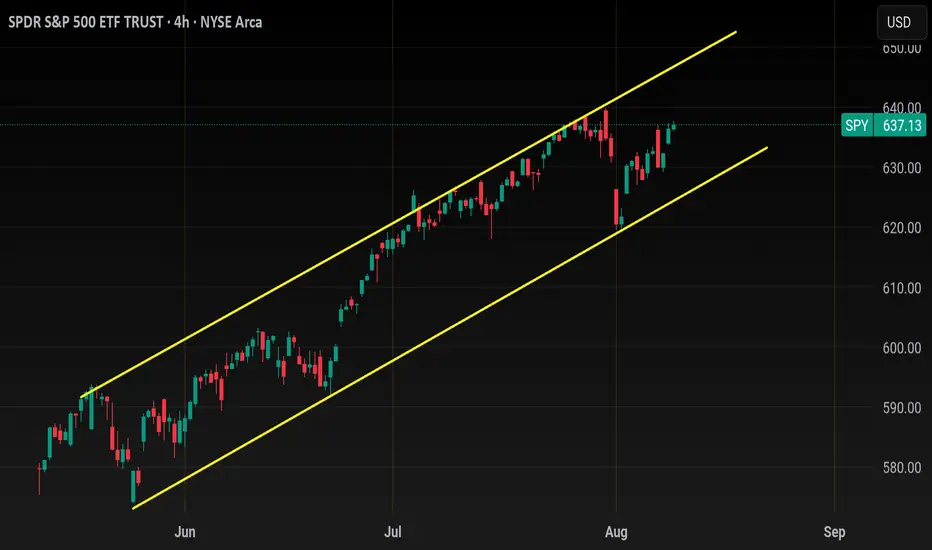
White line is our summer channel , the 3 green circles are highlighted to show uptrend validation. The yellow channel is our range from last week and I think this week we will continue trading inside to the upside.
We can either start the week with a pullback to 569 and trendline support before heading higher or we just grind higher from Monday
As of now things are only bearish back below 560..
Like said before, I think 585 will be the top on QQQ before the Fall reset and Sept correction.. But if you traded through Nov-Jan before you'd know that even a 10-15% correction in sept could be regained in that holiday squeeze (Seasonality).
AMEX:SPY
You are what you eat and Spy is identical to Qqq. Starting the week I wouldn't chase longs until price clears 640.00. A personal rule of mine when dealing with trading Spy is to wait for a 1$ move above or below previous resistance or support to short or long.
As you can see, the only time price has broken above 638 was with gap ups that flush back down so if you long anything early next week on Spy you should have stop below 637.00
634-637 is chopping range.
A lot of volume came in on that bearish engulfing on July 31st so 640 is the current hurdle and this is why I don't recommend longs below it.. in hindsight that july 31st move could've just been some last trading days of july shenanigans or some rotation
If price breaks below 634 then I like puts to 630.. ONLY BEARISH BELOW 625.00.
So yes, I'm looking for more upside this week because what I see on big tech; more specifically aapl wants higher, tsla is flirting a breakout and googl wants to close gap at 206.
AMEX:IWM
Small caps.. neglected like a middle child.
Lagged the market late week and at first glance it looks bearish, but when you zoom in ,
You'll see a triangle was born with lasts weeks price action. I circle the gap left over near 227 that would be the target of this triangle.
Iwm is bearish only below 218.00, below 218.00 and the triangle is invalid and we are headed back to the 200ma at 215 and below that 210.
How I would play the long side? Well you have 2 options,
1st - wait for a break over the daily 20sma and trendline resistance to long or calls above 222.00.
2nd. Buy near trendline support and price action around 219.50 - 220.00
Both long targets would be 225.50, price could melt to 227 gap close but I'd take profit at 225. As you can see , unrealized gains and turn into pain around 225..
In an extreme upside move you'd get this
But don't quote me on this unless price can close above 225 for the week.
TVC:DJI
Dow jones
Not much to right about Here, with exception of April's dip , price has pretty much range traded
And the fact that we are headed in to Sept leads me to belive we might not break over 45k this quarter.
The smaller price action of the last 2 weeks is similar to AMEX:IWM and without making a short story long I think a triangle is brewing here too. Triangle target would be gap close at 45k
As far as the triangle on TVC:DJI and AMEX:IWM
I think CPI or PPI will make or break so we will find out early in the week
Trade idea
The first is NASDAQ:AAPL
Weekly breakout of an ascending triangle here with a 13% measured move to 245 incoming
I think this week we get another high to 236-240
Me personally, I'm a sticker for entries, so I'd like to hop aboard on a slight pullback to 224-225, then ride it up to 240 gap close. An ascending triangle is the most explosive bullish pattern , and on top of that is this pattern took 4 months to make and consolidate so if I don't get a pullback amd price continues to melt up or 230 early in the week I'll understand but I won't chase
Let's see what happens, but I'll tell you this, after Wed you will see of strength from $aapl.
VolanX Macro & Technical Outlook — SPDR S&P 500 ETF (SPY)📊 VolanX Macro & Technical Outlook — SPDR S&P 500 ETF (SPY)
WaverVanir International LLC | Aug 10, 2025
Macro Context:
U.S. equities remain in a late-cycle rally phase, supported by liquidity flows and resilient earnings.
Fed policy uncertainty is easing; market participants are pricing in rate stability with a potential pivot in the next 6–9 months.
Geopolitical risk remains a latent factor but hasn’t disrupted risk-on sentiment.
Technical Structure (Daily Chart):
Primary Trend: Bullish continuation, respecting the ascending trendline.
Fib Levels: Price reclaimed the 0.786 zone ($629.59) and is pushing toward 0.886 ($634.38).
Current Resistance: $637.18 — breaking and holding above opens path to $669.62 (1.618 extension).
Support Levels:
Strong: $622.06 (Fib confluence)
Critical: $603.21 (trend invalidation zone)
Risk Assessment:
Upside Risk: Overextension into 1.618–2.0 Fib zones could precede sharp retracements.
Downside Risk: Loss of $622.06 could trigger accelerated selling toward $603.21.
Macro Correlation: High beta to liquidity conditions; strong dollar or bond yield spikes could dampen momentum.
Targets:
Near-term: $637.18 break confirmation → $651.17
Mid-term: $669.62 major target (1.618 extension)
Stretch: $687.81 (Fib 2.0) if macro tailwinds persist
VolanX Strategy Bias:
Positioning: Favor long bias with partial profit-taking at $651.17.
Risk Management: Tighten stops under $622.06 on swing positions.
Scaling Plan: Add on confirmed breakout of $637.18 with volume expansion.
💡 WaverVanir Takeaway:
This setup is a textbook late-cycle breakout structure with healthy retracements and controlled risk zones. Patience and disciplined scaling will be key in capturing the 1.618 target zone.
#VolanX #WaverVanir #SPY #Macro #TradingStrategy #FibAnalysis #RiskManagement #StockMarket

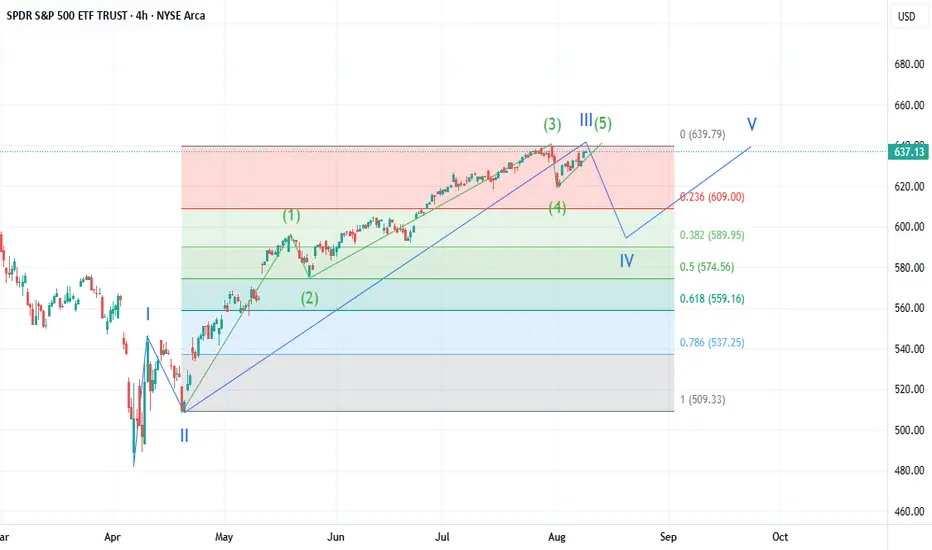
SPY: End of Wave 3Based on how I see the wave structure of SPY, SPX, NQ1, and QQQ, it seems more likely that we are at the end of Wave 3 rather than Wave 5. Over the next 2 to 4 weeks, I expect a sharp decline in SPY to 591 before a final rally to 640 - 660.
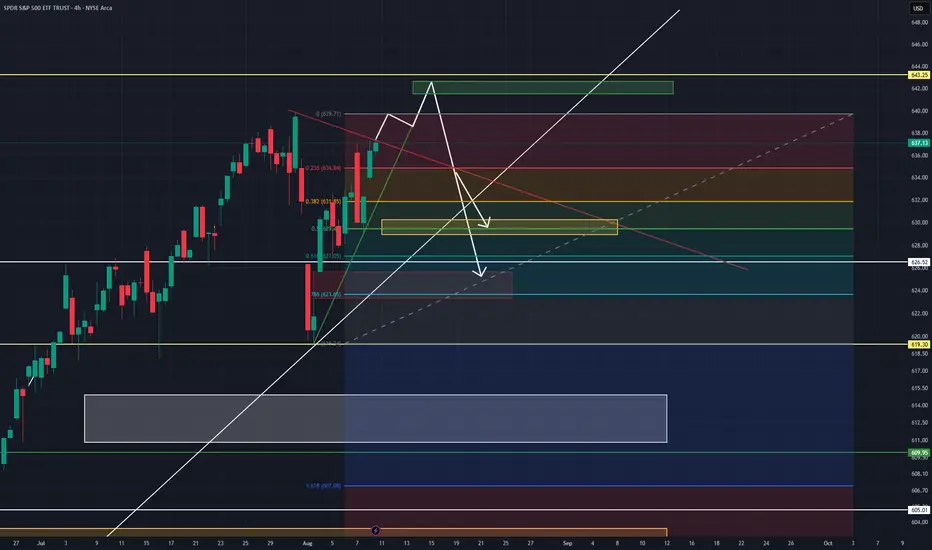
SPY: Short Trade with Entry/SL/TP
SPY
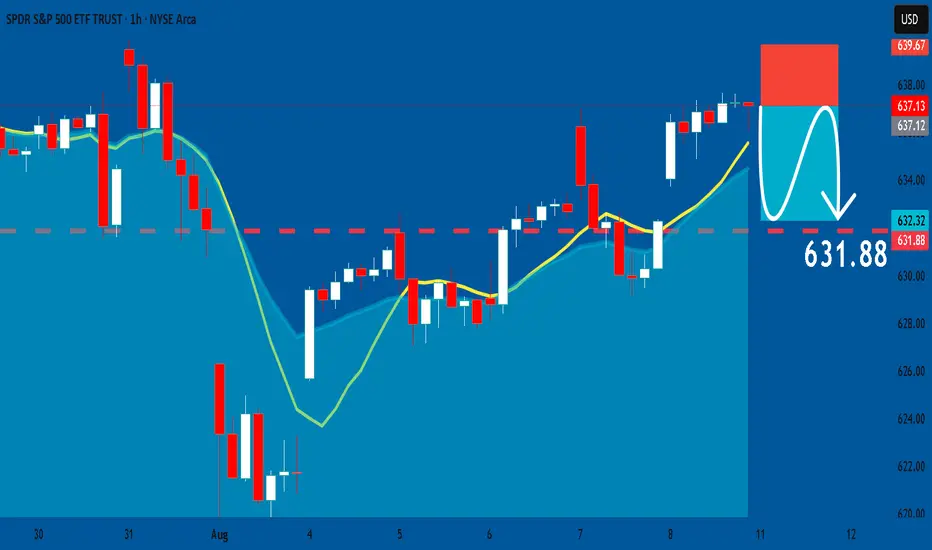
- Classic bearish formation
- Our team expects pullback
SUGGESTED TRADE:
Swing Trade
Short SPY
Entry - 637.13
Sl -639.67
Tp - 631.88
Our Risk - 1%
Start protection of your profits from lower levels
Disclosure: I am part of Trade Nation's Influencer program and receive a monthly fee for using their TradingView charts in my analysis.
❤️ Please, support our work with like & comment! ❤️
SPY | Bullish | Day Trading AMEX:SPY
SPY has confirmed a bullish structural shift on the 1H chart following the August 1st liquidity sweep.
Key Developments:
A Higher Low (HL) was formed after a significant breakdown and volume climax.
Price has since reclaimed the descending trendline and is now trading above all major EMAs.
Momentum continues to build, supported by:
A clean break of the 38.2% Fibonacci retracement (631.37)
Bullish RSI posture with values trending above 50
Volume profile showing absorption on red candles and confirmation on green
Target Levels:
635.26: Prior resistance and key structural target
637.51: Upper liquidity zone and TP2 based on extension geometry
Support & Risk Management:
Primary structural support: 631.00–630.70
Invalidation level: 629.50
As long as price holds above 631, I remain bullish and expect continuation toward the 635–637 range in the next 1–2 sessions. Pullbacks into the 631 zone would present a potential re-entry or add-on opportunity.

My Spy chartMy Spy chart with the same ghost levels.
As you can see, these levels hold up nicely going al the way back to 1999 - Now
Hope ths helps. Have a wonderful Friday and God Bless.

Nightly $SPY / $SPX Scenarios for August 8, 2025🔮 Nightly AMEX:SPY / SP:SPX Scenarios for August 8, 2025 🔮
🌍 Market-Moving News 🌍
🧾 Tariff Shock → Day 2 Positioning
Markets are still digesting the new tariff regime (10%–41% on broad imports) and the proposed 100% levy on imported semiconductors with carve-outs for firms investing in U.S. production. Expect continued dispersion: U.S.-capex-heavy names bid; globally exposed hardware, autos, and consumer electronics face margin risk until rules are clarified.
💬 Policy Signaling Risk
Fed speakers are leaning cautious on growth and inflation pass-through from tariffs; Bostic flagged skepticism that tariff-driven price effects fade quickly. Translation: don’t count on a rapid dovish pivot because of tariffs alone.
⛽ Energy & Positioning Into the Weekend
Oil beta in focus: Baker Hughes U.S. rig count (1:00 pm ET) and CFTC COT (3:30 pm ET) hit this afternoon—both can nudge energy, USD, and risk appetite into the close.
📊 Key Data Releases & Events 📊
📅 Friday, August 8, 2025
10:20 AM ET – St. Louis Fed President Alberto Musalem (remarks)
Market angle: watch for any tariff-inflation commentary and guidance on the path/timing of cuts.
1:00 PM ET – Baker Hughes U.S. Rig Count
Reads on drilling activity; oil services beta and crude sentiment.
3:30 PM ET – CFTC Commitments of Traders (weekly)
Positioning update across futures/FX; risk heading into next week.
(No major Tier-1 U.S. macro prints scheduled today; next CPI is Tuesday, Aug 12.)
Bureau of Labor Statistics
⚠️ Disclaimer:
Educational info only, not financial advice. Do your own research.
📌 #trading #stockmarket #economy #Fed #tariffs #chips #energy #rigcount #COT
2 Way StreetReal Quick:
Price is bouncing off my zone. Which could lead to a bigger push higher to my 2nd tp.
Or it could be a trap, leading into a bearish divergence. That could be bad.
Im still somewhat bullish, but I doalready locked in some profits.
“Disclaimer: The information provided is NOT financial advice. I am not a financial adviser, accountant or the like. This information is purely from my own due diligence and an expression of my thoughts, my opinions based on my personal experiences, and the way I transact.

Spy holding this channel at 20 SMASpy bulls are holding above the 20 SMA. Let’s see if this trend holds!

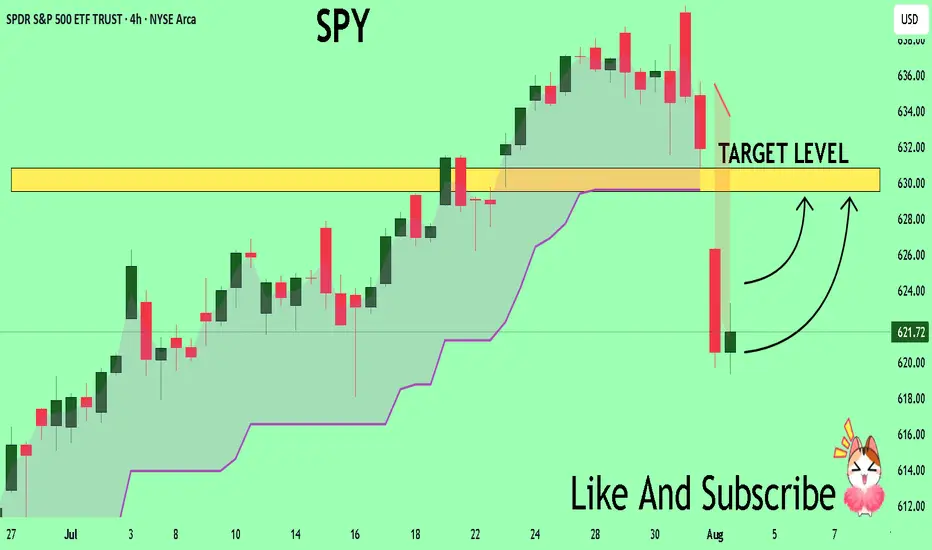
SPY Massive Long! BUY!
My dear subscribers,
My technical analysis for SPY is below:
The price is coiling around a solid key level - 621.72
Bias - Bullish
Technical Indicators: Pivot Points Low anticipates a potential price reversal.
Super trend shows a clear buy, giving a perfect indicators' convergence.
Goal - 629.55
About Used Indicators:
By the very nature of the supertrend indicator, it offers firm support and resistance levels for traders to enter and exit trades. Additionally, it also provides signals for setting stop losses
Disclosure: I am part of Trade Nation's Influencer program and receive a monthly fee for using their TradingView charts in my analysis.
———————————
WISH YOU ALL LUCK
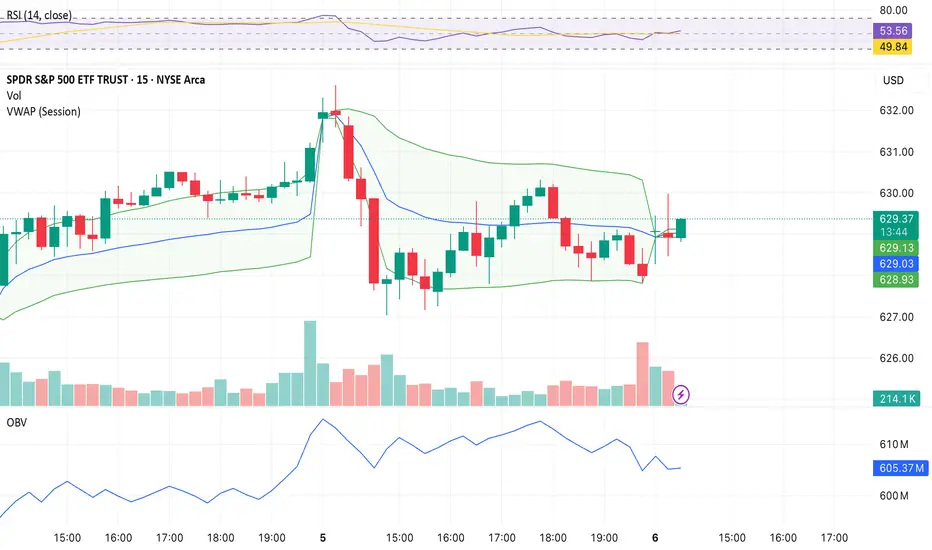
SPY 0DTE Bearish Setup – Max Pain in Play (Aug 7)## ⚠️ SPY 0DTE Bearish Setup – Max Pain in Play (Aug 7)
**Low-Conviction Market = Short-Term Put Opportunity?**
### 🧠 Summary of Consensus:
All major models (Grok, Gemini, Claude, Llama, DeepSeek) flag the **lack of bullish momentum**.
💡 **Key Bearish Signals**:
* 📉 Price below VWAP
* 📊 Weak volume
* 📉 RSI & flow: neutral to bearish
* 🎯 Max pain hovering near current price
---
### 🤖 AI Model Breakdown:
| Model | Bias | Action |
| -------------- | ------------------- | ---------------------------- |
| Grok / Gemini | 🔻 Weak Bearish | No trade (wait for clarity) |
| Claude / Llama | 🔻 Moderate Bearish | Buy PUT at \$630 |
| DeepSeek | ⚖️ Mixed Bearish | Monitor – no high-conviction |
🧭 **Consensus Direction**: **Weak Bearish**
---
### 🔧 Trade Setup (0DTE)
| Metric | Value |
| ---------------- | ------------- |
| 🎯 Instrument | SPY |
| 🔀 Direction | PUT (SHORT) |
| 💵 Entry Price | 0.78 |
| 💣 Strike Price | 630.00 |
| 🛑 Stop Loss | 0.39 |
| 🎯 Profit Target | 1.56 |
| 📅 Expiry | Aug 07 (0DTE) |
| ⏰ Entry Timing | Market Open |
| 📈 Confidence | 60% |
📊 **Risk/Reward**: 1:2
📉 **Time Decay Alert**: Tight stop-loss due to fast 0DTE decay.
---
### ⚠️ Key Watchouts:
* 📈 Reclaiming VWAP = **exit immediately**
* 🔊 Sudden volume spike = momentum shift risk
* 🧯 Keep position size small – this is a **scalp**, not a swing
---
### 🧠 Final Take:
> If SPY stays pinned below VWAP & max pain remains, this **0DTE put could print**. But discipline is everything — tight stop, tight leash. ⚔️
---
🧠 **Follow for daily AI-backed earnings & SPY plays**
📉 **Not financial advice – manage risk like a pro**

Nightly $SPY / $SPX Scenarios for August 7, 2025🔮 Nightly AMEX:SPY / SP:SPX Scenarios for August 7, 2025 🔮
🌍 Market‑Moving News 🌍
📦 Major Tariffs Implemented Today
Sweeping tariffs ranging from 10% to over 40% officially took effect today on imports from numerous countries, significantly escalating global trade tensions. Markets are closely tracking initial reactions across affected sectors, especially pharmaceuticals and semiconductors.
💻 Semiconductor Tariff Shakes Tech Sector
President Trump introduced a substantial 100% tariff on semiconductor imports, with notable exemptions for U.S. investors such as Apple, Nvidia, and AMD. Apple shares surged 5.1% amid investor optimism, while broader tech stocks saw mixed reactions.
🚀 Firefly Aerospace IPO Debut
Firefly Aerospace launched its IPO today, pricing shares at $45. The stock began trading on Nasdaq under ticker "FLY," attracting significant attention due to its positioning in the space and defense technology sector.
📊 Key Data Releases & Events 📊
📅 Thursday, August 7, 2025:
8:30 AM ET – Initial Jobless Claims (week ending Aug 2)
Forecast: 221,000
Previous: 218,000
8:30 AM ET – U.S. Productivity (Q2)
Forecast: 1.9%
Previous: –1.5%
8:30 AM ET – U.S. Unit Labor Costs (Q2)
Forecast: 1.3%
Previous: 6.6%
10:00 AM ET – Wholesale Inventories (June)
Forecast: N/A
Previous: –0.3%
10:00 AM ET – Speech by Atlanta Fed President Raphael Bostic
Topic: Monetary policy outlook; market-sensitive for potential Fed signals.
3:00 PM ET – Consumer Credit (June)
Forecast: N/A
Previous: $5.1B
⚠️ Disclaimer:
This content is for educational and informational use only and is not financial advice. Always consult a licensed financial advisor before making investment decisions.
📌 #trading #stockmarket #economy #tech #earnings #IPO #Fed #tariffs #semiconductors
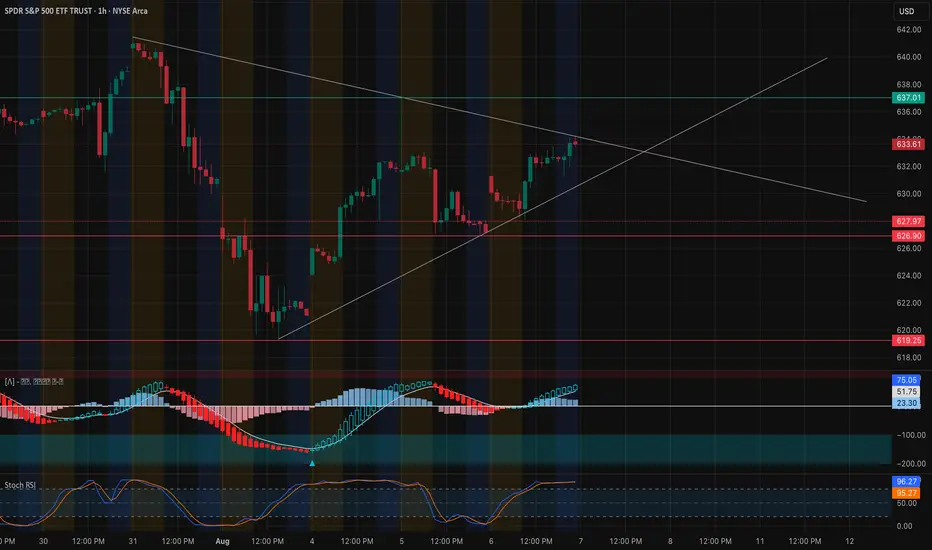
SPY Approaching Apex — Breakout or Trap Ahead? Aug 7SPY Approaching Apex — Breakout or Trap Ahead? 🔥
📊 Technical Analysis (1H Chart)
SPY has reclaimed the rising wedge support trendline and is now grinding just beneath a confluence of resistance near 633.61. This is the third test of this breakout zone, forming a squeeze triangle with lower highs and higher lows.
Key Structure Notes:
* Bullish momentum continues to build on the MACD histogram with rising blue bars and a bullish cross already established.
* Stoch RSI is extremely overbought (96+), which suggests caution — SPY is vulnerable to rejection if buyers lose steam.
* Price action remains orderly and within trendline compression. A breakout above 634 could unleash aggressive buying, while losing 631 opens the door to retest 627–628 demand.
Intraday Levels to Watch:
* 📈 Resistance: 633.61 → 634.20 → 637.00 (key horizontal resistance and fib extension)
* 📉 Support: 631.00 → 628.20 → 626.90 → 619.25
🔍 Options GEX & Dealer Positioning
The GEX board favors bullish continuation — but also hints at gamma traps near the top:
* 🟢 634.00–634.20: 91.11% GEX concentration at 2nd CALL Wall — this is the biggest dealer hedge wall; could act as resistance or gamma squeeze fuel if broken.
* 🟢 637.00: Highest positive net GEX → if SPY pushes above 634 and holds, momentum could carry toward 637.
* 🔴 626.00–625.00: Layered PUT walls and HVL zone provide strong downside cushion.
* 🧭 Net GEX is moderately positive, suggesting dealer flows will slow upside moves unless a sharp squeeze kicks in. Watch IVR (15.3) — low enough to allow scalps but not favorable for selling premium.
🧠 Game Plan & Thoughts
* 🔓 Bullish Scenario: Break and hold above 634 confirms the triangle breakout → target 637–638 next.
* 🛑 Bearish Rejection: Failure at 633.61 or loss of 631 reopens path back to 628.20–626.90 zone.
* 🎯 Suggested Setup: Long scalp above 634 → TP: 637 | SL: 631.
Short setup below 631 → TP: 627 | SL: 634.
Momentum is on the bulls' side for now, but you're buying into a potentially crowded breakout zone. Watch volume and reaction around 634 — breakout or fade will decide next leg.
This analysis is for educational purposes only and does not constitute financial advice. Always manage your risk.
Options Trading for SPY - Bear Spread Oct 17I'm setting up a Bear Put Spread on AMEX:SPY with the following legs:
Buy 630 Put
Sell 620 Put
Expiration: October 18, 2025
Thesis: I'm expecting a bearish move or neutral-to-bearish consolidation over the coming weeks, likely driven by macroeconomic pressure and technical weakness around the 630 level.
Current Price: ~$629.50
Risk/Reward: Defined risk strategy with a maximum loss equal to the net debit paid.
Breakeven Point: $630 – net debit
Max Profit: If SPY closes below $620 at expiration
Max Loss: If SPY closes above $630 at expiration
Technical indicators include:
Price rejection around VWAP
Decreasing OBV during consolidation
RSI divergence suggesting weakening momentum
Watching for further confirmation on breakdown from current levels. Will monitor volume and macro news.
SPY/QQQ Plan Your Trade Update For 8-5This short video is to provide my followers with an update.
I'm still here. I'm still working on projects and new TV code. I have developed a couple of new strategies that I like and that seem to continue to perform.
Overall, I'm still doing my best to deliver superior analysis/results for my followers.
This video covers the SPY/QQQ, Gold/Silver, and BTCUSD (plus extras).
Hope you are all getting some great profits from these moves.
GET SOME.
#trading #research #investing #tradingalgos #tradingsignals #cycles #fibonacci #elliotwave #modelingsystems #stocks #bitcoin #btcusd #cryptos #spy #gold #nq #investing #trading #spytrading #spymarket #tradingmarket #stockmarket #silver

Nightly $SPY / $SPX Scenarios for August 6, 2025🔮 Nightly AMEX:SPY / SP:SPX Scenarios for August 6, 2025 🔮
🌍 Market‑Moving News 🌍
🪙 Citi Lifts Gold Price Forecast Amid Global Uncertainty
Citi raised its short-term gold outlook to $3,500/oz, citing surging safe-haven demand driven by trade instability, softening labor metrics, and heightened geopolitical risk. Risk premiums and volatility remain elevated.
📉 Equities Tumble as Risk Aversion Returns
U.S. stocks slipped on renewed caution—investors rotated into bonds and precious metals following weaker job indicators and escalating trade friction. The dollar and gold strengthened, while equity futures pulled back.
📊 Key Data Releases & Events 📊
📅 Wednesday, August 6:
No major U.S. economic data releases scheduled for today. Markets are closely monitoring corporate earnings reports and commentary from Fed officials, including San Francisco Fed President Mary Daly later in the day.
⚠️ Disclaimer:
This content is for educational and informational purposes only—it is not financial advice. Always consult a licensed financial advisor before making investment decisions.
📌 #trading #stockmarket #economy #trade #currency #gold #earnings
SPY Stuck Below Downtrend Resistance. TA for Aug. 6SPY Stuck Below Downtrend Resistance – Sellers Still Pressing
Market Structure (1H View)
* SPY continues to trade inside a descending channel, with repeated failures near the upper trendline around $641–$644.
* Recent price action shows a lower high rejection followed by consolidation under resistance, signaling a cautious market tone.
* The macro downtrend remains intact unless bulls can break and hold above the descending trendline.
Key Price Levels
* Immediate Resistance: $631 (local reaction high)
* Major Resistance: $641–$644 (trendline + prior supply zone)
* Support Zone: $619–$620 (key demand zone)
* Deeper Support: $603–$605 (previous low and psychological support)
Indicators
* MACD: Recently flipped bearish with red momentum bars increasing — suggests momentum is shifting back toward sellers.
* Stoch RSI: Oversold bounce attempt possible, but currently still near the lower range.
* Trendlines: Price remains capped under the descending resistance line.
Current Bias
SPY is struggling to sustain bullish momentum after the recent push into resistance. Sellers are defending the upper channel, keeping pressure on the downside toward $620.
Scenarios to Watch
🟢 Bullish Case:
* Break & close above $631 with follow-through volume → retest $641–$644.
* Needs strong buying interest to flip the macro trend bias.
🔴 Bearish Case:
* Failure to reclaim $631 + sustained weakness could send price back toward $620 support.
* If $620 breaks, risk increases for a sharper drop toward $603–$605.
Trade Ideas (Not Financial Advice)
* Short Bias: Look for rejection near $631 or the trendline; target $620, then $605 if breakdown accelerates.
* Long Setup: Only if price reclaims $631 convincingly and breaks the $641–$644 resistance zone.
📌 Final Thoughts
SPY remains bearish-biased inside a descending channel. Bulls need a decisive breakout above $641 to change sentiment; otherwise, sellers will continue targeting $620 and potentially lower.

Still undecidedEdged the top and bottom 4hr fibs. In a 4hr fvg. Idk. Anyone have any thoughts on this or nah
