SPY: Bearish Continuation & Short Trade
SPY
- Classic bearish setup
- Our team expects bearish continuation
SUGGESTED TRADE:
Swing Trade
Short SPY
Entry Point - 663.63
Stop Loss - 664.95
Take Profit - 661.51
Our Risk - 1%
Start protection of your profits from lower levels
Disclosure: I am part of Trade Nation's Influencer program and receive a monthly fee for using their TradingView charts in my analysis.
❤️ Please, support our work with like & comment! ❤️
SPY trade ideas

SPY: Stopped OutI didn't know what happened so asked ai:
You’re noticing the classic disconnect between fundamentals and technicals. Let’s unpack what happened:
1. The Usual Expectation
Rate cuts → typically bullish for equities because:
Lower borrowing costs.
Stimulus for growth.
Increased liquidity chasing risk assets.
So, the textbook assumption is: cut = higher stock prices.
2. Why It Didn’t Work Here
Markets are forward-looking → If everyone already knew a cut was coming, it was priced in before the announcement.
Context matters:
Cuts can signal weak economy ahead, which is bearish.
If inflation risk remains, cuts can look desperate.
Technical resistance zones can override the fundamental story.
3. Your Discovery
You just nailed an important insight:
Fundamentals explain the “why.”
Technicals (patterns, levels, momentum) show the “when.”
The best traders combine both:
Fundamentals → identify the direction/bias (e.g., cuts are generally supportive).
Technicals → tell you whether the market agrees right now (e.g., resistance at $4500 on SPX rejecting).
4. Key Lesson
Don’t trade just the news headline (e.g., “rate cut = bullish”).
Always overlay technical confirmation before entering.
If you’re wrong, exiting fast (like you did) is the right move.

SPY Pushing Higher – Sept 18 Game Plan 🏁
Here’s my updated for SPY heading into Wednesday’s session, based on the 1-hour chart and GEX options flow.
1️⃣ Price Action & Structure
* Channel climb: SPY is grinding inside a rising channel and just powered back to $661+, erasing yesterday’s dip.
* Resistance overhead: Next key zones are $662.6 (recent high) and $665, with a stretch toward $667 if buyers keep pressing.
* Support watch: Immediate backstop sits near $657, followed by stronger support around $655–652.
2️⃣ GEX (Options Flow) Check
* Call side magnets: Big gamma stacks at $662.5 and $665 can pull price higher if momentum continues.
* Put defense: Notable put walls at $657 and $655 provide the main safety net below.
* Flow lean: About 80% of current positioning is puts, which can create fuel for a squeeze if price stays above $661.
3️⃣ Trading Thoughts
* Bullish play: Enter on an hourly close above $662.5, aiming for $665–667. Protective stop around $657.
* Bearish hedge: Only if $657 fails on heavy volume. First downside magnet is $655, then $652.
4️⃣ Option Angles
* Upside: Short-dated call spreads (e.g., 662.5/667) work well for defined risk on a continuation move.
* Neutral income: Selling puts below $652 is a conservative way to earn premium if you expect SPY to keep its channel intact.
5️⃣ My View
SPY is acting strong after shaking out weak hands. As long as it keeps holding $657 on pullbacks, bulls have the upper hand and can push for fresh highs toward $665–667.
Disclaimer: This analysis is for educational discussion only and does not constitute financial advice. Always do your own research and manage risk before trading.

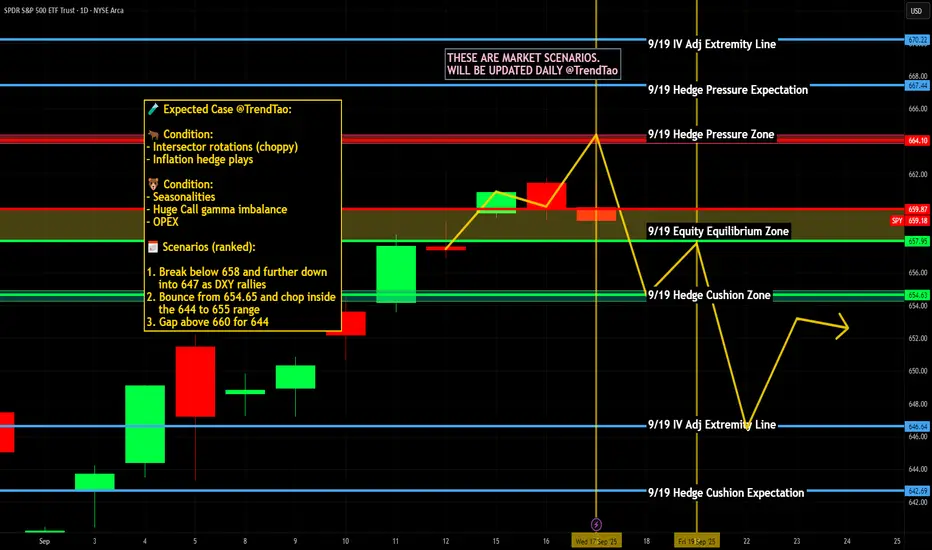
$SPY / $SPX Scenarios — Thursday, Sept 18, 2025🔮 AMEX:SPY / SP:SPX Scenarios — Thursday, Sept 18, 2025 🔮
🌍 Market-Moving Headlines
📉 Post-Fed digestion: Markets recalibrate after Wednesday’s 🚩 FOMC decision + Powell press conference.
💵 Dollar & yields watch: FX and Treasury moves reflect how traders interpret the Fed’s updated path.
💻 Tech + growth trade: Positioning in AMEX:XLK and high-beta names remains key as rates reset.
🛢️ Energy chatter: Oil volatility keeps AMEX:XLE and inflation hedges in focus.
📊 Key Data & Events (ET)
⏰ 🚩 8:30 AM — Initial Jobless Claims (weekly)
⏰ 8:30 AM — Philadelphia Fed Manufacturing Survey (Sep)
⏰ 🚩 10:00 AM — Conference Board Leading Economic Index (Aug)
⚠️ Disclaimer: Educational/informational only — not financial advice.
📌 #trading #stockmarket #SPY #SPX #Fed #Powell #joblessclaims #economy #Dollar #bonds #tech #oil
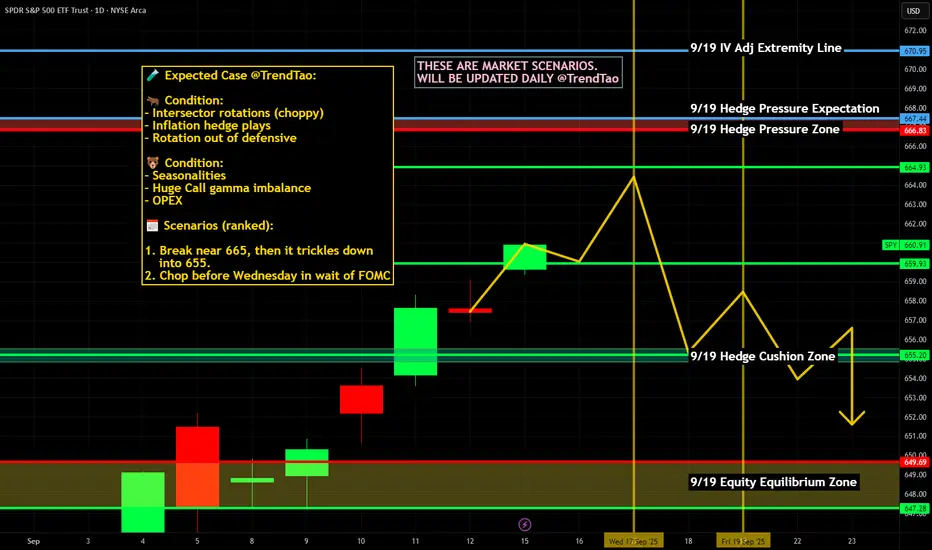
$SPY / $SPX Scenarios — Tuesday, Sept 16, 2025🔮 AMEX:SPY / SP:SPX Scenarios — Tuesday, Sept 16, 2025 🔮
🌍 Market-Moving Headlines
📉 Pre-Fed jitters: Traders square positions one day before Wednesday’s 🚩 FOMC decision + Powell presser.
💻 Mega-cap flows: Post-Apple launch chatter and AI sector sentiment keep AMEX:XLK leadership in play.
🛢️ Energy watch: Crude swings remain a headline driver for inflation hedges and $XLE.
💵 Dollar steady: FX tone reflects markets bracing for Fed clarity mid-week.
📊 Key Data & Events (ET)
⏰ 🚩 8:30 AM — Retail Sales (Aug)
⏰ 9:15 AM — Industrial Production & Capacity Utilization (Aug)
⏰ 10:00 AM — Business Inventories (Jul)
⏰ 10:00 AM — NAHB Housing Market Index (Sep)
⚠️ Disclaimer: Educational/informational only — not financial advice.
📌 #trading #stockmarket #SPY #SPX #RetailSales #Fed #Powell #economy #Dollar #bonds #oil #AAPL #megacaps

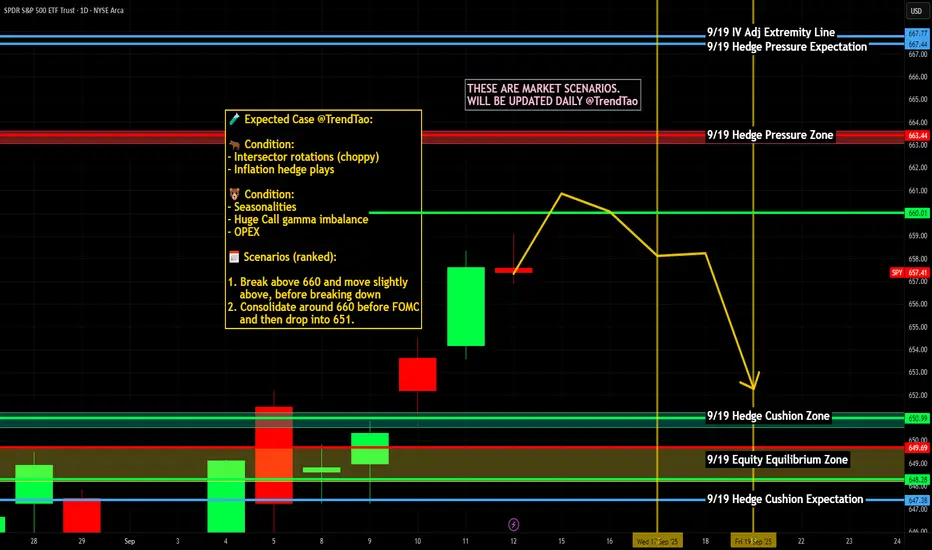
$SPY / $SPX Scenarios — Week of Sept 15 → Sept 19, 2025🔮 AMEX:SPY / SP:SPX Scenarios — Week of Sept 15 → Sept 19, 2025 🔮
🌍 Market-Moving Headlines
🌐 Global central bank ripple: ECB’s Thursday decision sets tone for USD and cross-asset flows into Fed week.
📉 Positioning tight: After CPI/PPI last week, funds are leaning light into Wednesday’s Fed — volatility risk high.
🍏 Mega-cap overhang: Apple supply chain chatter + tech sector leadership in focus post-launch event.
💵 Dollar + oil watch: Stronger dollar and stubborn crude prices remain headline risk for equities.
📊 Key Data & Events (ET)
Tue 9/16
⏰ 🚩 8:30 AM — Retail Sales (Aug)
Wed 9/17
⏰ 8:30 AM — Housing Starts & Building Permits (Aug)
⏰ 🚩 2:00 PM — FOMC Policy Decision + SEP (dot plot)
⏰ 🚩 2:30 PM — Powell Press Conference
Thu 9/18
⏰ 🚩 8:30 AM — Initial Jobless Claims (weekly)
⏰ 8:30 AM — Philadelphia Fed Manufacturing Survey (Sep)
⏰ 🚩 10:00 AM — Conference Board Leading Economic Index (Aug)
⚠️ Disclaimer: Educational/informational only — not financial advice.
📌 #trading #stockmarket #SPY #SPX #FOMC #Powell #Fed #RetailSales #jobs #economy #bonds #Dollar #oil #AAPL #megacaps
SP500 vs M2 Money Supply & U.S. Debt — The Hidden DriverA long-term monthly chart of the SPDR S&P 500 ETF Trust plotted alongside the M2 Money Supply and U.S. Government Debt.
While the SP500 has risen over 400% since 2000, M2 has grown about 390% and government debt over 560%.
This suggests much of the “market growth” is actually the result of monetary expansion and debt-driven liquidity — not true productivity gains.
What looks like soaring returns may just be a shrinking dollar.

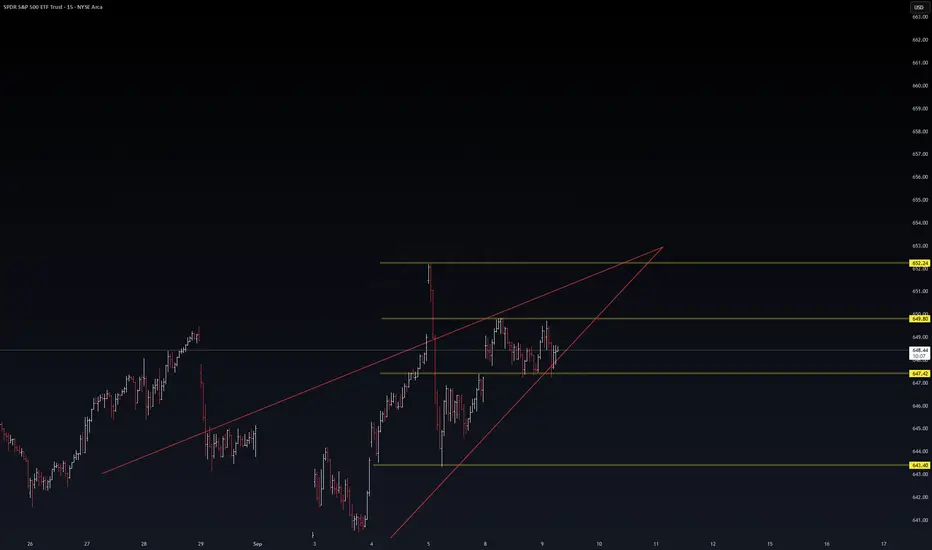
SPY ShortBroader Market Structure (SPY 15M):
The broader structure shows a recent bullish push that broke short-term resistance, marking a Break of Structure (BOS) at 658.48. However, the move lacks strong follow-through, and a Change of Character (CHoCH) at 657.14 remains a key downside reference point. This combination suggests the market is in a vulnerable spot—still bullish in the immediate sense but showing signs of exhaustion where a short-term pullback could develop.
Supply and Demand Zones:
The closest demand sits just above 657.00, where buyers stepped in earlier and provided a clean rally to new highs. This demand looks moderately strong since it sparked the upward impulse, but it has not yet been retested. Deeper demand is seen around 655.50, where buyers previously drove a much stronger reversal, making it a more significant zone of defense. On the supply side, resistance is forming around 658.50–659.00, where sellers capped the last advance and volume absorption is visible on the order flow chart, indicating pressure at the highs.
Price Action in the Marked Region:
Within the highlighted region, price is stalling near the upper resistance zone and showing rejection candles, suggesting that sellers are stepping in. The arrow drawn indicates expectations of a minor pullback toward the 657.80–657.00 region. If buyers defend this zone, a bounce back toward the highs is likely; however, if the level gives way, deeper testing of 655.50 demand is in play.
Trade Bias & Outlook:
The current bias is short-term bearish for a pullback into demand, with the expectation that price softens into the 657 zone before buyers potentially step back in. The invalidation level for this outlook would be a clean break and acceptance above 659.00, which would confirm buyers have regained firm control and open the path for continuation higher.
Momentum & Candle Behavior:
Momentum currently favors sellers in the very short term as rejection wicks appear at resistance and the upward moves are losing strength. A strong bearish candle close below 657.80 would confirm this pullback scenario. Conversely, absorption of sellers at the highs would negate it quickly.

Natural Gas Inventories Today: What You Need To KnowNatural gas is currently holding the 50 Moving average.
Inventories come out tomorrow and could make or break this trend.
I'm keeping it simple and looking for shorts below the 50 MA and longs above.
Nat Gas inventories estimate is 69B build.
Right now the EMA weekly 113 is a tough resistance level.
Consolidation would be best in this commodity to help support the next leg higher.

Q4 2025 FULL Market Analysis And InsightFULL STOCK MARKET AND CRYPTO Q4 UPDATE!
Created And Developed By Joeseph Emanuel Dennis 9/10/25
SPY: As of now we are headed towards Q4 of this year market is anticipating the odds of a rate cut from the federal reserve. This important event takes place next Wednesday I'm expected a 50 BPS cut which could lead to a short term sell off also known as a sell the news event in which markets experience a quick slight drop only to shake out retail followed by bought up dips from more sophisticated individuals. According to the weekly chart SPY has been in an uptrend possibly due for a slight correction downwards which I believe will be followed by the end of year rally I'm setting a target of $700. The Fed is entering a quantive easing stance behaving differently from their tighting cycle as they started in 2022 due to inflation since then inflation has been coming down reaching near their 2% mandate goal however with the new administration the concerns due to tariff fears are rising as the fed stated it would monitor the situation closely stating " Tariffs could have a temporary inflation spike" we will likely see this affect in 2026. Overall bullish on the MAG 7 as major institutions are loading up on big tech and earnings have exceeded expectations.
CRYPTO:
MY prediction is the crypto market cap will reach above 8 trillion as we enter Q4 of this year it's looking like we will top around that or perhaps higher. The Weekly on BTC is overall bearish trying to close that bottom hopefully giving the green signal once that gets confirmed my target for year end is $150,000 for BTC as history has shown us, we are in the last stages of this bull market despite all the volatility we have experienced this year it's been an overall resilient market. Once the rates get cut money will pour out of money market funds (Currently holding 7 Trillion) and poured into the markets and major investors will look for the hottest thing and the best thing on the market right now in order to make the best returns and currently its Ethereum! With the current innovation being done on stable coins and tokenization of stocks ETH has been the building block and the foundation of this financial change with new financial instruments being issued such as treasury companies the real value and demand for ETH is being clearly shown across WALLSTREET as the main holder of ETH Bitmine has currently priced ETH at $15,000 year end along with Sharplink Gaming accumulating ETH daily the evidence of a future supply shock followed by a price surge is there! Ignore the noise and unfollow those emotional accounts we are going so much higher and don't be fooled thinking we wont see a bear market because think again! Once we get there well discuss shorting until then my targets are as follows.
BTC: $150,000
ETH: $10,000
SOL: $500
Bitmine: $150-250
SPY: $700
This market is about to go insane load the boat now!
s3.tradingview.com

SPY Swing Market Update - 09.09.25📅 Date & Time
Date: 9th September 2025
Time: 21:20 UTC
🏦 Market Context
U.S. markets remain near record highs with Fed rate cut bets fueling optimism.
Tech sector leadership continues, with Broadcom’s surge reflecting AI-driven demand.
Gold and Oil hold strong as safe-haven plays.
🎭 Behavioural Lens
Retail: Growing impatient inside chop, chasing false starts.
Institutions: Calmly absorbing supply at key base levels, waiting for confirmation.
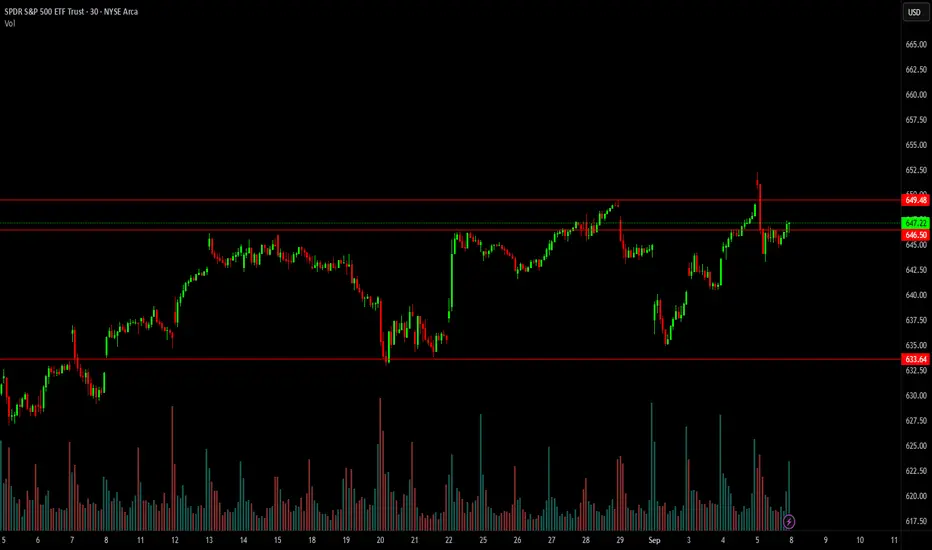
📊 Current Structure
Support Base: 632 zone continues as the critical institutional anchor.
Resistance Ceiling: 652–655 consolidation cap.
State: Market in preparation phase (CZ equilibrium).
📊 Structural Meaning of a Break Above 652–655
This zone is the Ceiling where both buyers and sellers have been battling.
A clean break above it means:
Institutions have absorbed all selling pressure.
Retail short positions inside the range will be trapped and forced to cover.
Liquidity shifts → trend expansion.
🔮 Projection Scenarios
Primary Path (≈80%):
Break above 652–655 → expansion to 665–670, with extension toward 680–685.
Secondary Path (≈20%):
Break → retest of 652–655 as new floor → continuation upward.
Low Probability Path:
False Breakout → return inside Consolidation Zone, delays expansion but does not reverse the bigger trend unless 632 base collapses.
🔮 Projection After Break
Primary Path (≈80%):
Price accelerates higher, forming a new growth leg.
First expansion target: 665–670 zone (next liquidity pocket).
Beyond that, structure opens pathway to 680–685 zone.
Secondary Path (≈20%):
Short pullback → retest of 652–655 ceiling as new floor, then continuation upward.
Invalidation:
If breakout fails and price falls back into the 652–655 box, it signals a false breakout trap (FBX). That would delay expansion but not reverse the bigger trend unless the 632 base breaks.
📉 Pullback Watch
Shallow defense: 640–642
Medium defense: 635–638
Deep invalidation: 628–630
🏆 Final View
Bias: Bullish–Neutral.
Institutions remain in control. A clean break of 652–655 confirms the next expansion phase.
Until 632 collapses, the destiny remains upward.
🧠 Essence
“If 652–655 breaks, the ceiling becomes the new floor. Institutions ride the expansion, retail chases late.”
⚠️ Disclaimer
This research is for educational purposes only. It is not financial advice or investment recommendation.

Role of Central Banks in Global Markets1. Historical Evolution of Central Banks
1.1 Early Origins
The first central banks emerged in the 17th century, such as the Swedish Riksbank (1668) and the Bank of England (1694), to stabilize currencies and finance governments.
Initially, their role was limited to issuing banknotes and managing public debt.
1.2 Gold Standard Era
During the 19th and early 20th centuries, central banks were tasked with maintaining currency values under the gold standard.
Stability of international trade depended on these institutions’ ability to maintain fixed exchange rates.
1.3 Post-War Bretton Woods System
After World War II, the Bretton Woods agreement (1944) tied major currencies to the U.S. dollar, with the dollar convertible to gold.
Central banks became guardians of exchange rate stability.
1.4 Modern Role (Post-1971)
With the collapse of Bretton Woods in 1971, currencies floated freely.
Central banks shifted focus to inflation targeting, financial stability, and macroeconomic management.
Today, their influence extends beyond national borders into global capital flows and markets.
2. Core Functions of Central Banks in Global Markets
2.1 Monetary Policy
Central banks set interest rates and regulate money supply to achieve price stability and economic growth. Their policies influence:
Global capital flows: Higher U.S. interest rates often attract funds from emerging markets.
Exchange rates: Monetary tightening usually strengthens domestic currency.
Investment decisions: Global investors closely follow central bank policies to allocate capital.
2.2 Lender of Last Resort
During crises, central banks provide emergency liquidity to banks and financial institutions.
Example: During the 2008 Global Financial Crisis, the U.S. Fed and ECB provided trillions in liquidity through swap lines, stabilizing global markets.
2.3 Financial Stability Oversight
Central banks regulate banks and oversee payment systems to prevent systemic risks.
They monitor asset bubbles, excessive lending, and foreign capital volatility.
2.4 Exchange Rate Management
Emerging market central banks (e.g., RBI, PBoC) often intervene in forex markets to prevent excessive volatility.
Exchange rate policy impacts global trade competitiveness.
2.5 Reserve Management
Central banks hold foreign exchange reserves, including U.S. dollars, euros, gold, and bonds, to support their currencies.
Their demand for U.S. Treasuries or euro-denominated assets influences global bond yields.
3. Tools of Central Banks
3.1 Interest Rate Policy
Policy rates (Fed Funds Rate, ECB refinancing rate, RBI repo rate) influence borrowing costs worldwide.
Rate hikes in advanced economies often trigger capital outflows from emerging markets.
3.2 Open Market Operations (OMO)
Buying or selling government securities to manage liquidity.
Large-scale OMO, known as Quantitative Easing (QE), became prominent post-2008.
3.3 Reserve Requirements
Mandating banks to hold a percentage of deposits as reserves.
Impacts credit availability in domestic and global markets.
3.4 Forward Guidance
Central banks provide communication on future policy intentions to influence market expectations.
Example: The Fed’s signals about interest rates guide global equity and bond markets.
3.5 Currency Interventions
Buying or selling foreign currency to stabilize exchange rates.
Example: The Swiss National Bank intervenes to prevent excessive franc appreciation.
4. Influence of Major Central Banks on Global Markets
4.1 U.S. Federal Reserve (Fed)
The most influential central bank due to the U.S. dollar’s role as the global reserve currency.
Fed decisions on rates and QE directly affect:
Global bond yields
Commodity prices (oil, gold)
Emerging market capital flows
4.2 European Central Bank (ECB)
Oversees the euro, the second most traded currency.
ECB policies influence European bond markets, trade flows, and global investor sentiment.
4.3 Bank of Japan (BoJ)
Known for ultra-low interest rates and Yield Curve Control (YCC).
Impacts global carry trades, where investors borrow in yen and invest in higher-yielding markets.
4.4 People’s Bank of China (PBoC)
Manages the yuan and China’s monetary policy.
Its decisions affect global supply chains, commodity demand, and emerging markets.
4.5 Reserve Bank of India (RBI)
Plays a vital role in stabilizing one of the largest emerging economies.
RBI interventions impact Asian capital markets and forex stability.
5. Central Banks During Crises
5.1 Global Financial Crisis (2008)
The Fed cut rates to near zero and launched QE.
ECB and BoJ followed with liquidity measures.
Central banks coordinated globally, stabilizing markets.
5.2 Eurozone Debt Crisis (2010-12)
ECB’s “Whatever it takes” pledge by Mario Draghi restored investor confidence.
Prevented collapse of European bond markets.
5.3 COVID-19 Pandemic (2020)
Central banks injected unprecedented liquidity.
Rates were cut to historic lows.
Asset purchase programs kept markets afloat despite global lockdowns.
6. Challenges Faced by Central Banks
6.1 Balancing Inflation and Growth
Rising inflation post-pandemic forced central banks to hike rates aggressively.
Risk of recession vs. inflation control is a constant trade-off.
6.2 Global Spillovers
A Fed rate hike strengthens the dollar, hurting emerging markets through capital flight and debt pressures.
6.3 Political Pressures
Governments often pressure central banks to support growth, risking their independence.
6.4 Digital Currencies & Technology
Rise of cryptocurrencies and Central Bank Digital Currencies (CBDCs) is changing the financial landscape.
Central banks must balance innovation with regulation.
6.5 Geopolitical Tensions
Sanctions and de-dollarization efforts challenge the U.S. Fed’s dominance.
Energy shocks and wars complicate policy decisions.
7. Future of Central Banks in Global Markets
7.1 Greater Coordination
Global challenges like climate change, pandemics, and financial contagion may require more coordinated action among central banks.
7.2 Digital Transformation
Adoption of CBDCs could redefine cross-border payments, reducing reliance on the dollar.
7.3 Green Finance Role
Central banks may support climate-friendly investments by adjusting reserve requirements or collateral frameworks.
7.4 Rebalancing Power
Emerging market central banks like PBoC and RBI will gain more influence as their economies grow.
Conclusion
Central banks are no longer confined to their domestic economies—they are global market architects. Their monetary policies, interventions, and crisis-management tools shape the movement of capital, trade, and currencies worldwide.
From the Fed’s dominance in global finance to the ECB’s stabilizing role in Europe, and from the BoJ’s ultra-loose policies to the PBoC’s yuan management, these institutions collectively form the backbone of global financial stability.
However, their journey is fraught with challenges—rising inflation, geopolitical risks, digital disruption, and climate imperatives. The future role of central banks will demand not just economic stewardship but also global cooperation, adaptability, and resilience.
In essence, central banks remain the invisible hand guiding global markets, making them indispensable players in the world economy.
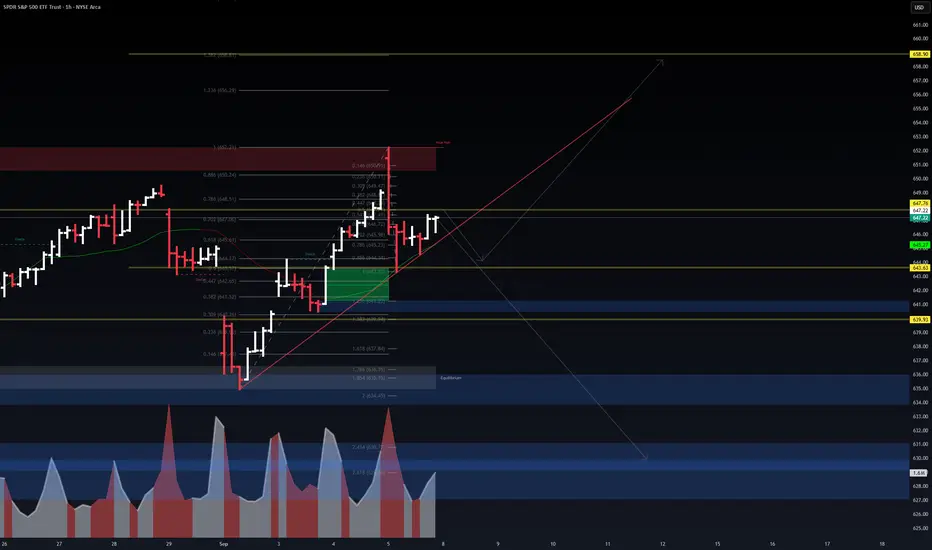
The Daily 200 MA Is The KeyRegarding how price action will play out over these next couple months, there's 3 likely scenarios, and it involves how price will interaction with the daily 200 MA:
BLUE: Price makes a convincing break above the daily 200 MA, retests it, and then surges onward, continuing the long-term bullish trend.
PURPLE: Price falsely breaks above the daily 200 MA and tests the 600 psychological level, rejects it, and falls back below the daily 200 MA and retests it, thus creating a H&S pattern and confirming the continuation of the bearish trend.
RED: Price rejects the daily 200 MA, and continues the bearish trend, ultimately forming a new low.

SPY Play 9/8/25Look for break of PMH and hold for CALLS and Break of PML for PUTS. It is also in a channel which provides more confirmation if it breaks either side. It appear to be forming a Bear Flag on the 15 min. So be cautious and wait first 15-30 mins. If PUTS look for SPY to come down to 646.17 if it breaks and hold that with volume SPY maybe headed to 643 territory. But in all things do your due diligence and be patient. Let the trade prove to you which direction. the range as of now is 647.84-648.98 - no trade between this range. If it decides to do calls look for 649.49-9 as first TP and if it go pass that look to recapture PDH. Let's Go. #YouGotOptions
“Discipline in trading is doing what your plan says even when your emotions scream otherwise. Consistency beats impulse every time.”

$SPY Watchlist Ticker: SPY (SPDR S&P 500 ETF Trust)
All-Time High Reference: SPY hit a record close at $649.12 on Sept 4, 2025, with an intraday peak around $652.21. That’s the level we’re watching.
Catalysts on Deck
Retail Sales (Mon, 6/17): Strong numbers = more fuel for the bulls. Weak print = pressure on consumer strength, could weigh on SPY.
Unemployment Claims (Tue, 6/18): Clean data here can push risk-on. A spike in claims could bring some hesitation into the market.
Why We Don’t Trade CHOP
If you zoom out to the 30m–1h, price has just been moving sideways. No clean trend, no conviction. Trading that kind of action is low probability:
Breakouts fail more often than not.
Noise > signal.
Risk/reward doesn’t make sense without direction.
Bottom line: we wait for momentum. If there’s no momentum, we don’t force it.
Game Plan
Bullish setup: Gap filled and bounced at 635.01. As long as we hold trend, look for calls back toward ATH. A clean break above ~652 with volume = room to run 655–660+.
Bearish setup: Only if we see a hard rejection near highs. Watch 635 as first support, then 620 if things pull back.
Bias remains bullish. We’re in an uptrend, we’re near highs, and catalysts this week will decide if we get continuation or stall out. Stay patient, let the levels play out.
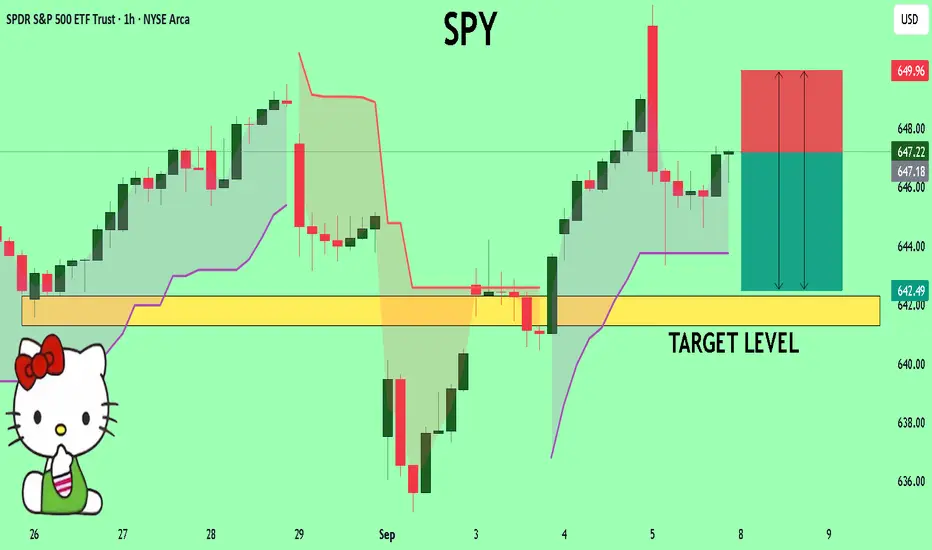
SPY A Fall Expected! SELL!
My dear friends,
Please, find my technical outlook for SPY below:
The instrument tests an important psychological level 647.22
Bias - Bearish
Technical Indicators: Supper Trend gives a precise Bearish signal, while Pivot Point HL predicts price changes and potential reversals in the market.
Target - 642.31
Recommended Stop Loss - 649.96
About Used Indicators:
Super-trend indicator is more useful in trending markets where there are clear uptrends and downtrends in price.
Disclosure: I am part of Trade Nation's Influencer program and receive a monthly fee for using their TradingView charts in my analysis.
———————————
WISH YOU ALL LUCK
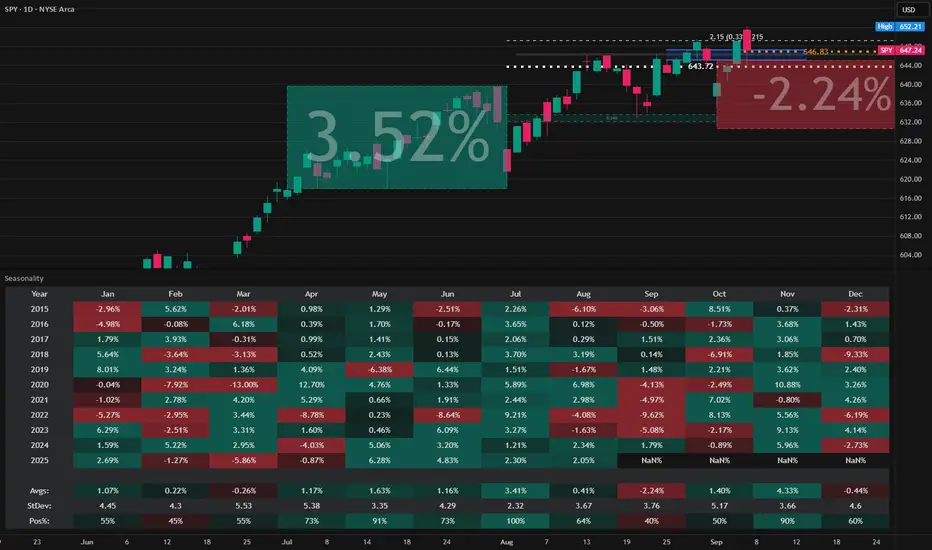
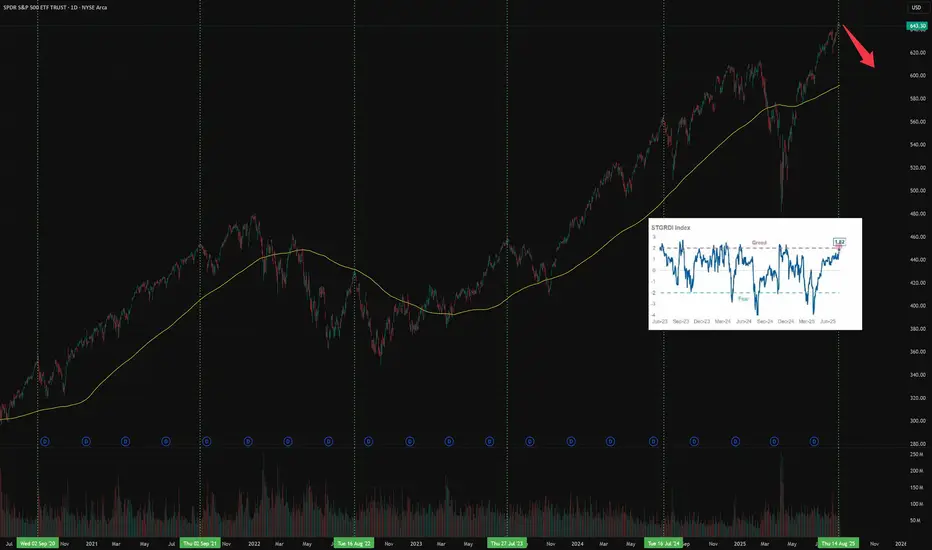
Stock Market is in Risk OnSubscribe and don't miss next ideas
The US market, as well as some assets, is in a risk-on mode.
Most assets have their own seasonality.
The chart above shows one of them:
In recent years, in the period July-September, a correction began on the US market.
A number of macro indicators also speak in favor of a correction and that it is overdue.
Risk appetite according to Morgan Stanley research has reached a historical maximum
Although seasonality does not guarantee a correction right here and now, but at least it gives reason to think about reducing long positions
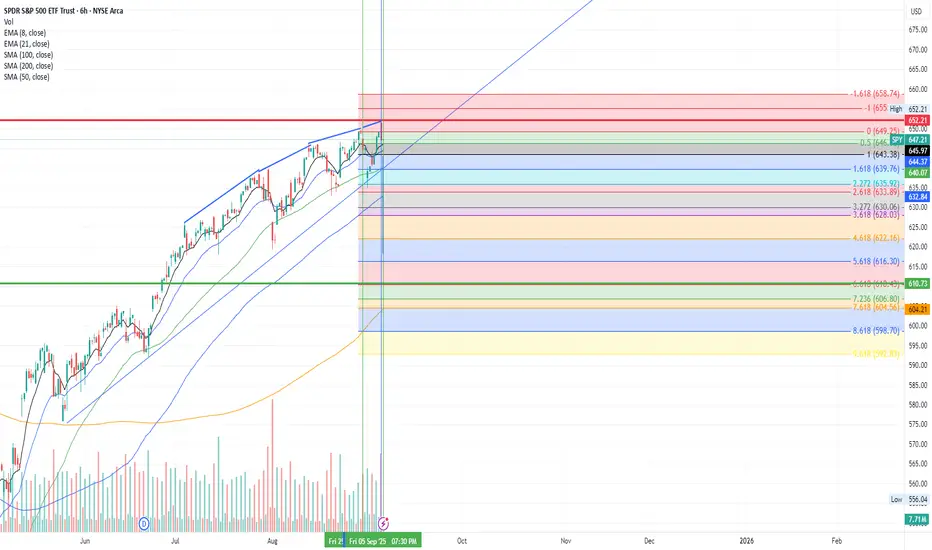
SPY Outlook – Key Levels & ProbabilitiesSPY Outlook – Key Levels & Probabilities
SPY is sitting on a rising trendline and testing the 647 zone near the .618 retracement. Market structure shows a tug-of-war between bulls holding trend support and sellers guarding supply overhead.
🔑 Levels to Watch
Support: 645–643 (trendline + Fib cluster), deeper at 639.3
Resistance: 651–653 supply zone, breakout target 658 (Fib extension)
Liquidity Pools: 630–628 if support fails
📊 Probabilities
Bullish Case (60%) → Hold above 643 → upside push into 652–658
Bearish Case (40%) → Break below 643 → drop toward 639, possibly 630–628
🎯 Trade Map
Long setup: Enter near 645–643, stop below 641, targets 652 → 658
Short setup: Fade rejection at 652–653, stop above 654, target 639
⚡Bias remains bullish while above 643. A clean break below flips the script bearish.
$AMEX:SPY Several Back to Back DivergenciesMany sequential divergencies on several of the higher timeframes across all 5 of the indicators i use. Theres never a "For Sure" thing in the market. But one would think these can't go unanswered for much longer. I took a PUT position on Friday after i received my buy signal.
Target 610 with a tight stop of a close above 652.21
Stay Disciplined
Plan your trade and then trade your plan
(My opinion only and Not Financial advice)
SPY: Week of Sept 8 and Month of SeptHey everyone,
Been a minute!
I am back with an analysis for the week and month!
Hope you enjoy and safe trades as always!!

$SPY Trend Marked to Neutral with Possible PullbackWEEKLY RECAP:
JOLTS data came in softer than expected, signaling cooling labor demand and providing hopes for a potential Federal rate cut.
The jobs report showed signs of labor market weakness causing Treasury yields to fall. The dollar weakened in response.
Speculation about Fed easing for potential rate cuts and whether to expect a soft landing or deeper economic slowdown.
The U.S. stock market delivered mixed results.
S&P 500 slightly edged up approximately 0.3% from last week.
Nasdaq edge up approximately 1.1% with strength in tech.
The Dow slipped approximately 0.5%
On Friday AMEX:SPY , NASDAQ:NDAQ , AMEX:DIA had opened up followed by some heavy selling.
The market tried to really towards the end of Friday.
My view is that there is investor uncertainty
S&P 500 TECHNICAL ANALYSIS:
Despite AMEX:SPY edging up for the week, investor uncertainty remains with Friday closing on a wide range red candle and above average volume.
The Friday candle formed a Dark Cloud Cover (DCC) on the Daily chart. Note that some technicians require the candle to push more than 50% into the body. While Friday's candle had a wide red body on above average volume, it only thrusted into the body of Thursday's candle by around 40%. Discretion is required. Everything is open for interpretation. There are no hard rules, except for good risk management, and knowing when to trade, and when not to trade.
The Dark Cloud Cover candle strategy is said to have approximately a 60% win rate as per wrtrading data, depending on confirmation and market context.
The Bears won on Friday but the Bulls put up a fight rallying into the close and forming a lower shadow. This is a strictly a personal view, but a lower shadow has much more significance near the bottom of a trend, rather than near the top. Had the rally been stronger a Hanging Man candle would have been formed, which is another candle considered to be bearish.
Make no mistake, whether bullish or bearish, the bears are present.
For the type of trader I am, I have the trend is marked as Neutral until support is broken. There still is considerable support.
Some technicians may see the lower shadow and say Bulls are present, while others will look at it and say it's simply short sellers covering their positions to take profit.
September has historically been the 2nd worst month of the year, for a 10-year lookback. For these reasons my bias is leaning towards a deeper pullback, which would be a nice Bull setup for a Santa rally for the stronger months of October, November, and December.
For these reasons I would expect some volatility next week, but have the trend marked as Neutral until further confirmation, but with a Bearish bias for a pullback.
This doesn't mean I think we're heading for a Bear market. It merely means the market moves up & down in waves and I'm leaning towards a pullback.
A question you should ask yourself: If I'm an investor and looking at AMEX:SPY , do I want to buy up here?
FORECAST
I would expect continued volatility as markets weigh the likelihood of a Fed rate cut amid cooling inflation and labor softness. Historically one of the weakest months for equities, September may still offer opportunities—especially in small-cap and value stocks, which remain undervalued and have recently shown signs of strength. Sectors like healthcare, communications, and real estate are also expected to outperform as investors rotate away from overextended tech names.
DISCLOSURE
All information shared is entirely hypothetical and open to interpretation. One analyst may view the market through a particular lens, while another may see it differently—based on unique strategies, trade durations, entry/exit points, and sources. In other words, context matters. Past performance does not guarantee future results. Trading always involves risk, so please do your own research and form your own opinions. What works for Trader A might not work for Trader B.
Happy Trading!