Tesla Stock Wobbles as Profit Dives 37%, Revenue Pops. Now What?Tesla NASDAQ:TSLA posted a 12% jump in revenue on Wednesday, reaching $28.1 billion, well above Wall Street’s $26.37 billion estimate. And yet, the stock slipped nearly 1% on the day before paring back that loss with a 2.3% Thursday gain.
Why? Because profits fell faster than Cybertruck’s reputation — a 37% plunge year over year, with adjusted earnings per share at 50 cents versus the expected 54 cents.
It’s a classic Tesla paradox: sales are booming, but margins are thinning, and Wall Street can’t decide whether to cheer the top line or cry over the bottom one.
🏎️ The Cost of Staying in the Fast Lane
Tesla’s secret sauce has always been scale — crank out more cars, dominate market share, and let profits follow. But this quarter, the recipe’s a bit off. Automotive revenue rose 6% to $21.2 billion, yet net income plunged to $1.37 billion from $2.17 billion a year earlier .
What happened? Price cuts. Lots of them. Musk has been slashing sticker prices across markets to stay ahead in the EV race — great for consumers, painful for margins. Add a 50% spike in operating expenses (thanks, humanoid robots and AI labs), and suddenly that sleek electric machine looks a lot less money-making.
Still, Tesla’s revenue growth means one thing: demand isn’t dead. The EV slowdown hasn’t reached Palo Alto yet.
💰 Bitcoin Bounces
In a crypto-centric subplot, the company made $62 million from its Bitcoin BITSTAMP:BTCUSD stash last quarter.
The crypto’s 5% rise — ending the quarter around $114,000 — gave Tesla’s treasury a nice digital cushion. The company held roughly 11,000 Bitcoins during the three months through September.
🧠 The $1 Trillion Question
And then there’s the other storyline — the Elon Musk Show. Musk wrapped up the earnings call by pivoting from profits to power. Specifically, his proposed $1 trillion pay package , which he insists isn’t “compensation” at all but a question of “control.”
“I just don’t feel comfortable building a robot army here and then being ousted because of some asinine recommendations from ISS and Glass Lewis,” Musk quipped, slamming the proxy firms as “corporate terrorists.”
His plan is to secure roughly mid-20s voting power to keep Tesla’s destiny firmly in his hands while still, as he puts it, being “fireable if I go insane.”
If approved, Musk’s stake could surge from 13% to nearly 29%, giving him the leverage he says he needs to push Tesla toward an $8.5 trillion valuation — complete with robotaxis, humanoid bots, and up to 12 million cars sold annually.
🧾 The Takeaway
The stock is up roughly 16% in 2025, clawing back some early-year losses, but it still lags the Nasdaq Composite NASDAQ:IXIC and other mega-cap peers like Nvidia NASDAQ:NVDA and Meta $META.
The near-term question is simple: can Tesla tighten costs without killing growth? The long-term one is bigger: can Elon Musk lead the company into its next chapter without turning every quarter into a cliffhanger?
That said, the earnings season continues and the next batch of big tech heavyweights is right around the corner.
Off to you : What’s your take on Tesla and Musk’s lofty vision north of $1 trillion? Share your thoughts in the comments!
Trade ideas

Tesla - Here comes the third breakout!🚀Tesla ( NASDAQ:TSLA ) is finally breaking out:
🔎Analysis summary:
For the past four years, Tesla has been trading in a very clear ascending triangle pattern. But just last month, we finally saw the expected bullish triangle breakout. Considering all of the previous triangle breakouts, Tesla is setting up for another parabolic rally soon.
📝Levels to watch:
$450
SwingTraderPhil
SwingTrading.Simplified. | Investing.Simplified. | #LONGTERMVISION

Tesla Consolidates Before Next Bullish BreakoutTesla Consolidates Before Next Bullish Breakout — Eyes on $550, $600, and $650 Targets
Tesla’s price action has formed a series of bullish continuation patterns, each followed by strong upward moves. Currently, the stock is consolidating between $413 and $470, creating a potential accumulation zone before the next breakout.
The repeated triangle breakout patterns suggest a continuation of the bullish trend if Tesla manages to hold above the $413 support level.
Once price breaks above the $470 resistance, Tesla could accelerate toward the next targets at $550, $600, and $650, as indicated on the chart.
In the short term, some sideways movement within the current range is possible before the next strong impulse upward.
You may find more details in the chart!
Thank you and Good Luck!
❤️PS: Please support with a like or comment if you find this analysis useful for your trading day❤️

Tesla Stock: Poised for a MASSIVE CRASH? Buckle Up!🚀 Tesla Stock: Poised for a MASSIVE CRASH? Buckle Up! 📉
🔥 Explosive Technical Breakdown!
On the 4-hour timeframe, Tesla is teetering on the edge! A break below $411.42 screams a BEARISH SETUP! 🚨 But hold up – this only kicks in if the price fails to BLAST through $454.43 resistance.
💥 Bigger Picture? It’s BRUTAL! Tesla just SMASHED a critical support level, paving the way for a VICIOUS DOWNtrend! Bears are circling, and the stage is set for a MELTDOWN! 😈
Will Tesla CRUMBLE or pull a last-second escape? Who’s next to get WRECKED?
🚀 Analysis + LIGHTNING-FAST Signals? Follow NOW! ✅
📊 Want a GOLD Decision-Making Chart? Smash LIKE! ✅
💬 Got Thoughts? Comment – Replying to the BEST! ✅

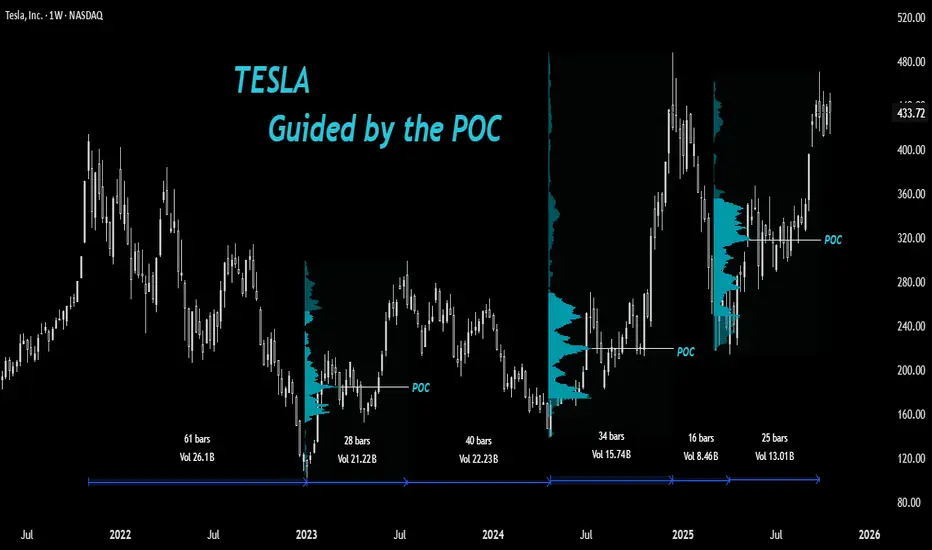
Tesla: Guided by the Point of Control🔎Understanding How Stocks React at Key Volume Profile Levels
In this post, let’s study how a stock can react around important Volume Profile levels and how we, as traders, can take advantage of this behavior.
🔘 A Quick Look at Volume Profile
The Volume Profile shows how much trading took place at each price level. Think of it like a sideways histogram that highlights where buyers and sellers were most active. It helps identify price zones that the market accepted (heavy trading) and those it rejected (light trading).
In between a Volume Profile is the Point of Control (POC) - the price level where the highest trading volume occurred. This is often considered as the market’s fair value zone, where buyers and sellers found the most agreement.
The POC tends to act like a magnet for price. When price moves too far away from it, it often returns to test that level since it represents strong trading interest. That’s why traders use POC zones to mark key supports, resistances, and potential entry areas.
In short:
The Volume Profile shows where trading happened. The POC shows where it mattered the most.
🔘 Overview: TSLA’s Story
After printing a high of $414 in 2021, Tesla (TSLA) has been trying to decisively break that level for almost four years. It made two attempts - first in December 2024, which was quickly faded, and again in September 2025.
🔘 The Fall and Bottom Formation
The stock went through a major bearish phase from $414 down to $101 in 2022 - a massive 75% drop. Then came a sharp V-shaped rally from the bottom - a 194% rise over about 28 weeks, retracing roughly 60% of the entire fall in a short span.
🔘 Why It’s Hard to Catch the Bottom
Catching a stock at the exact bottom is one of the hardest things in trading. No one really knows when the real bottom is forming.
At that point, fear is high, sentiment is negative, and the trend still looks weak. Most traders wait for confirmation - but by then, the bottom is already behind.
Catching the exact low becomes more like a luck than skill. No doubt 'smart traders' focus on catching the early reversal and not the perfect bottom, there are others who wait for pullback opportunities to a fair price.
🔘 April 2024 Bottom Formation
After rallying sharply, TSLA began to pull back from around $300 in July 2023. Traders who had missed the earlier move were waiting patiently with their limit orders for a healthy correction.
But the question was - where should those limit orders be placed?
◽️At the breakout zone around $218?
◽️Near the 50% or 61.8% Fibonacci retracement?
◽️Or below the April 2023 low near $152 for a possible liquidity grab?
The truth is - nobody actually knows the exact level because nothing works all the time.
However, the POC can often help identify a probable fair value zone where accumulation tends to happen.
Although we can’t pinpoint the exact level where a pullback will end, the area 'around' the POC often serves as one of the most reliable zones to accumulate a bullish stock.
And that’s exactly what happened in April 2024. The stock dipped below the previous rally’s POC, grabbed liquidity under $152, and then reversed sharply.
🔘 The Sharp Rally to New Highs
After that, TSLA entered a strong bullish phase, rallying from the April 2024 low to new highs above $414 in December 2024 - a massive 252% rise.
If you observe the Range Tool on the chart, you’ll notice a pattern - bearish phases take longer, while bullish rallies happen faster.
A question here arises: Was this rally sustainable above previous highs?
🔘 The Quick Fall
In January 2025, the stock saw a sharp fall from $488, wiping out 78% of the previous rally.
Interestingly, this decline didn’t stop at a typical breakout retest level - instead, it halted exactly at the POC of the prior bullish rally and began consolidating there.
Since then, the stock has climbed back near its previous highs.
But note this - the January 2025 fall lasted only 16 weeks, while the recovery has taken over 25 weeks without new highs, suggesting a slight loss of upside momentum compared to earlier rallies (early 2023 and late 2024)
🔘 What to Watch Next
If TSLA pulls back again in the future, we can draw a new Volume Profile over the latest bullish leg to locate its POC (I have drawn till the current high of the rally)
That level could once again serve as a potential fair value area and possibly repeat the same price behavior we’ve seen before.
What is your thought on point of control as a tool for investment purpose?
Share your views and hit the boost for more educational posts in future.
📣Disclaimer:
Everything shared here is meant for education and general awareness only. It’s not financial advice, nor a recommendation to buy, sell, or hold any asset. Do your own research, manage your risk, and make sure you understand what you’re getting into.
Your money, your responsibility; and if you’re unsure, ask a qualified financial professional. (Or at least run it by your pet - they’re great listeners 🐶).
TESLA On The Rise! BUY!
My dear followers,
This is my opinion on the TESLA next move:
The asset is approaching an important pivot point 433.50
Bias - Bullish
Safe Stop Loss - 429.07
Technical Indicators: Supper Trend generates a clear long signal while Pivot Point HL is currently determining the overall Bullish trend of the market.
Goal -440.74
About Used Indicators:
For more efficient signals, super-trend is used in combination with other indicators like Pivot Points.
Disclosure: I am part of Trade Nation's Influencer program and receive a monthly fee for using their TradingView charts in my analysis.
———————————
WISH YOU ALL LUCK

Tesla - The massive triangle breakout!🪩Tesla ( NASDAQ:TSLA ) is breaking out:
🔎Analysis summary:
Last month, we witnessed an incredible but expected rally of about +35% on Tesla. Furthermore, with this move Tesla is attempting to break above the previous all time highs. After bullish confirmation, this would also lead to a massive triangle breakout.
📝Levels to watch:
$400
SwingTraderPhil
SwingTrading.Simplified. | Investing.Simplified. | #LONGTERMVISION

TESLA — Bad Earnings + Overcrowded Trade = More Downside RiskSummary:
Tesla’s latest earnings disappointed again — weak margins, slower delivery growth, and unclear guidance on new product cycles.
Despite that, retail and institutional positioning remains heavily crowded, with traders still trying to buy every dip.
But when sentiment stays bullish while fundamentals weaken — that’s when distribution begins quietly.
Key points:
EPS miss and declining automotive margins.
Valuation still priced for perfection.
Lower volume reaction on bounces = fading demand.
Market rotation out of megacaps continues as yields stay high.
Technical setup (chart above):
Major rejection at 450–455 USD resistance (post-earnings rally exhaustion).
Potential continuation toward 420 → 397 → 372 USD support zones.
Short zone: 445–450
Target: 372
Stop: 455
Narrative:
The “AI car” story is overcrowded — even good news now fails to spark real follow-through.
If macro stays tight and rates high, Tesla could correct further before finding long-term buyers again.
💬 “When everyone already owns it, there’s no one left to buy.”

TSLA – Key Resistance Retest AheadNASDAQ:TSLA stock price continues to show strong bullish momentum, recently breaking above short-term consolidation near the $440–$445 zone. The current move suggests buyers are regaining control after a period of sideways accumulation, with the next key resistance area sitting between $470–$490, where previous supply triggered multiple rejections.
If price can sustain above the $440–$445 demand zone, a breakout above $470 could confirm bullish continuation toward $520–$540, aligning with the next liquidity pool. This area could attract profit-taking or a short-term retracement before further upside extension.
However, if the price fails to clear the $470–$490 resistance and forms a rejection candle, sellers may attempt to push price back into the previous consolidation range. A clean break below $430 would invalidate the bullish structure, potentially exposing downside toward $400.

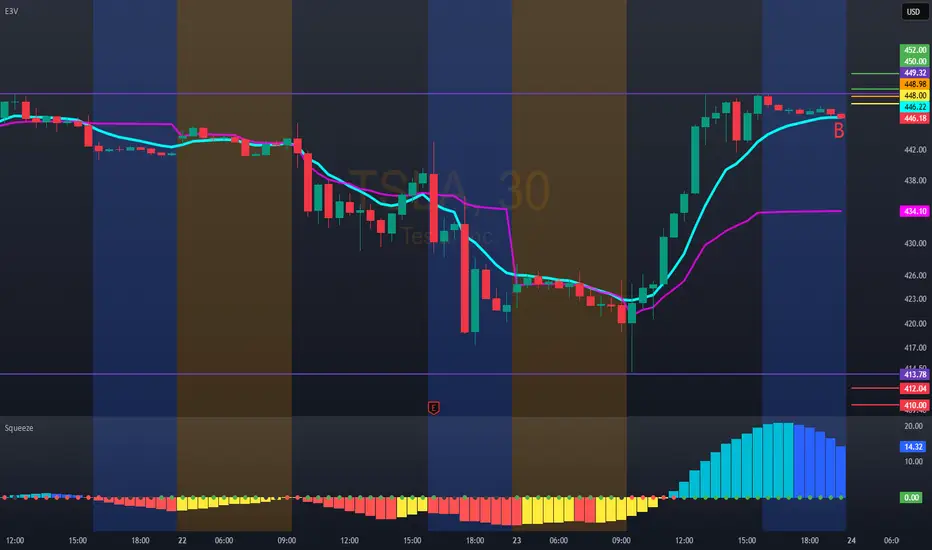
Good morning trader, TSLA for tomorrow: 448.98Economic report
Bullish entry 450.00/452.00
Technical bearish entry 448.00. Let's hope the market follows.
TSLA – Post-Earnings Breakout Clears Triangle Resistance Toward Tesla (TSLA) delivered a strong post-earnings reversal, breaking out of a multi-week symmetrical triangle pattern that had kept price compressed between $410 and $450. After initially trading lower on earnings, buyers stepped in aggressively, driving the stock from the low $420s all the way to a breakout high of $470.76, reclaiming both trendline and psychological resistance levels.
This move officially confirms a bullish breakout from the consolidation pattern formed since early September. The breakout is supported by strong volume, signaling momentum buyers returning after the earnings washout.
If price holds above $450–$455, Tesla could see continuation toward $480–$490 in the coming sessions. However, a pullback toward $440–$445 would be healthy and could provide a retest entry if bulls maintain control.
Support & Resistance Levels:
Support: $445.00 → $435.00 → $420.00
Resistance: $470.00 → $480.00 → $490.00
Bullish Play:
Entry: Above $455 breakout retest
Target: $475 → $485
Stop: Below $440
Options Idea: $480 Call (2–3 weeks out) if price holds above $450

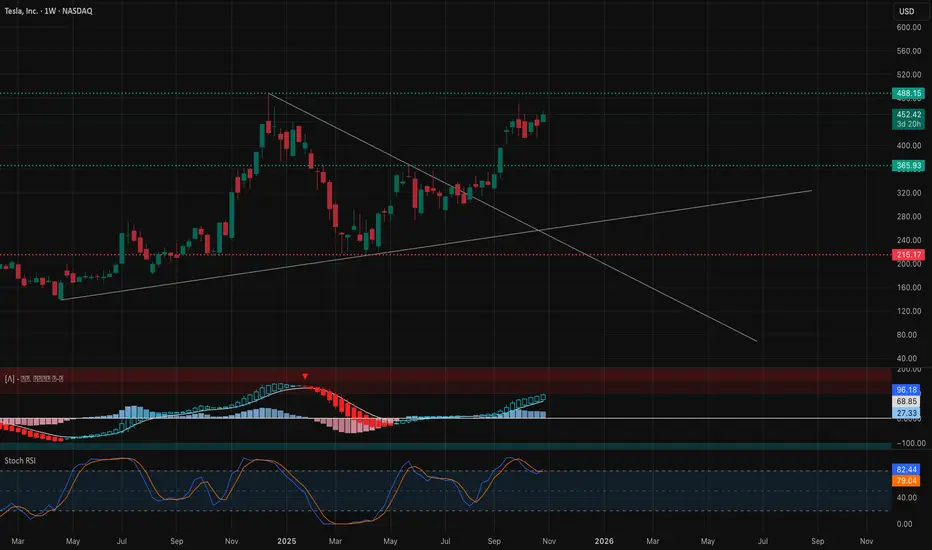
ARE TESLA MARKET BULLS BECOMING WEAK?Tesla Analysis (Weekly Timeframe)
Tesla is currently completing its first cycle wave since inception. The market started printing a primary wave 5, which is an ending diagonal in January 2023. Primary wave 5 comprise of 5 3-wave intermediate waves 1,2,3,4 and price is now printing intermediate wave 5. Intermediate wave 5 started printing in March 2025, minor wave A terminated in May 2025 and minor wave B, a running flat terminated in July 2025. The market is now printing an impulse minor wave C to complete the last 3-wave intermediate wave 5 that will complete primary wave 5 that will complete cycle wave 1. Intermediate wave 5 may be truncated, i.e., it does not necessarily have to touch the medium-term bullish resistance line (upper trendline). From here we will see a major primary wave ABC correction that may begin in Q1 of 2026.
Short entries (1) @ 488.93
Short entries (2) @ 511.04
SL @ 533.15
TP @ 321.47
"The big money is not in the buying or selling - but in the waiting" Charlie Munger
#SabaliCapital
#TechnicalAnalysis

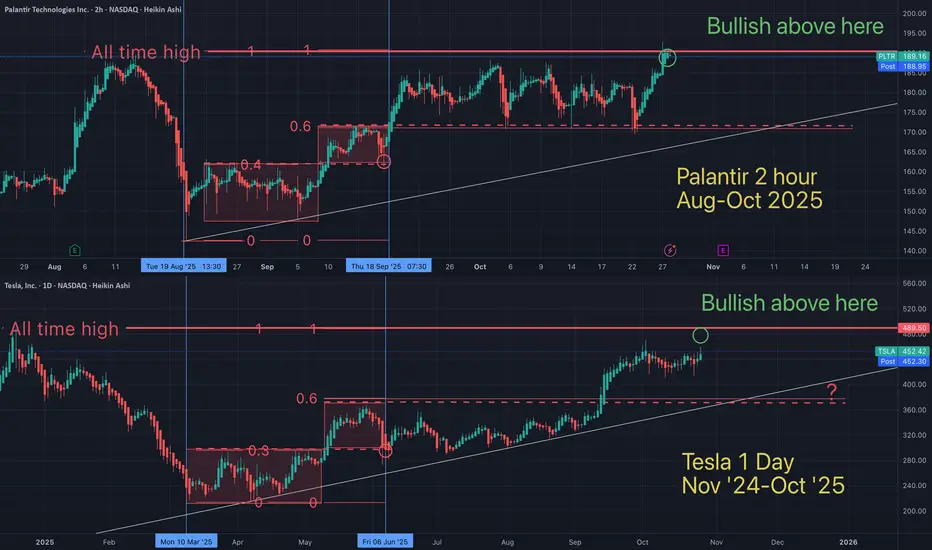
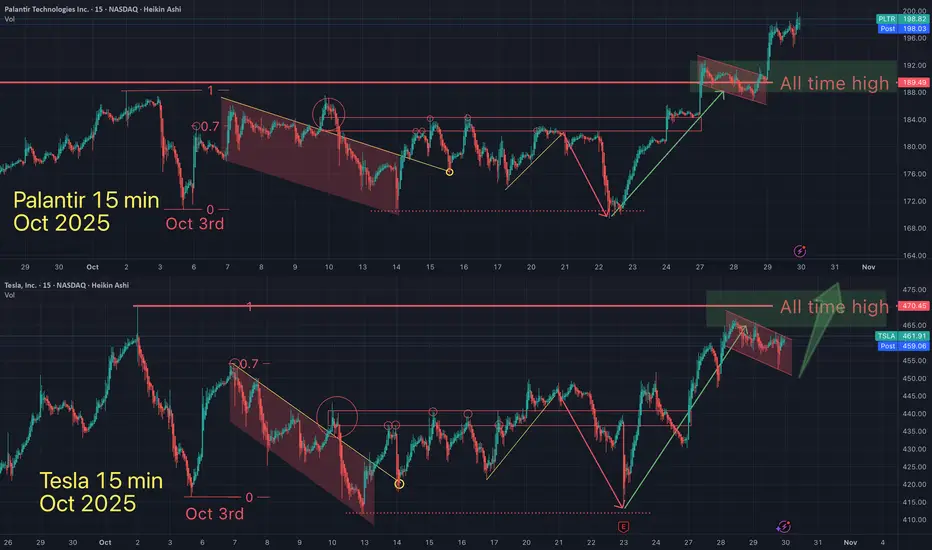
Tesla / Palantir fractal showing both will hit ATH soonFractals are a mathmatical anomaly, if you understand linear equations (and believe the market is "random"). All assets are doing the same patterns over and over, on all time frames. You just need to see it for what it is.
May the trends be with you.
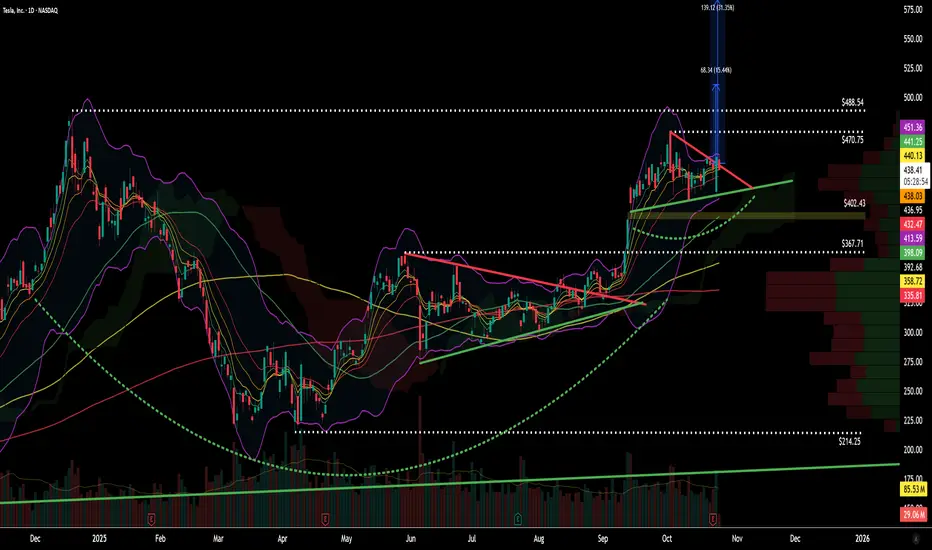
Tesla Macro ChartSharing my Macro Chart.
Use this as a reference for the levels of interest mentioned in my previous tesla post. Added a 30 minute box within the weekly balance box.
I like to personally use this chart to monitor levels intraday on the 30 minute or to plan major shorts or buys.
Some of these levels were drawn a year ago probably but I hope you'll find them useful.
~The Villain

IS TESLA ABOUT TO HAVE A MASSIVE SHORT SQUEEZE?Tesla is showing us some very interesting signals on the daily, weekly and even the 3H chart that are worth covering in this video as it could have massive implications for what Q4 2025 may be looking like for Tesla stock NASDAQ:TSLA

TSLA | Smart Money FlowNASDAQ:TSLA | Smart Money Flow
Tesla’s building pressure right at the distribution zone (460–470) liquidity’s loading up top.
Below sits a clean accumulation block (400–430) stacked with FVGs waiting to get tapped.
A quick sweep → bounce from that zone could send it straight toward $500+.
Structure still clean, bulls still in control.

TSLA Weekly Outlook (Oct 28–31)TSLA Weekly Outlook (Oct 28–31): “Charging Toward 470 or Cooling at the Top?” ⚡
1. Weekly (1W) Structure – Big Picture
Tesla is in a strong bullish continuation phase, showing a clear Break of Structure (BOS) above $367 and holding momentum above $450. The downtrend line from the 2023 high was broken, confirming a long-term structural reversal. Price is now consolidating near $452–$460, forming a possible higher-low setup before a push to $488–$500 zone.
* Bias: Bullish continuation unless price closes below $411.
* Support: $367 → $411 zone
* Resistance: $470 → $488 zone
* MACD: Expanding bullish histogram, showing momentum strength.
* Stochastic: Near overbought but still trending upward.
💡 Weekly Thought:
Tesla’s higher timeframe looks ready for another leg up, but a mild pullback to $430–$440 wouldn’t hurt the structure—it would actually create a healthy base for November.
2. Daily (1D) – Momentum Check
The daily chart confirms a strong BOS and ascending channel. After testing the channel’s lower boundary ($411–$420), Tesla rebounded cleanly toward $452. Price is attempting to reclaim the midline of the ascending channel, signaling renewed bullish control.
* Bias: Bullish bias, but short-term profit-taking likely near $460–$470.
* Support: $411 → $420 (demand zone)
* Resistance: $460 → $470 (channel top)
* Indicators:
* MACD turning positive after extended red bars.
* Stochastic curling up from mid-levels — bullish swing signal.
💭 Daily Suggestion:
Buyers should stay patient for pullbacks near $440–$445 to re-enter. Short-term traders can target $468–$470 if price holds above $452 with volume.
3. 1-Hour (1H) – Short-Term Game Plan
Tesla is holding above the intraday uptrend line, with clear Breaks of Structure (BOS) around $451–$455. The immediate zone to watch is the $449–$451 range, acting as dynamic support. As long as Tesla holds this area, intraday bulls maintain control.
* Scalp Bias: Bullish as long as price stays > $449
* Immediate Resistance: $455 → $465
* Support: $439 → $445
* Setup Idea:
* Call scalp: Above $455 for target $462–$468
* Put scalp: Only if breaks below $445 with volume
📈 1H Thought:
If Tesla consolidates sideways around $450–$455 early week, it sets up a launch toward $470 later in the week.
4. GEX & Options Sentiment – Institutional Flow Insight
The Gamma Exposure (GEX) map shows clear call dominance:
* Highest positive GEX wall / resistance: $455–$460
* 2nd & 3rd Call Walls: $465 → $470 → $480
* Put walls / downside support: $430 → $415 → $400
Key Metrics:
* GEX Bias: +57.2% Calls
* IVR: 15.5 (low volatility environment)
* IVx avg: 60.2% (vol compression likely → bullish)
Institutions are positioned bullishly with heavy call exposure at $460–$470, acting as a near-term magnet. The $430–$415 range remains protected by put walls—making it a tough zone to break down through unless macro turns negative.
5. Suggested Option Plays
* Bullish Setup (Preferred):
* Buy-to-open 460C (1DTE/2DTE) if price reclaims $455–$457 with volume.
* Target: $470
* Stop: Below $445
* Reason: Strong call gamma wall at $460 + breakout potential.
* Bearish Hedge (Cautious traders):
* Buy 440P (1DTE/2DTE) only if TSLA breaks $445 on volume.
* Target: $430
* Stop: Above $455
6. My Take for Oct 28–31
Tesla is showing clean bullish structure across all timeframes.
* Weekly confirms a higher low and BOS continuation.
* Daily is aligned within an ascending channel.
* 1H shows intraday bullish trendline support.
* GEX confirms call-dominant sentiment toward $470.
If macro markets remain stable, TSLA likely tests $468–$470 this week, possibly stalling there for profit-taking. A rejection near that level would bring $440–$445 back into play for reload.
🎯 Primary Bias: Bullish toward $470
⚠️ Watch For: Failing to hold $445 = possible short-term correction.
Disclaimer:
This analysis is for educational purposes only and not financial advice. Always manage your risk and perform your own due diligence before trading options or equities.
Tesla at major support. I'm long.Tesla is at major yearly support. Confluence between levels and fib. This is where we need to hold to maintain the trend on the monthly chart. I don't know if it will hang out at this level or possibly go below the level before we regain and higher. But this is a valid long trade at these levels. If we don't hold here it is much lower. Long term target is $670. Remember the fud around Tesla is meaningless. It's all the charts. If the markets were "rational" we wouldn't even be at these levels in the first place.

Account Blow Up 10/17/2025💥 Trading Is a Game of Survival
NASDAQ:TSLA blew up my account — I’ll be completely honest about that.
It hurts, but it also teaches. Every great trader has been here once.
I fund my account every two months, which means I won’t be trading until next month. That’s fine — I’m using this reset to rebuild cash flow and strengthen my system.
I promise to come back stronger, with cash in hand, discipline sharpened, and focus doubled.
The goal isn’t to win once — it’s to stay in the game long enough to master it.
This isn’t the end.
It’s just a reset.
#Trading #Discipline #RiskManagement #Comeback #TSLA #WaverVanir #VolanX

You will ask yourself, "how did he know Palantir would do that"?On Oct 7th I suggested that Palantir & Tesla were in a very bullish long term pattern and were both about to *soon break out into new all time highs (ATH). Palantir just did...is Tesla next?
Blow off top next?
May the trends be with you.
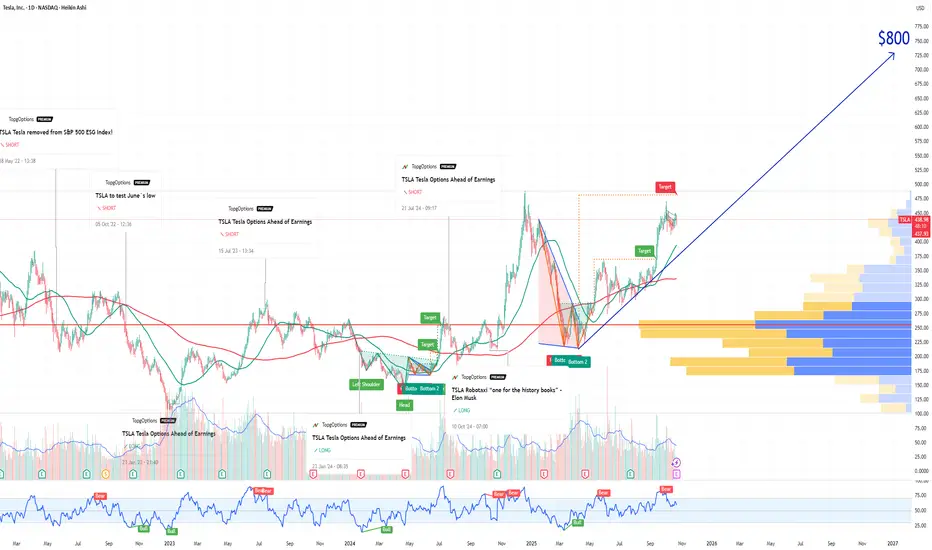
TSLA Tesla Options Ahead of EarningsIf you haven`t bought the dip on TSLA:
Now analyzing the options chain and the chart patterns of TSLA Tesla prior to the earnings report this week,
I would consider purchasing the 800usd strike price Calls with
an expiration date of 2027-1-15,
for a premium of approximately $40.30.
If these options prove to be profitable prior to the earnings release, I would sell at least half of them.
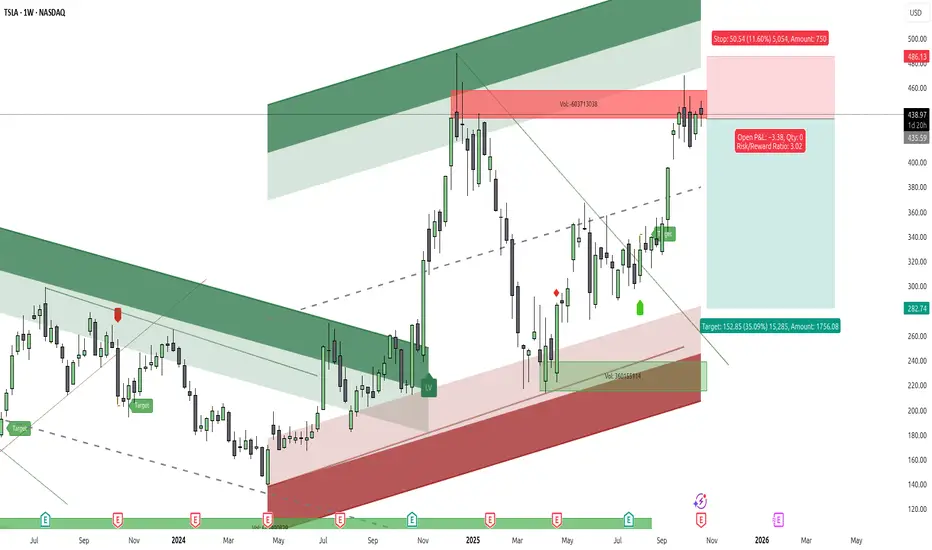
$TSLA: Gravity Reasserts ItselfGreetings, traders.
The NASDAQ:TSLA chart is currently painting a picture of a profound test of market physics. This isn't a "battle"; it's a conflict of impersonal forces.
On one side, we have "Lift"—the powerful, almost unnatural force of a narrative focused on AI, robotics, and a limitless future. This force defies traditional valuation and pushes the price to high altitudes.
On the other, we have "Gravity"—the undeniable, constant pull of fundamental reality, which just made itself known in the Q3 earnings report.
The chart is our laboratory, and we are here to observe these forces at work.
The Technical Landscape
The Macro View: The weekly chart shows the narrative's 'Lift' failing at a critical altitude. The price has been decisively rejected from the " gravitational ceiling " of its multi-year ascending channel (approx. $480-$500). This is a level where the weight of reality has consistently proven too strong. The most recent large, bearish candle is not an attack; it is simply the pull of gravity reasserting its dominance over upward momentum.
The Tactical View: The daily chart shows why this 'Lift' is failing. We saw a classic bearish MACD divergence on the final push to the highs—price floated higher, but the underlying force (momentum) was fading. The MACD has now crossed bearishly, confirming the shift. Price is now coiled in a tight daily wedge, a tactical "decision point" where we will see if 'Lift' can be re-established or if 'Gravity' will take full control.
The Philosophy: A Tale of Two Forces
To understand NASDAQ:TSLA $, you must understand the two opposing forces that define its physics.
The 'Lift' (The Narrative Camp): The bull case is a qualitative vision. It's about Robotaxis, Optimus, and AI. This crowd is rightfully unconcerned with a single quarter's auto margins because, in their view, they are buying a different company—one that exists 10 years in the future. Their conviction is deep and provides a powerful upward force.
The 'Gravity' (The Quantitative Camp): The bear case is a spreadsheet. It's about the "now." The Q3 earnings report is the catalyst for this "counter-force."
EPS Miss ($0.50$ vs $0.53$) Severe margin compression from aggressive price cuts. A fundamentals-based valuation (e.g., Morningstar's $250 FVE) that is miles away from the current price.
This setup is a clear piece of the puzzle.
It shows what happens when the powerful force of 'Lift' (Narrative) reaches its apex and meets the immovable, constant pull of 'Gravity' (Macro Supply + Fundamental Reality). At this specific junction, 'Gravity' is in control.
An Illustrative Setup
We do not predict; we observe and we react.
The confluence of a failing 'Lift' at a 'gravitational ceiling,' combined with the new "weight" of a fundamental catalyst, provides a high-probability, asymmetric setup. This is not about being "right"; it is about defining risk.The chart illustrates a potential short setup based on this confluence:
Entry: ~ $435.00$ (Sell Short)
Stop-Loss: ~ $486.00$
Target: ~$282.00$
Risk-to-Reward Ratio: ~3
The confirmation for this thesis would be a breakdown from the daily wedge (around $430), signaling that 'Gravity' has taken firm hold.The stop-loss at $486$ is the "escape velocity" point. If the price breaks above it, the 'Lift' force has overcome 'Gravity,' the thesis is invalidated, and we step aside.
One cannot argue with the market's physics.
Respect the level; it is your anchor to reality.
Disclaimer: This is not financial advice. It is for educational and informational purposes only. Please conduct your own research and manage your risk accordingly.
$TSLA – Bull Pennant Sequence & Cup-and-Handle ContinuationThis is a follow-up to my August–October technical outlook on Tesla ( NASDAQ:TSLA ).
After the first bull pennant breakout, price pushed to $470, falling just shy of my initial $480 target, before pausing and forming another bull pennant directly below December’s all-time high near $488.
Structure & Momentum
Momentum remains strong — the daily chart has now completed a cup and handle formation, adding a new layer of continuation confluence to the broader trend structure.
The key takeaway here is that NASDAQ:TSLA continues to respect rising MAs and trendline support, consolidating at high levels rather than breaking down — a bullish sign of controlled digestion after a strong run.
To confirm a full breakout continuation, the chart now needs a decisive move through $488 on high volume. Until that happens, the current pennant acts as both a compression zone and accumulation phase.
Breakout & Targets
If volume expands and NASDAQ:TSLA clears the $488 ATH, the next resistance targets are:
Target 1: $510 → symmetrical triangle 1:1 projection
Target 2: $580 → measured move from flagpole #2 (pennant #1 extension)
Both levels represent high-probability reaction zones where price could pause or retrace before resuming trend.
Support & Risk Management
Below, the chart shows clear structural support at:
$402 → prior breakout base and Ichimoku cloud zone
$367–$370 → trendline & confluence support
As long as price respects these zones, the setup remains valid and constructive.
A close below $370 on strong volume would invalidate the near-term bullish bias.
Technical Summary
✅ Trend: Bullish continuation
✅ Pattern: Cup & Handle + Bull Pennant #2
📊 Key Resistance: $488 (ATH)
🎯 Targets: $510 / $580
⚠️ Support Watch: $402 → $370
🔍 Trigger: Breakout confirmation on strong volume
Final Notes
Tesla continues to show a textbook multi-phase breakout structure — bull pennant, consolidation, and potential measured-move continuation. Until the breakout confirms, patience around $488 remains key. Once volume supports it, the next leg higher could complete the second flagpole move toward the $510–$580 range.
For educational and technical analysis purposes only.