XLEXLE getting close to the top trend line. Support is at 59.28. It does look like it is topping so XLE could come back to retest the breakout.
Trade ideas

$XLE top of channel - short back into trendxle approaching top of channel here. going to short back into downtrend

Bullish outlook on Energy $XLEAppears we have completed an expanded flat on a weekly time frame in $XLE. Since creating the low on the week of March 16, 2020, we have been moving impulsively to the upside, which from a technical standpoint, gives me a bullish outlook for the overall sector. Will update as time progress.

Strong move on XLE….but WAITXLE will continue to be bullish this 2022 as a recovering economy should need a lot of energy & oil.
XLF will rise with XLE as many big banks invest in energy.
55 will be a good support & the next resistance areas are 65, 72 & 80.
Target price may be the height of Head & shoulder at around 88.
But wait….XLE has yet to breakout of a falling wedge soon & then the rising wedge to follow.

2021 sector performance year in review2021 sector performance year in review:
XLE = Energy 46.07%
XRT = Retail 41.26%
XLK = Technology 34.38%
XLF = Financial 32.70%
XLY = Consumer Discretionary 27.46%
XLV = Health Care 24.73%
XLB = Materials 24.62%
XLI = Industrials 18.98%
XLC = Communication Services 16.73%
XLU = Utilities 13.76%
XLP = Consumer Staples 13.55%
XBI = Biotechnology -19.02%
Do your own due diligence, your risk is 100% your responsibility. This is for educational and entertainment purposes only. You win some or you learn some. Consider being charitable with some of your profit to help humankind. Good luck and happy trading friends...
*3x lucky 7s of trading*
7pt Trading compass:
Price action, entry/exit
Volume average/direction
Trend, patterns, momentum
Newsworthy current events
Revenue
Earnings
Balance sheet
7 Common mistakes:
+5% portfolio trades, capital risk management
Beware of analyst's motives
Emotions & Opinions
FOMO : bad timing, the market is ruthless, be shrewd
Lack of planning & discipline
Forgetting restraint
Obdurate repetitive errors, no adaptation
7 Important tools:
Trading View app!, Brokerage UI
Accurate indicators & settings
Wide screen monitor/s
Trading log (pencil & graph paper)
Big, organized desk
Reading books, playing chess
Sorted watch-list
Checkout my indicators:
Fibonacci VIP - volume
Fibonacci MA7 - price
pi RSI - trend momentum
TTC - trend channel
AlertiT - notification
www.tradingview.com

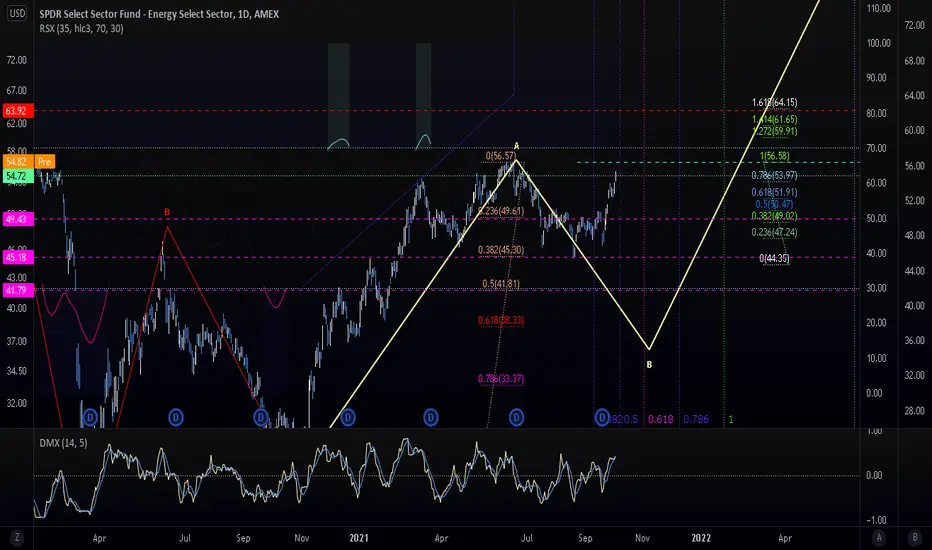
XLE at an important decision pointInvesting in XLE is less volatile than crude oil. Demand bound to rise as economy recovers.
XLE already came back from a HEAD & SHOULDER covid plunge & retested the neckline.
It is at the same time trying to breakout of a BIG WEDGE & a SMALLer WEDGE.
Noticing the small head & shoulder inside the small wedge,
my bias is for XLE to breakout soon. Getting above 65 would set the next targets of 80 & 100 into play as wave 3 continues.
Not fincial advice....make due diligence.
Pls comment also your ideas.

TOPUP Buying The Dip Strategy //This is just a TOPUP Buying The Dip Strategy that you can incoporate with your existing DCA type investments
What I like about trading Commodity based ETF (i.e Oil and Gold), every falling price will always means its just a correction. Meaning, after a dip it will again rally. Unlike stocks, it's difficult perhaps borderline impossible for commodity price to fall below zero (in this case for oil, it did but not for long) hence ETF that tracks the price of Oil will never go below zero.
Everytime this ETF make 50% correction, you buy the ETF shares. That's the strategy. Now I do not recommend to use a buy and hold strategy here. You need to decide how you want to take profit as soon as you buy the shares. Percentage based? Momentum based? trailing stop? fundamentally based? All up to you
The whole point of this post is to show every correction/falling price, its an opportunity to buy. This is a monthly chart and such opportunity only occured 3 times in the last 20+ years.. hence why I call this just a TOPUP strategy.
This can work with other commodity based ETF and you even can use this for SP 500 but waiting for 50% correction would be very rare but perhaps shorter corrections like 6-8%


Xle at 7 yr resistance Everyone calling for 100 plus oil which would take xle higher. According to charts we are hugging 7yr resistance and bounced off a few times. We are in wave 4 with big 5 down wave expected. I’m taking opposite view see oil long term in the mid 20s and xle making lower low 20s. Dollar inverse head n shoulder going to put pressure on oil commodities


XLE Looking goodimo
technical; if they close above $58, it ll go a lot higher.
fundamental: they need to replenish the oil reserve

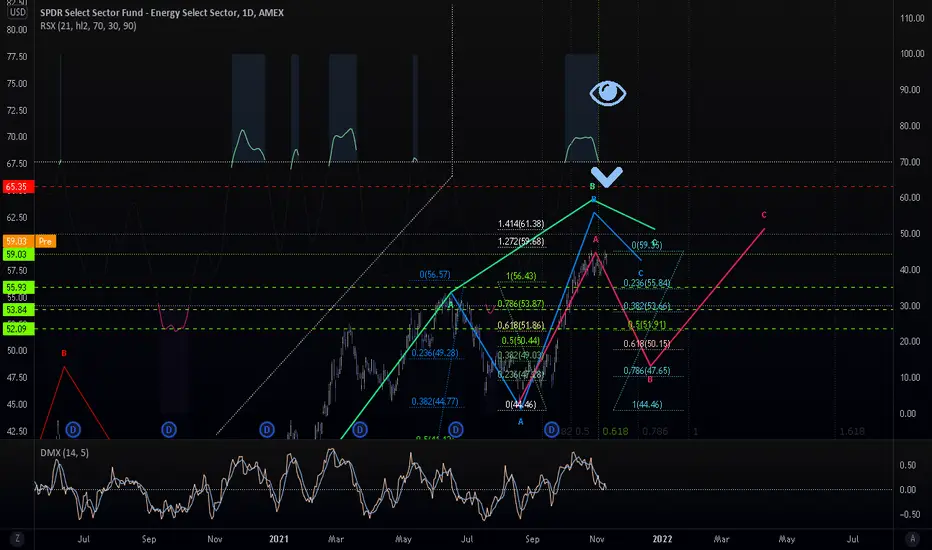
SPDR Energy Sector Fund pulling back momentarily. XLEConsolidating here to the third degree and looking for an eventual downward Wave B. Even if its a shallow pull back, there is still much time and space for this thing to drop in the coming days or weeks.
We are not in the business of getting every prediction right, no one ever does and that is not the aim of the game. The Fibonacci targets are highlighted in green with invalidation in red. Fibonacci goals, it is prudent to suggest, are nothing more than mere fractally evident and therefore statistically likely levels that the market will go to. Having said that, the market will always do what it wants and always has a mind of its own. Therefore, none of this is financial advice, so do your own research and rely only on your own analysis. Trading is a true one man sport. Good luck out there and stay safe!
Energy ETF Is Pushing HighsEnergy stocks have been consolidating as major companies report earnings. Now they could be back in focus with inflation still rising and the economy reopening.
The most important feature on the SPDR Energy ETF’s chart is price zone around $56. It was a crucial support area in January 2020 before XLE crashed to a generational low. It was also a peak in June, but the fund has remained above it the last five weeks.
Next, prices have shown new support at a higher level around $57. Notice how tests of that line on October 18 and 21 and November 3-4 and 15 were followed by quick bounces.
Third, the consolidation period has compressed Bollinger Bandwidth to the lower end of its range. Is XLE ready to start moving again?
Finally, notice how the 8-day exponential moving average (EMA) has remained above the 21-day EMA. That shows little selling interest during the recent consolidation phase.
TradeStation is a pioneer in the trading industry, providing access to stocks, options, futures and cryptocurrencies. See our Overview for more.

$XLE - about to break out on MONTHLY chartXLE has been on a run for a while due to ridiculous government policies and higher inflation. This soon to be break out will confirm what we already know. Inflation will continue and it will be ugly. Get ready folks.
This is not a recommendation to buy or sell. It is for information purposes only.

XLE Potential Downside IdeaI think we could be seeing a short term top in energy prices with a reversion to the trendline and potentially move higher into the summer.

Elliott Wave View: Energy ETF (XLE) Wave 5 In ProgressShort-term Elliott wave view in Energy ETF (XLE) shows a 5 waves impulse structure from August 19, 2021 low. Up from there, wave 1 ended at 49.69 and pullback in wave 2 ended at 46.47. The ETF then extended higher in wave 3 towards 59.41 and pullback in wave 4 is also proposed complete at 57. The 1 hour chart below shows the internal subdivision of wave 4 as a zigzag Elliott Wave structure.
Down from wave 3, wave (i) ended at 58.78 and rally in wave (ii) ended at 59.36. Wave (iii) ended at 58.50, rally in wave (iv) ended at 58.94, and final leg lower wave (v) ended at 57.94. This completed wave ((a)) of 4 in higher degree. The ETF then bounced in wave ((b)) of 4 which ended at 58.82. Wave ((c)) of 4 lower completed at 57 with internal subdivision also as a zigzag.
The ETF has turned higher in wave 5, but it still needs to break above wave 3 at 59.41 to avoid a double correction. Up from wave 4, wave (i) ended at 57.79, pullback in wave (ii) ended at 57.23, wave (iii) ended at 58.03, wave (iv) ended at 57.75, and wave (v) higher ended at 58.35. This completed wave ((i)) in higher degree. Pullback in wave ((ii)) ended at 57.23. Up from there, wave (i) of ((iii)) ended at 58.62. Near term, while dips stay above 57, expect the ETF to extend higher.

XLE: Breaking Critical ResistanceFundamental Backdrop:
- Weakening growth/momentum; strengthening value
- Rising Inflation
- Beaten down energy names; oversaddled with debt (debt is good with inflation)
Technical:
- MACD building up cause and growing
- Relative out performance
- Approaching resistance with strength; with potential break yesterday
Adding here with tight stops

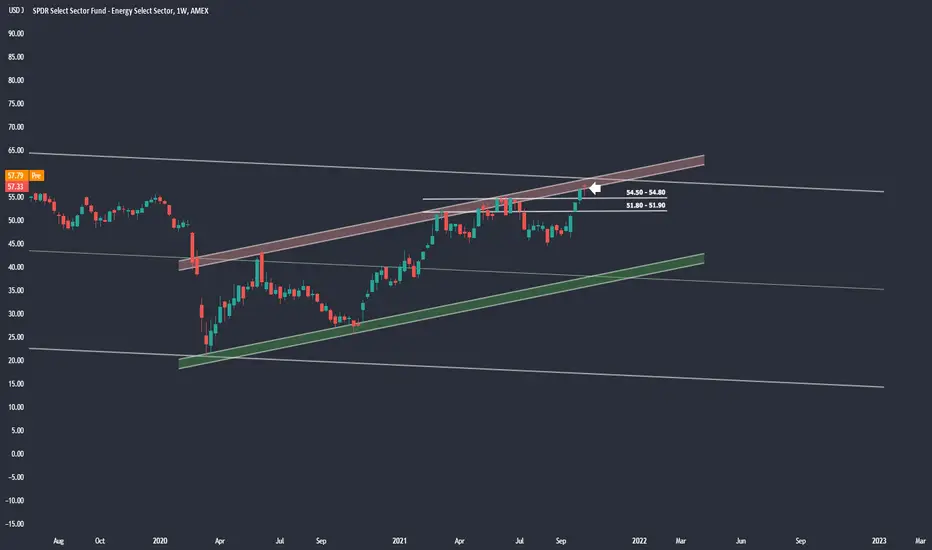
XLE - Short Term Bearish Overbought on the daily and reaching top of both daily and weekly channels. Not to mention printing one ugly bearish weekly candle. Looking for a pullback towards $51-$52 area but will need some market weakness to happen. 54.50 - 54.80 support will need to be broken as well and where I plan to reduce 50% of my short position from Friday.
XLE..Energy big week aheadPushing up against its 7yr bear channel.
I notice on a smaller scale the double bottom playing out since 2020 which I highlighted in white.
With this momentum from increasing oil supplies I expect we could breakout here

Energy sector will go into deflationary depression crash I thinkWe are on the edge of credit bubble bursting into flames lol. All this is going to be deflationary environment NOT inflation. You can't have inflation without credit. I believe we are on the edge of commodities meltdown cause by THE GREAT RESET of the world's credit system. Not the kind of reset everyone is expecting which is inflationary. This is going to be The Great Depression 2.0 IMO...

Energy Sector Showing Inverted Head and ShouldersAMEX:XLE
Scanning through the sectors I noticed something quite clear, an inverted head and shoulders with a possible retest playing out. This is supported by the laguerre rsi below. I'm expecting prices for XLE to go higher and potentially confirm a megaphone pattern.

Short on SPDR Select Sector Fund. XLEThat's right. Short on this one and we are right in a middle of a corrective zigzag on this one. we may have very transient and short upward transient movement, but then that will be followed with an honest conversation with gravity.
We are not in the business of getting every prediction right, no one ever does and that is not the aim of the game. The Fibonacci targets are highlighted in purple with invalidation in red. Fibonacci goals, it is prudent to suggest, are nothing more than mere fractally evident and therefore statistically likely levels that the market will go to. Having said that, the market will always do what it wants and always has a mind of its own. Therefore, none of this is financial advice, so do your own research and rely only on your own analysis. Trading is a true one man sport. Good luck out there and stay safe!
XLE about to bust Started $XLE $56.00 calls for next week. Options flow is crazy bullish and nice chart.
