XLE SP500 Energy Sector SPDRWhen doing my sector research, I noticed that the stochastic levels were decreasing. I like levels under 50% and this is currently at 24% today. The put to call ratio is under 1 sitting at 0.92 post-market which indicates that there are a tad bit more puts that were closed today versus yesterday which indicates that more calls are slowly entering the market. The energy market is due for a spike in my opinion as the economy is slowly recovering and demand is slowly increasing with talks of the infrastructure bill along increased oil demand as of late. The only thing worries me is the lack of unemployment growth and job acceptance compared to job growth which has been increasing.
As far as the chart itself, on the Daily timeframe I noticed that the RSI is in the "oversold" territory and the MACD just crossed over to the green territory which indicates a possible reversal soon to come. I've also noticed that "Support #1" has potentially been broken. I want to make sure my 4HR and 1HR time frames match to the daily regarding the RSI and MACD which it is pretty close in my opinion. Since "Support #1" has been broken, I went to the 4HR and 1HR to confirm in which I saw the Support #1 being broke through with strong bearish candles. This indicates that price could potentially begin testing "Support #2". I used the fibonnaci indicator to trace a potential retracement from and to the resistance and the support levels to create the discount price area and the target price area.
Before entering I want to see bullish candles in the discount zone on the 1HR timeframe!
I hope this give you some form of sentiment.
Thanks for the support!
Trade ideas

XLE shortXLE has reached the top trend, filled gaps from the previous crash and now under the 200wma. Looks like it could start to sell off here.

XLE Energy poised for another leg higherGoing through weekend charts and noticed a lot of energy names popping up on the scans so I pulled up XLE. I marked up this chart awhile ago as price was coming into the 55 area where I expected some resistance. Price pulled back in the 55 zone and retested the downward trend line. If price can work its way above the red box a push higher is likely. First target area would be 65 then 72. Energy names to watch would include XEC & EOG.

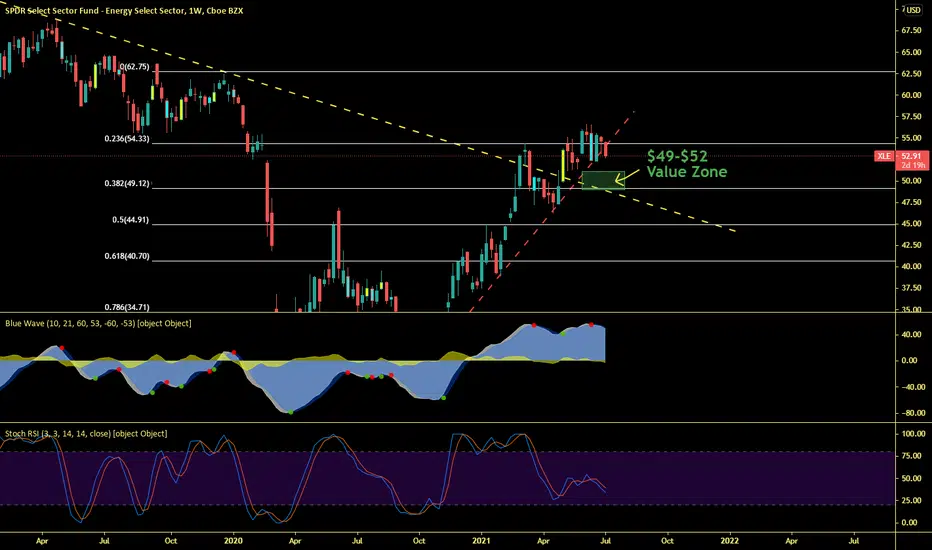
XLE can go a little lowerGoing long on XLE in the listed value zone is a better play than shorting Energy stocks at the moment.
XLE is gonna go trough the roof, by August. ER by the period as well.
this is the longterm "trend" (line) to follow. Would imagine getting above it to be super bullish. Once XLE/SPY gets "above", where it needs to be, more volume would hop in opportunistically.


Biden's energy performance puts past presidents to shameHmm ... so the Democrats, apparently, want to kill energy??? Maybe it's good for their shareholders!


Energy ETF Slams Into ResistanceEnergy has been the dominant sector this year, but it remains one of the worst performers over the long run. Now could be a time for the bears to make a stand.
This weekly chart of the SPDR Energy ETF highlights the $56 level:
Notice how it was a low in late 2018 and near the low in early 2016. Also notice the price consolidation in that zone immediately before coronavirus triggered a deeper crash. XLE returned to $56 in early June and has struggled since. Last week's tight spinning-top candlestick is also a potential reversal pattern.
Turning to the daily chart, we see a combination of bearish divergence on MACD and overbought conditions on stochastics.
Finally, the broader commodity space is under pressure. Copper’s having its worst week since March 2020. Precious metals and grains are also under pressure. It could only be a matter of time before the weakness spreads to crude oil.
TradeStation is a pioneer in the trading industry, providing access to stocks, options, futures and cryptocurrencies. See our Overview for more.

XLE heading towards $60 on the next leg upIt appears an oil supply shortage is coming. Even the EIA is worried about the current supply output by OPEC, which should push the price of oil higher. OIL companies such as XOM, and COP have not participated in the rally in oil price as much I expected. They are actually down today, while the price of oil pushes 71. I expect oil companies to catch up sometime this week, with many of them bouncing on the 20 moving average.

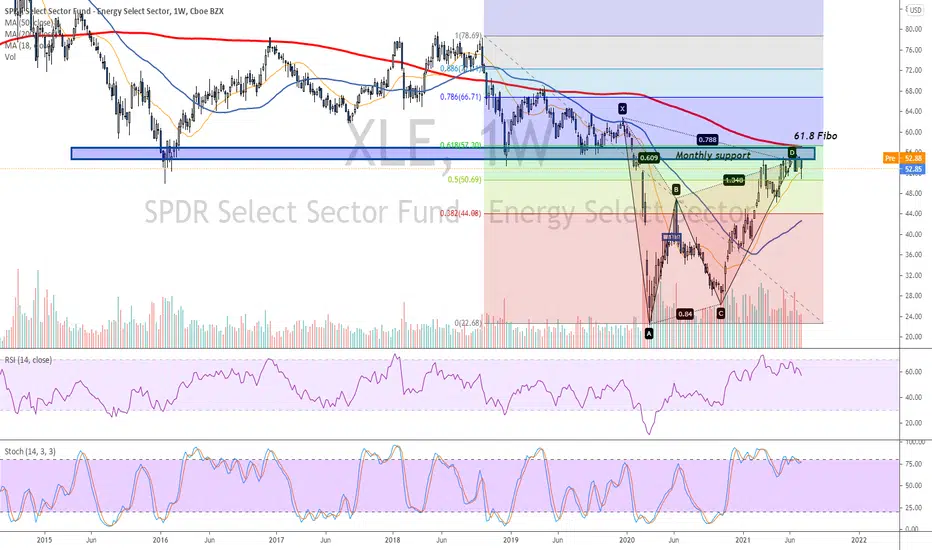
XLEThe price is at a significant multiyear support/resistance level. The support is also characterized by the trendline. The stop should be placed at around 53$. When the price hits the stop the support level A or B can be considered as the next entry. Targetarea is about 61$-62$

XLE BullishnessTaking XLE buy based on sector performance and nice technical analysis.
Usoil has been pushing bullishly with high volatility in the summer, increased travel, and typically higher gas prices in summer months. expecting significant increase through rest of 2020.
overall had nice textbook break of weakly high.
price created a bullish structure above highs and broke impulsively, confirming the breakout.

Black Gold is not doneBlack Gold finally broke out from the 3 month cup handle pattern as mentioned last week! Although weekly chart was showing bearish, it was a bullish flag because the lows never broke. This week the momentum continues upward possibly in a big way. Extremely Bullish! Once it breaks 56.75, 59 will be the next target. XOM, SLB, NOV are yummy plays.

Energy breakout ~ June 2021Technical Analysis
We have been in a strong uptrend (pink segment line) since November, which I have divided into 3 ranges.
We have tested the top of "Range 2" 3 times, and we are now breaking out. Either we continue into "Range 3", or we could potentially test the pink trend line once again (ghost feed representation)
Macro
Tomorrow jobs report could be a market moving event, as the Fed has made a drastic change in its action plan, which consists of reacting to data (reports such as these), instead of reacting preemptively as it has done in the past.


XLE - Energy Sector Breaking OutEnergy Sector on the verge of breaking out; Watch out for XLE stocks.
Target - 56 and then 61
www.marketwatch.com

XLE / energy looking good - target 62.Cup-n-handle forming - or a double top with rounded bottom and a bull wedge. Sitting at resistance now. Momentum indicators look good, RSI improving as price is pushing higher.

XLEChart pattern: Bull flag
Entry: 54.06 $ (this would end the secondary downtrend of the correction)
Stop: 51.18$
Target: 60$-65$
Stopmanagement: SAR Parabolic 4h Chart default settings
Risk:Reward-Ratio: > 2:1
Intermarket-analyses: The recent CPI data indicates that we are in an inflationary environment which cannot be solely explained with the basis effect. The energy sector was always a valid hedge against inflationary forces and compared to gold and silver it is not that strictly dependable on the development of the US10Y. The further depreciation of the dollar should also act as a tailwind for the energy sector as they both are inversely correlated.

One more final dip for energy..I think it will get downward pressure from stock market to make a final dip and never look back...

ENERGY LONGWith Oil breaking out of it's 10 year bear market, we can expect further upside for the energy sector.

