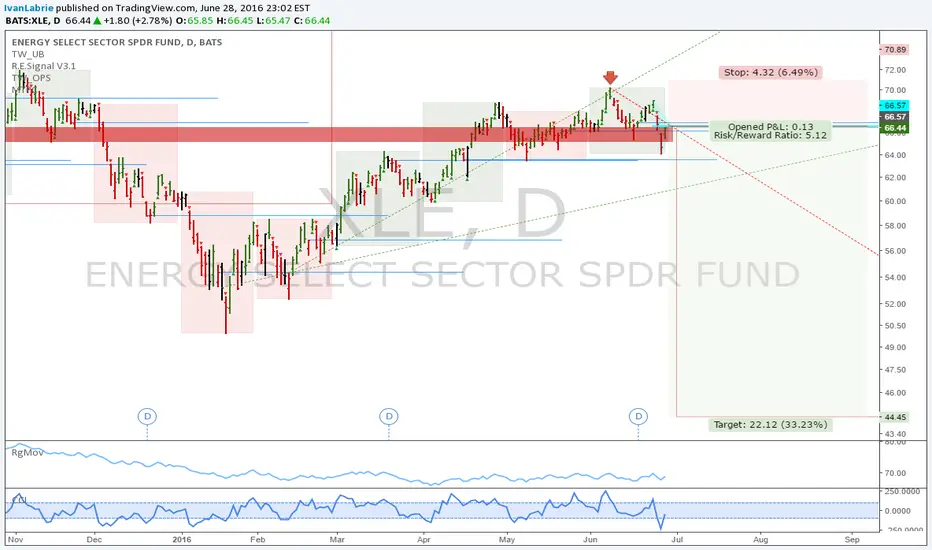
XLE: Potential short setupXLE is right at an 8 month level, and about to hit a key level resistance, so I'd like to get short with a wide stop loss speculating on confirmation of the downtrend continuation in the monthly. You can see the 50% speed line of the recent decline on chart, which would be good to see price respect to stay short or enter shorts here.
Volatility is high, so stick with the 3 ATR stop on chart.
Check out my updated track record here: pastebin.com
If interested in my trading signals, or in personal tuition, contact me privately. I'm offering a considerable discount on a packaged course which includes access to my private trading signals list for a year.
Cheers!
Ivan Labrie
Link to Tim West's chatroom: www.tradingview.com
We discuss setups like this often there. Feel free to stop by and subscribe to his indicator pack. If you have any questions ask.
Risk disclaimer: My analysis is provided as general market commentary and does not constitute investment advice. I will not accept liability for any loss or damage including, without limitation, to any loss of profit which may arise directly or indirectly from use of or reliance on such information.
Trade ideas
XLE: Running Out Of Energy?I feel the XLE has just about run out of steam.
There is substantial resistance at $70. A five wave harmonic pattern with three a-b-c corrective waves has just been completed.
This configuration has not yet rolled-over, but I think it will as the price approaches the 89 day moving average (golden-yellow line).
For those of you who think the USD will get stronger, it stands to reason that the energy sector will get weaker.
I hope this contribution has been helpful. May all of your trades go well. Don.

XLE - ENERGY SELECT SECTOR SHORT SETUPThe price is now in a strong resistance area, the previous neckline in H&S pattern. Pay attention to the price action for shorting opportunities. Possible target a confluence area around 61$ level. Risk reward ratio 3,5.

Two Charts That Indicate S&P 500 Sell-Off, Part 1: XLEWhen the S&P 500 was selling off in February, the Energy Sector, and its related components, sold down and formed a double bottom. There was worry that banks would be in trouble because of non-performing loans to the energy companies. Since then, the energy sector has rallied.
The above chart is of XLE. The energy giants in XLE include XOM-CVX-SLB-KMI-EOG-OXY-APC-COP-PSX-TSO-BHI, and on and on. These are huge energy companies. If you chart these as individuals, most are weak. They are weak for many reasons.
These include: too much supply and too little demand. Many have cut or eliminated their dividends.
XLE has completed a five wave impulse pattern and corrective waves a-b-c are nearly completed. I believe this Elliott wave pattern will result in a down-side directional break of trend (located on chart above, at corrective wave "c", far right, near large red arrow near top of cloud).
Not all indicators are negative, but the top indicator (RSI) is rolling over, the phase energy is weakening, and the alligator jaws (around $65.27 on above chart) are closing. Another negative, the Ichimoku Cloud is lower than structure to the left.
Many of the energy companies individual (charts) are rolling over. They are getting weaker.
Inter-market analysis suggests the following formula (from Don's book of logical assumptions).......
E = MC x 2. Translation: Energy = Momentum Change x 2 (XLE momentum change and XLF momentum change). To me, both are heading lower.
This is part 1 of 2. Please move to Part 2, the chart of the XLF (Financials).
I hope this has been helpful, entertaining, and informative. May all of your trades go well. Don.

long xleOil is starting to look good at this level I will be looking to go long xle to first and second target zone.

XLE turn at the bottomTwo of topping signals, one hammer with volume two, the second broke through the triangle at the bottom. Sunset on the trend on a pullback of the second wave.


$XLE - Daily Chart (Short IT)I think it's time to short it here. Into R2 and approaching the 1.618 fib ext. CL_F is about to tank.. Only reason for run up here.
Buy May $62P's

Energy filled gap and then reversed50 day moving average still supports an intermediate trend of up.

Energy sector at key level This could be setting up for a nice swing trade over the next few weeks/months. Keep an eye on any further breakout and consolidation above shaded rectangle and 50 day moving average in orange.


Approaching daily sell zone63-64$ is a potential sell zone that includes Fibonacci level (61.8), minor structure and the 200 days MA.
Previous candle closed a bearish engulfing or as Outside Bar pattern.
A close below 62$ will probably trigger selling towards 60$ and 58$ (final target zone)
Tomer, The MarketZone
This analysis is part of the Weekly Markets Analysis newsletters
To read more interesting technical reviews for the week goo.gl
To subscribe to the newsletters - goo.gl
Follow my blog - goo.gl
Subscribe to my Youtube channel - goo.gl

XLE... Hahaha Where will price go?:-) Pruhos?I might be wrong. :-) but not where I would be willing to buy either.,..


Energy sector ideaBuy on dip to 59-60 with a stop below rectangle support. Ride upward with 50 MA into 200 MA. Risk a buck for $4 upside. This one might not materialize after strong day today. Hands off if so.

XLE Energy SectorWhile its not a done deal, I would be lightening up in the energy sector. I Bearish Bat formation could be forming. Typically they go to 0.886 retracement. We are not there yet, but getting close. Volume is dropping off some. RSI is making a lower high. Look to get back in around $59. I wouldnt try to short this but I wouldn't be going long either. Neutral.


Two trading scenarios to monitor during FOMC week $XLE reached the final target zone of the last bullish setup I published for it.
AB=CD pattern was complete and now the price is testing a daily downtrend line.
As we will open FOMC week, the first thing to monitor is where the price is related to 63$ (current resistance structure zone).
If it'll be below it, we may see a short term pullback towards 60$ and potentially even to 58$.
If it'll close above the trend line, we may see it continue towards the 66$, there it'll meet the 200 days MA.
The two potential scenarios are shown in the chart.
I'd much rather see $XLE declines to levels that will allow me to buy it before the price's next bullish wave.
Tomer, The MarketZone
This analysis is part of the Weekly Markets Analysis newsletters
To read more interesting technical reviews for the week goo.gl
To subscribe to the newsletters - goo.gl
Follow my blog - goo.gl
Subscribe to my Youtube channel - goo.gl


$XLE - Energy sector looking for a jump?Perfect triangle formation in the making of $XLE
Breaking strong resistance today. Would be perfect if it closes above resistance.
If it does not jump tomorrow I'm going to look for lower entries.
Entry: 58.50
Target: 63.00
S/L: 53.80 (Gradually bringing it up as the trade goes)
If it goes under entry, will try to get some more shares at 56.00

Continues to climb towards 60$. This is what you have to watch$XLE continues to climb towards 60$
I was covering $XLE throughout the last month and mentioned the AB=CD pattern completion near 60$ that the price was aiming for.
Now, $XLE is struggling with the Fast SMA line that stands in its way and keeping it from reaching 58$ and 60$.
My focus now shifts to 59.5$ and 60$ as potential sell zones for a pullback move.
I'm still bullish Oil, but 60$ can lead to a 5-10% correction in the Energy sector with the two bearish harmonics combination.
Tomer, The MarketZone
Follow me on TradingView
Subscribe to my newsletters - goo.gl
Follow my blog - goo.gl
Subscribe to my Youtube channel - goo.gl
