XLE - Cracked longterm uptrend supportBig-cap oil has been lagging behind the broader energy market, particularly the correlation between AMEX:XLE and $WTI.
The break of this trendline is significant and could result in big move down for large-cap O&G.
Trade ideas

XLEEnergy wants to go higher.
Still some ways to go before the neckline line at 87.39 but the inverted H&S is showing

Will history repeat? XLE outperformed XLK in 2000In the year 2000, the energy sector represented by XLE outperformed the technology sector represented by XLK. The trend seems to be repeating itself as we witness the commodities boom occurring just as the tech boom slows down.
This begs the question, will history repeat itself?!
During the tech boom in the late 1990s and early 2000s, the technology sector was the most sought-after by investors. However, in 2000, the market saw a major shift as the energy sector, represented by XLE, outperformed the technology sector, represented by XLK. This shift occurred as the tech bubble burst and the commodities boom took over.
Fast forward to today, and we see a similar trend. As the technology sector has slowed down in recent months, the energy sector has seen significant gains. The rise in commodities such as oil and gas has driven the energy sector's recent outperformance.
While there are always unique factors at play in the market, the similarities between the current situation and that of 2000 cannot be ignored. It is possible that history will repeat itself, and we could see the energy sector once again outperforming the technology sector.

Ascending Triangle On The Daily Chart Ascending triangle on the daily chart w/ a strong setup for more upside contingent on a daily close above the ascending triangle resistance at $87.20.

XLE Energy Select Sector Price TargetAfter the Organization of the Petroleum Exporting Countries supply cut and considering the Elliott Wave Chart Pattern, i would say the next price target for XLE Energy Select Sector SPDR Fund is $92.60.
Looking forward to read your opinion about it.

Long XLE and XOP, wedge breakout Breakout based on OPEC's recent oil-cut by +1,6Mbpd
Good timing with the wedge tightening as well, great Risk here.

XLE closed below the critical lineDaily had a retest and got rejected. It could have more fluctuation around this area but likely more downside is ahead with in the next month.

$XLE - Weakness in the Energy Sector Could Bring Stage 4 DeclineThe Energy sector is notoriously one of the last to roll over in a recessionary environment and the $XLE chart appears to be topping out right on queue.
After a euphoric run beginning in the middle of 2020, the Energy sector has stalled out creating a triple top near the $90 level.
With the break of the 200-day moving average, along with an accompanying bearish momentum regime in the RSI, we expect the Energy sector to begin its descent into a Stage 4 decline.
Many individual stocks within the Energy sector look prime for capitulation events and accompanying sector weakness would further aggravate already anemic charts.
PT near 60.

XLE (Energy)In my last my post, I XLE should bounce off 82 and retest is daily 50sma; Since then we've dropped back to 82.
Holding 82 is important for bulls. You Never want to see a Sector lose .236 fib if your a bull... .236 is a reversal fib.
Right below 82 is XLE primary trendline since 2020 lows at 80$. If we break and close below 80 we are looking at bearish reversal with my first target 72$ gap close
If we bounce we still have breakover the most recent downtrend (White line) at around 85.50, if we breakover 85, then it's back to 93$ ...
Chart looks bearish IMO; like we're in final stages of distribution.
There's been RSI divergence since last May
Fib levels are from ATH and All time low

XLE - Minor Low Breakout XLE is in a sideways trend with market and Oil weakness.
Pro's - Darvas support, 200 propulsion, RAF Extreme, Vscore Extreme. L2 target is at 200prop.
Con's - Sideways R/Y trend.
Entry - $85.30
Profit - 50% range - $86.70
25% Stop Loss
21APR23 85 Calls

XLEChart looks 90% identical to the Dow jones .
Both are sitting right on Weekly support of its 50sma .
XLE bounced off its daily 200sma (Gold wave) , I think we will bounce and retest our 50sma (Purple wave)..
Stop loss is a close below 81

Week 6 - 2023 - Weekly S&P500 Sector AnalysisDiscussing all the major weekly trends for each sector.

$XLE vs $SPY: Rotation back into oil stocksI think this is the play right here, right now...Might be a nice swing to the upside for oil names, specially relative to the market.
Best of luck!
Cheers,
Ivan Labrie.

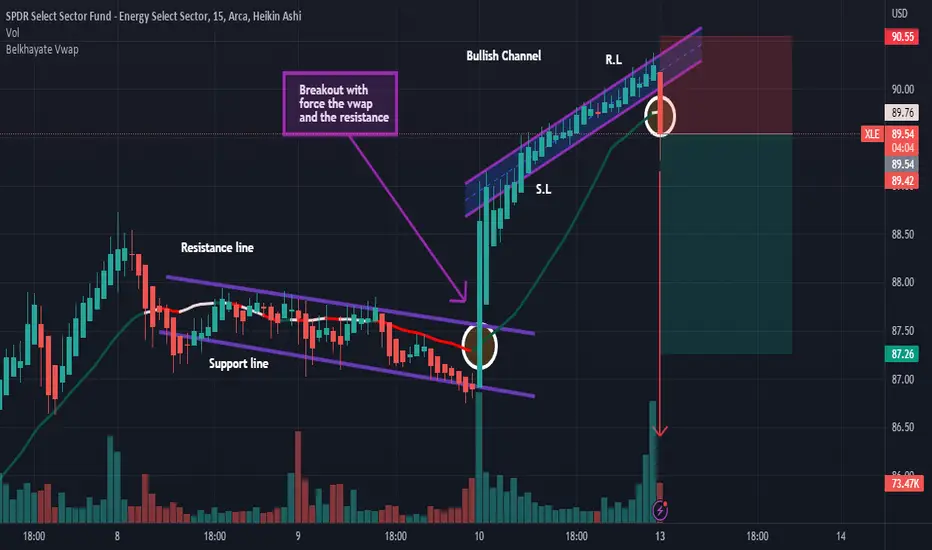
XLE: sell ideaOn XLE we will have a big probability of a downtrend after the breakout with force the support and vwap! Thanks!


XLE - the bigger short It's a controversial call to say energy prices are going to drop dramatically into next year but this is what the XLE chart is showing.
We're at a double top with monthly bearish RSI divergence, and the same structural trendline where it fell last time. My guess is it could get back down to 50. If it's a C leg it could happen faster than most would expect. 50 area would be a confluence of support - channel trendline and horizontal trendline, also IF a C leg comes, 50 is about 1.618 fib extension from the A leg.
This idea is invalid if XLE can hold above 102 on a monthly close. Good luck!

SPDR Select Sector Fund looking great for upside to $120Perfect Cup and Handle has formed with XLE.
We just need to wait for the crucial breakout and close above the brim level.
With moving averages, all is looking great with 7>21>200 - Green - Bullish
RSI - Buy divergence >50 - Bullish
Target 1 $120.00
GENERAL INFO:
The SPDR Select Sector Fund is a series of exchange-traded funds (ETFs) that are managed by State Street Global Advisors.
It is designed to track the performance of specific sectors of the S&P 500 index. There are 22 different funds covering sectors like Energy, Financials, Health Care, and Technology.
This is available as it's a cost-efficient way for investors to gain exposure to specific sectors of the market, without buying individual stocks.
This fund also gives an indication on the sentiment in general markets. Which looking at this analysis it's bullish and we can expect the markets to continue up in February. Fantastic!


Could $XLE be making a bear flag?A break and close below the ascending channel could mean that $XLE could be around $76.4 in the near future.
Some support areas to keep an eye on are $81.9 and $78.9.
One to keep an eye on!

energy in a pickleno really, this thing is set to roar. big rigs, big pigs, young hogs and motor fog. letterr rrrrrrip! were down near the bottom of the envelope, were way oversold, and the sectir is acting defensively in rotation with a bear market. id like to revisit the top of this rectangle and then dump again 🤷

XLE: A ZONE TO WATCH IN THE ENERGY SECTORSince October of 2022 we have seen an interesting zone form in the SPDR Energy Sector ETF. This zone is marked by the yellow rectangle in the chart. We noted four support bounces in this zone, a breakthrough of the zone, and two rejection bounces. This support/resistance zone is one to watch over the coming weeks. A rally into the yellow zone is one to watch closely for a potential rejection.
