JD Technical Outlook: Breaking out into JD Day!Structure and Pattern Recognition
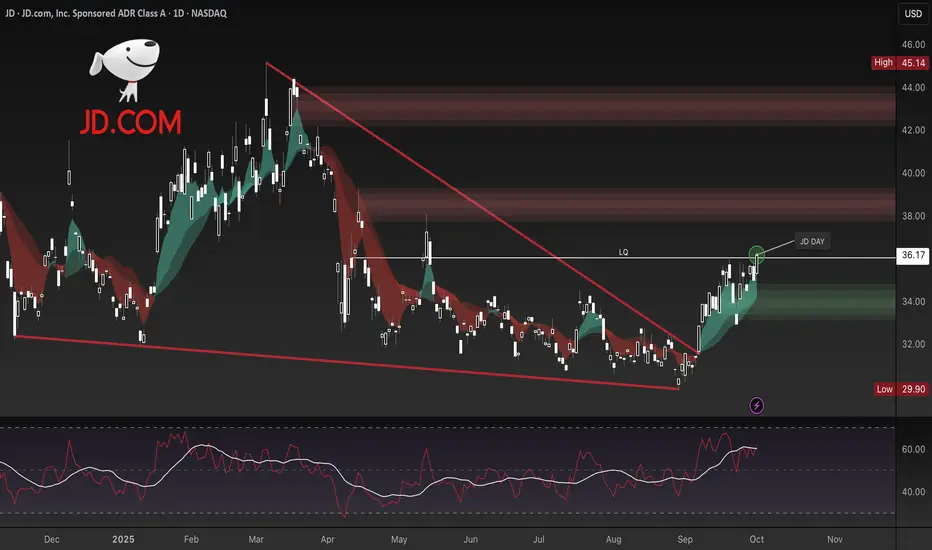
JD has recently broken out of a falling wedge structure, reclaiming strength after a prolonged downtrend. The breakout aligns with price now pressing against a key liquidity zone (LQ) near $36.00–$37.00, a level that previously capped multiple rally attempts. This breakout represents a meaningful shift in structure and suggests growing bullish momentum.
Key Catalyst – JD Day
The upcoming JD Day, one of the company’s largest annual sales and promotional events, often serves as a catalyst for both consumer activity and investor sentiment. Historically, this event has boosted short-term momentum as traders price in strong sales data and retail enthusiasm. With JD currently testing a breakout level, this fundamental catalyst could provide the spark needed to sustain upside continuation.
Key Levels and Setups
Current price sits at $36.17, directly testing resistance. A clean breakout above this level opens the door toward the next liquidity clusters around $39–$40 and potentially $42+ if momentum builds. Failure to hold above $35, however, risks a pullback into the $33–$34 demand zone before any sustained rally can take hold.
Volume and Momentum
Volume has been steadily increasing during the breakout, suggesting conviction behind the move. Momentum indicators remain supportive, with RSI holding strong near the upper mid-range without flashing overbought extremes. This indicates room for continuation if the catalyst delivers.
Outlook and Scenarios
Bullish Case: Break and hold above $36–$37 during JD Day would validate the wedge breakout, targeting $39–$42 in the near term.
Bearish Case: Failure to break above $36 or a rejection post-event could lead to a retracement back into $33–$34, with risk of retesting $30 if momentum fades.
Conclusion
JD is entering JD Day at a critical technical juncture. The breakout from a falling wedge provides a constructive base, while the event itself could act as a near-term catalyst to push price into higher supply zones. Traders should monitor the $36–$37 level closely, as it will likely dictate the next major leg of movement.
013A trade ideas
JD 1D: Bulls taking the lead?On the daily chart, JD.com broke out of a falling wedge, moving above both MA50 and MA200. That’s a strong technical signal hinting at a potential mid-term trend reversal.
Upside targets are mapped at $39.8 and $46, with Fibonacci levels suggesting a possible extension toward $52 if momentum holds. Support remains around $33–35, and as long as the price stays above it, buyers are in control.
From a fundamental perspective, JD continues to reshape its business, expand online services, and benefit from China’s economic recovery. Competition with Pinduoduo and Alibaba is tough, but technically bulls seem to have the upper hand.
Tactical outlook: watch the MA200 - staying above it keeps the growth scenario intact.

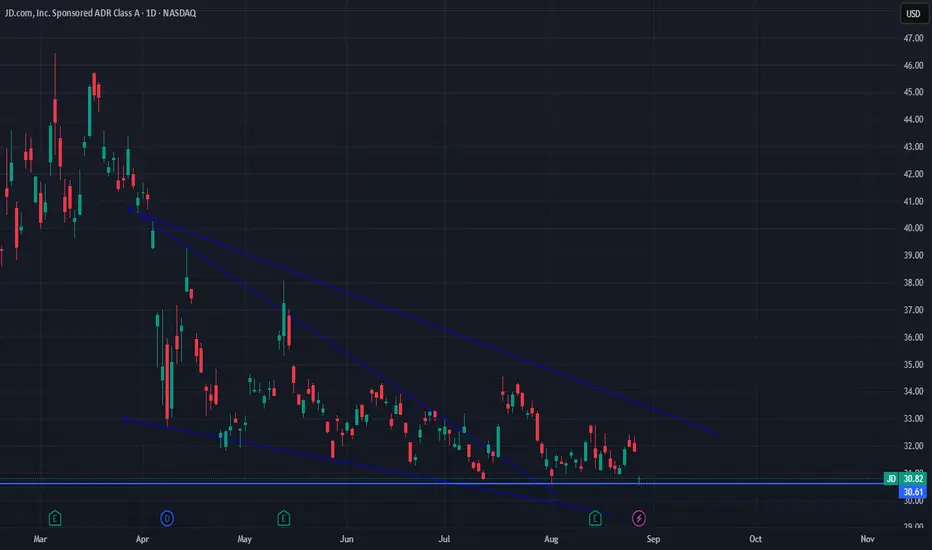
JD Potential LOW Risk HIGH RewardJD is potentially setting up for what may be a reversal pattern here after a brutal downtrend which wiped out 80% of this company over the last year.
Currently, this stock is showing signs of a technically bounce as we begin to hover higher while changing market structure , bouncing at the key 618 retracement zone as well as the VWAP from the low.
I like this setup for a rise to take out some poor highs (lack of liquidity sweep) in the areas I have marked, with the high being an 3rd degree Elliott wave pushing the expansionary phase into the 1.618 extension.
Very tight stop here, relatively low risk for a high reward trade. I will take that any day of the week.
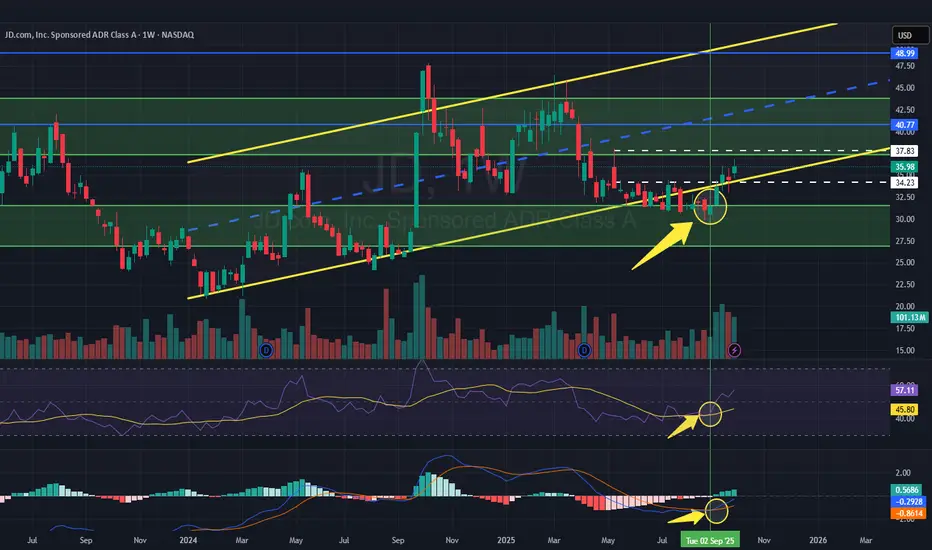
Here are my thoughts on $JDNASDAQ:JD looks to have put in a strong bottom near the yellow channel low. 3 Doji Candles in row for the last 3 weeks... + RSI momentum shift + MACD bullish cross + volume increasing..... all point to potential swing toward the pivot point ($40–42) and potentially the channel top ($48–49) if bulls step in (long term) will be interesting to see what happens. (there was a reason i alerted NASDAQ:JD calls the other day that opened up ITM today in my free discrd.... I SAW CALLS FLOWING INTO IT.....) Thoughts? Anyone else eyeing NASDAQ:JD ?
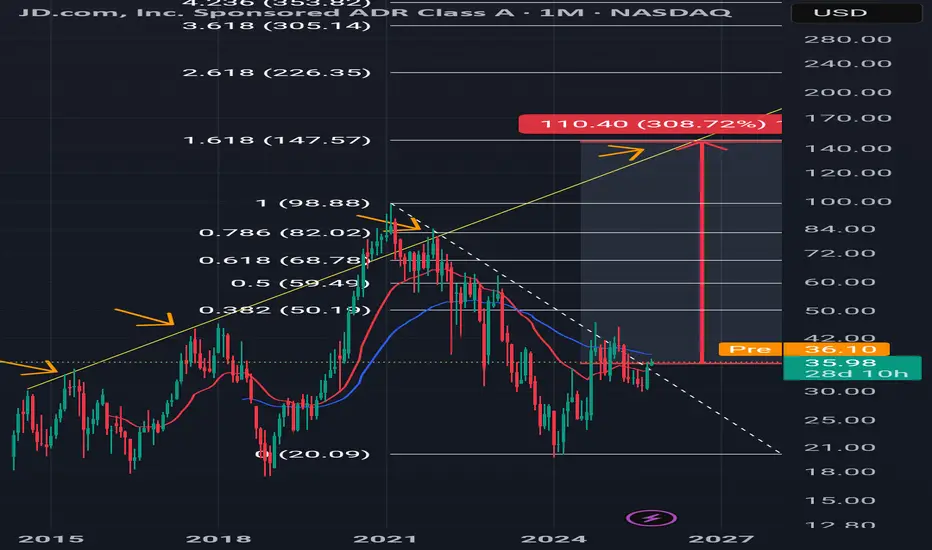
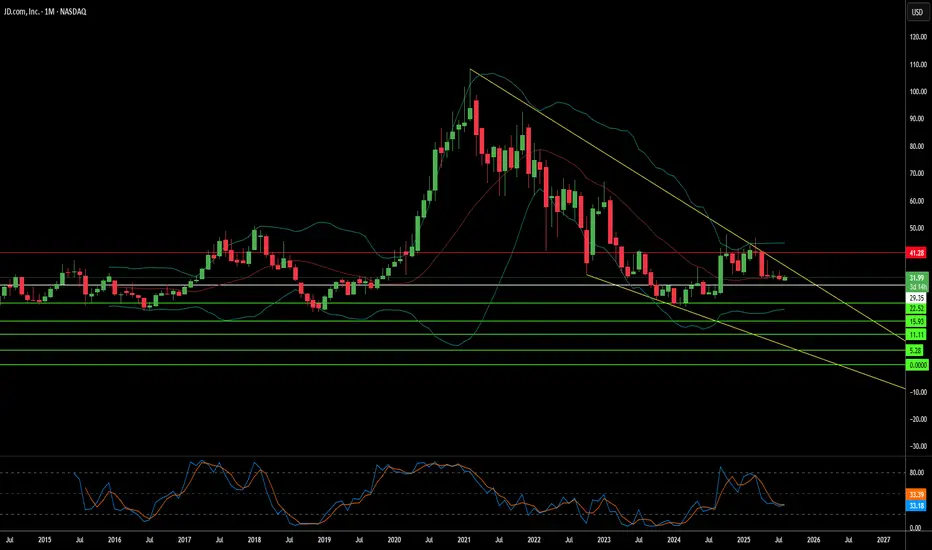
$JDInteresting oberservation, all the previous rallies on fib fall exactly at 1.61 or 2.61 before retracing back to the lows. If we map in the similar trend on the current chart that comes exactly as 1.61 around 140/145 range which is a 3X from here and also comes in direct contact of the past trend line. This is not something unrealistic in this market considering everything has rallied massively and JD being the giant of the giants in China still hasn't moved at all. Is it a delayed rally to leave out the weak hands or is it just fantasy talk?
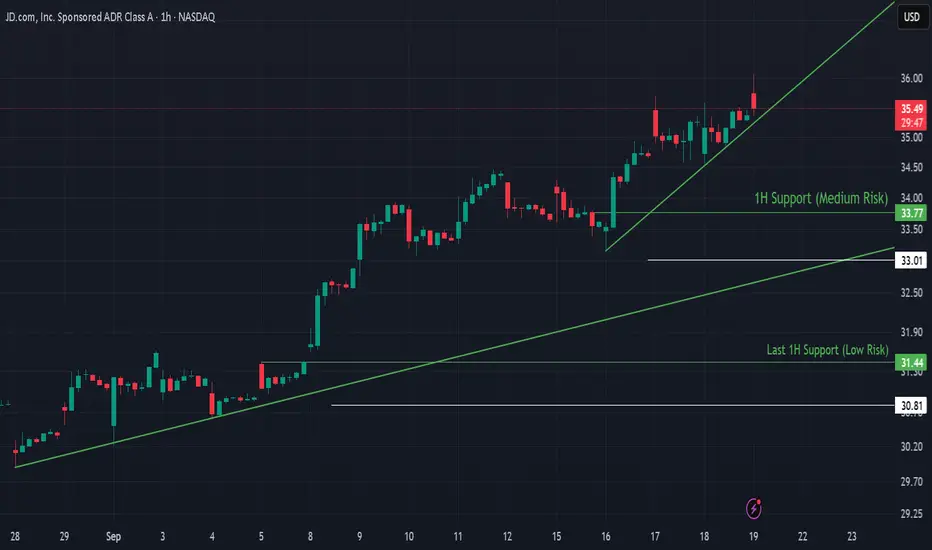
JD.com Building an Uptrend After Tariff-Driven DropJD.com (JD) has been recovering strongly after a sharp decline to $29.90 triggered by tariff war concerns. The stock is now building an uptrend, showing momentum with higher lows and stacked support levels.
🔍 Technical Analysis
Current Price: $35.65
Recent recovery followed a steep sell-off bottoming at $29.90.
Structure: Clear short-term uptrend with medium and low-risk support zones.
🛡️ Support Zones (if pullback occurs):
🟢 $33.77 | Stop-loss: $33.01 (Medium Risk 1H Support)
🟡 $31.44 | Stop-loss: $30.81 (Low Risk, Last 1H Support)
🧭 Outlook
Bullish Case: If JD maintains above $33.77, continuation toward $37+ is likely.
Bearish Case: A break below $31.44 could shift momentum back toward $30.
Bias: Bullish while above $33.77.
🌍 Fundamental Insight
Tariff war headlines pressured JD to multi-month lows, but stabilizing trade sentiment and recovering Chinese consumer demand are improving sentiment. However, investors remain cautious around macro headwinds and regulatory risks.
✅ Conclusion
JD is carving an uptrend after a deep tariff-related correction. Holding above key supports keeps the bullish recovery intact.
If you find this content useful, don’t forget to like & follow for more structure-based insights.
New Setup : JDThe daily chart crushed against the ema 200 with bullish EMA and price action. An action higher may lead the price to a +30%
Ready To Catch it !

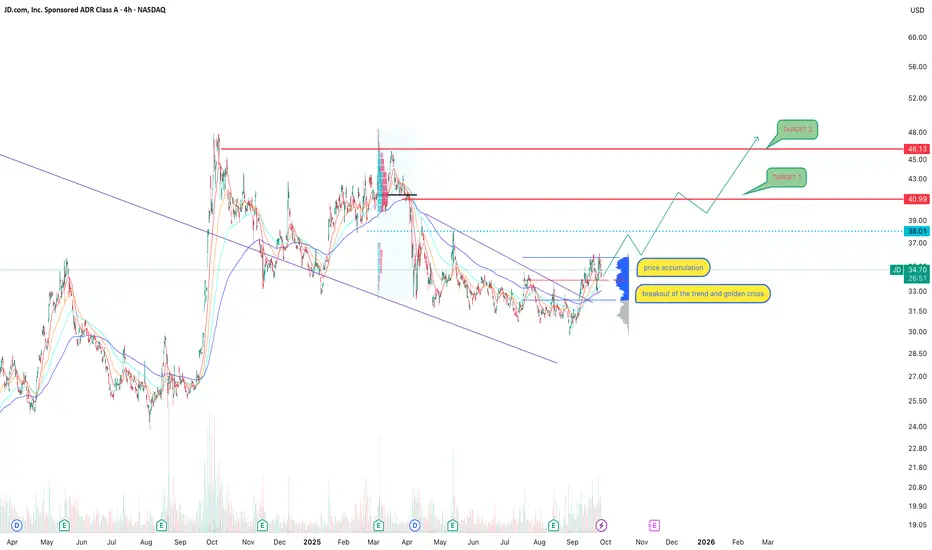
JD.com: accumulation, golden cross, and a chance to restart JD.com remains one of China’s largest e-commerce players, and despite macroeconomic headwinds, the company continues to hold its ground. Fundamentally, JD is focused on optimizing logistics, cutting costs, and expanding its cloud segment. Government policies aimed at boosting domestic demand also provide support. Risks remain tied to China’s economic slowdown and fierce competition from Alibaba and PDD, but at current levels the stock looks attractive for long-term investors.
Technically, the 4H chart shows a breakout of the descending trendline and the formation of a golden cross (50 EMA crossing above 200 EMA), confirming a medium-term trend shift. Price has consolidated above the accumulation zone and is now testing $34.50–35.00. If momentum holds, the next upside targets are $41.00 and $46.00, key resistance levels. A more conservative scenario involves a pullback toward $33.00–32.50, followed by another upward leg.
This is exactly the kind of market situation where investor expectations diverge from reality, and the longer it lasts the more it seems like a trend reversal is near. But as always, emotions must be set aside and clear signals awaited before committing.
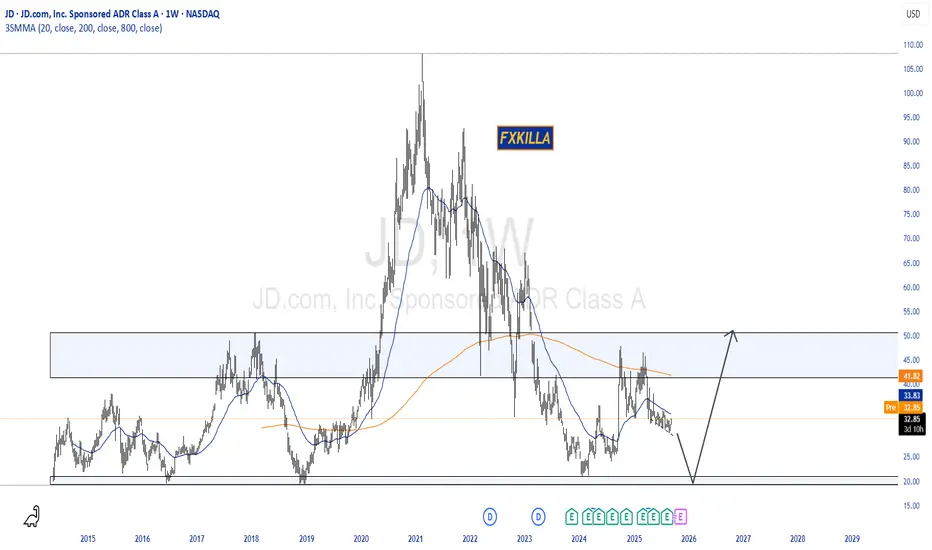
JD - Good area to go longJD is a lagger when compared to BABA.
This is in a good buy zone now.
Technical -
- Wave 3 just started
- Held good in the value area around 30
- Held above 50 WMA
- Weekly Bull Flag
Long anywhere here (My avg is 35)
Target 1 - 43 -- Tough one, once this is clear, we can see some momentum
Target 2 - 52
Target 3- 61
Target 4- 71
Stop Loss - 30

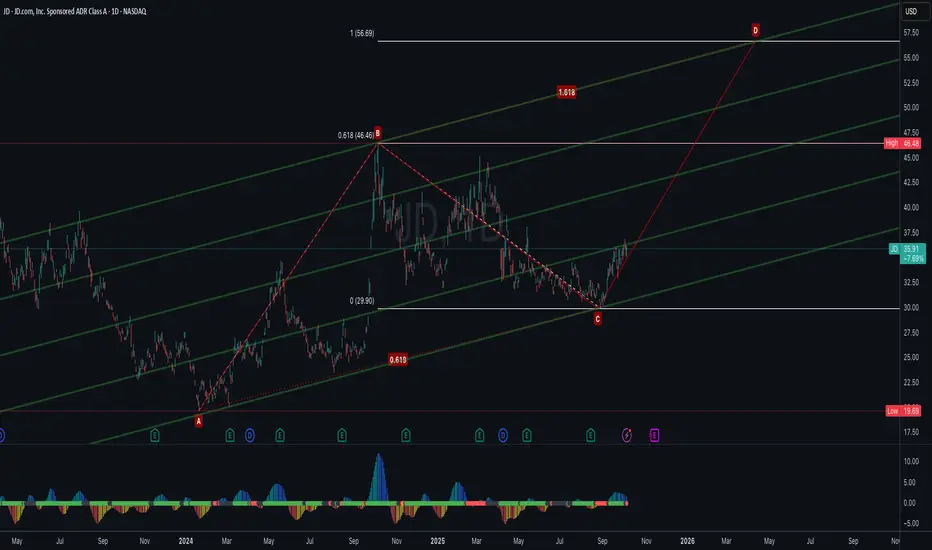
JD.com Bullish ABCD Harmonic Pattern SetupJD.com (JD) is forming a bullish ABCD harmonic pattern, with the current price advancing from point C toward the projected D completion zone. Based on the Fibonacci measurements, the AB=CD projection and 1.618 extension align near $56–57, suggesting a strong potential target area and confluence with the upper channel resistance.
A sustained move above $46.5 (B point) would confirm the continuation toward the D leg target. Momentum indicators are gradually turning positive, supporting the bullish bias in this setup.
Invalidation:
If price reverses and breaks below the C point, the ABCD harmonic structure would be invalidated, signaling potential weakness or a deeper retracement.
JD LONGChina stocks on the rise, JD looking like price action and volume in harmony with moves higher, $40 Target Soon, Lets hope china/trump admin come out with a deal this weekend.

LONG JD E.M. look stable and JD looks based. trying my hands at a long. low conviction. i just dont sync with chinese candles.
OCT 17TH '25 35 STRIKE
glhf not financial advice.

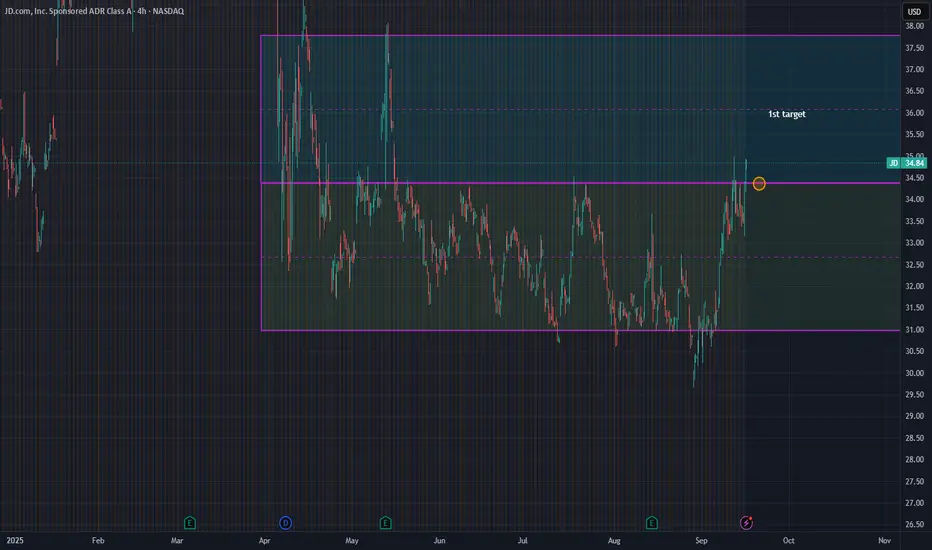
Possible $JD Entry on retest of balanceIf JD can hold a retest of balance, will look to long around 34.50 with a first target at 36 (halfback of upper balance).
JD HIGH PROBABILITY SETUP SOON!!!🚨 JD HIGH PROBABILITY BUY SETUP 🚨
* Here We Can See Clearly The Next Potential Move For JD Coming Hours/Days.
* Keep Your Eyes Close On Your Trading Positions.
* Happy PIP Hunting Traders.
FXKILLA.
100% SURE PLAY ON JD.COM - CHINA IS ON FIRE! JD.com has just delivered a major technical breakout:
✅ The old bearish trendline has been broken after years of pressure.
✅ Price is now supported by the bullish trendline and reclaiming strength.
✅ Fibonacci extension points directly to a strong take profit zone between 47–68 USD.
✅ Weekly MACD cross = a big bullish signal confirming momentum shift.
China’s tech sector looks ready to ignite, and JD.com is showing one of the strongest reversal setups in years.
This is a high-conviction long play with clear upside potential.
🚀 My view: JD.com = multi-month bullish run ahead.

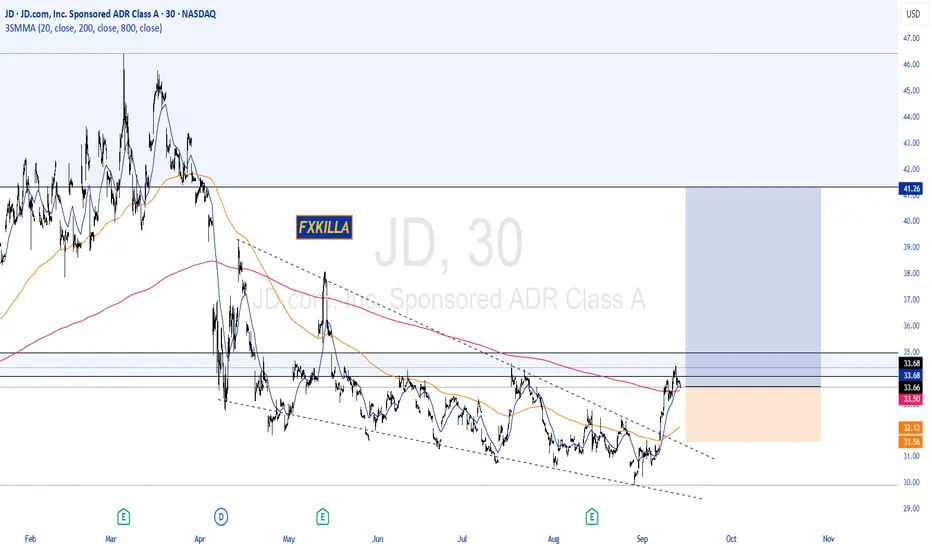
JD HIGH PROBABILITY SETUP SOON!!!🚨 JD HIGH PROBABILITY SELL SETUP 🚨
* Here We Can See Clearly The Next Potential Move For JD Coming Hours/Days.
* Keep Your Eyes Close On Your Trading Positions.
* Happy PIP Hunting Traders.
FXKILLA.
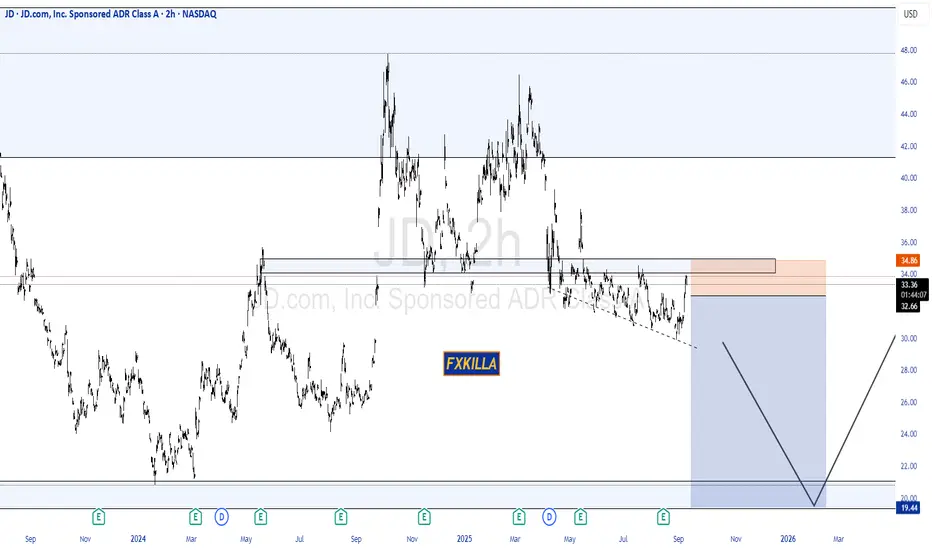
JD HIGH PROBABILITY SETUP SOON!!!🚨 JD HIGH PROBABILITY SELL/BUY SETUP 🚨
* Here We Can See Clearly The Next Potential Moves For JD Coming Hours/Days.
* Keep Your Eyes Close On Your Trading Positions.
* Happy PIP Hunting Traders.
FXKILLA.
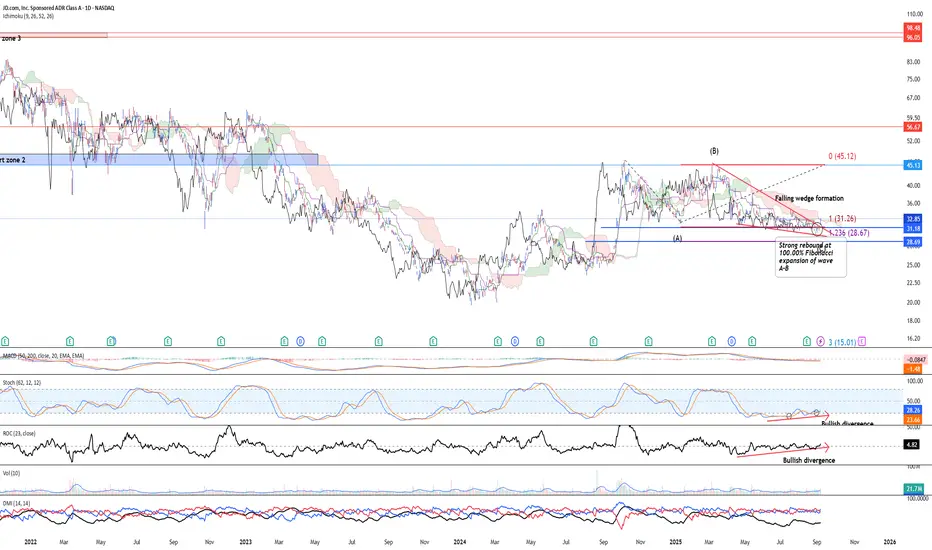
Strong reversal ahead for JDNASDAQ:JD is looking at a potential break to the upside after a strong rebound at 100.00% Fib expansion level and recent rebound also see a break above the falling wedge formation. Momentum indicator such as stochastic and roc saw positive bullish divergence. IChimoku saw two out of three potential bullish crossover.
Near-term target price is at 38.00 and long-term target is looking at 65.00
How to spot market reversals. JD LongPersonal thoughts, not investment advice or anything of the sort.
On the monthly we have a solid down trend and what looks like to be the beginning of a hammer candle forming for the rest of August, however when you scroll in on lower time frames, you can see that on the weekly, we were in a down trend from October of 24, making lower highs lower lows.
Since the down trend channel of March of 2025, we have been grinding lower the entire time, following the same downtrend since October, however you can see a huge spike before earnings came out in July of 2025, then price retraced that big buy. Do big players know something that we don't?
Scrolling in even on the daily you have a doji candle that did wick through again. However, scrolling even further down into the 1 hr, you can see that price is slightly above all 3 lows, indicating that a shake out has occurred.
If we wick lower for the rest of August, I would personally (not financial advice) cancel the trade idea.
This trade idea is very simple.
Stop loss below $30.
Target #1 $55
Target #2 $85.62
Can Strong Fundamentals Survive Geopolitical Storms?JD.com presents a compelling paradox in modern investing: a company demonstrating robust operational performance while its stock remains volatile due to factors entirely beyond its control. Despite market speculation about decline, JD.com has shown impressive financial resilience with consistent revenue growth—15.8% in Q1 2025 and 22.4% in Q2 2025 - alongside improving operating margins that reached 4.5% for JD Retail in Q2 2025. The company has strategically invested over RMB 75 billion in R&D since 2017, building a sophisticated logistics network spanning over 3,600 warehouses and developing cutting-edge technologies that have reduced fulfillment costs to a world-leading 6.5%.
However, JD.com's strong fundamentals exist within a challenging ecosystem of domestic and international pressures. China's deflationary environment, with CPI rising only 0.2% in 2024, has created subdued consumer demand, while intensifying competition from disruptors like Pinduoduo has reshaped the e-commerce landscape. Rather than engaging in destructive price wars, JD.com has pivoted toward sustainable profitability, leveraging its premium brand reputation and proprietary logistics network as key differentiators in an increasingly crowded market.
The most significant risk facing JD.com - and all US-listed Chinese companies- is geopolitical uncertainty rather than operational weakness. US-China trade tensions, regulatory crackdowns in both countries, and the specter of potential Taiwan conflict scenarios create unprecedented risks for investors. A hypothetical Taiwan invasion could trigger catastrophic sanctions, including SWIFT banking exclusions and forced delistings, potentially rendering these stocks worthless regardless of their underlying business strength. This analysis reveals that Bloomberg Economics estimates such a conflict would cost the global economy $10 trillion, with Chinese companies facing existential threats to their international operations.
The JD.com case study ultimately illustrates a new reality in global investing: traditional financial analysis focusing on revenue growth and operational efficiency may be insufficient when evaluating companies operating across geopolitical fault lines. While JD.com remains operationally strong with clear competitive advantages, investors must recognize they are essentially placing bets on US-China diplomatic stability rather than just corporate performance. This political risk premium fundamentally changes the investment equation.
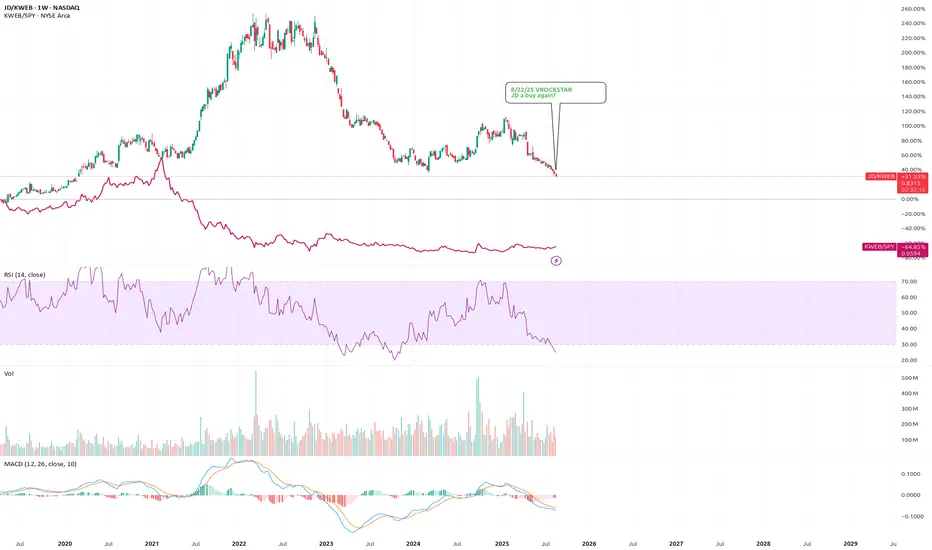
8/22/25 - $jd - JD a buy again?8/22/25 :: VROCKSTAR :: NASDAQ:JD
JD a buy again?
- nearly 15% fcf
- in itself that's not "yay, so obvious" we all know this. that's about "par" for the chinese fare these days, but the point is this:
- we have kweb starting to find a bid on its SPY pair (see maroon line on chart), then the bars here are JD on it's KWEB pair show it's at a 5 year low
- recent results good
- trump loves china (let's be real)
- market now bid after papa powell
- what's not to like
- am i over thinking this?
V
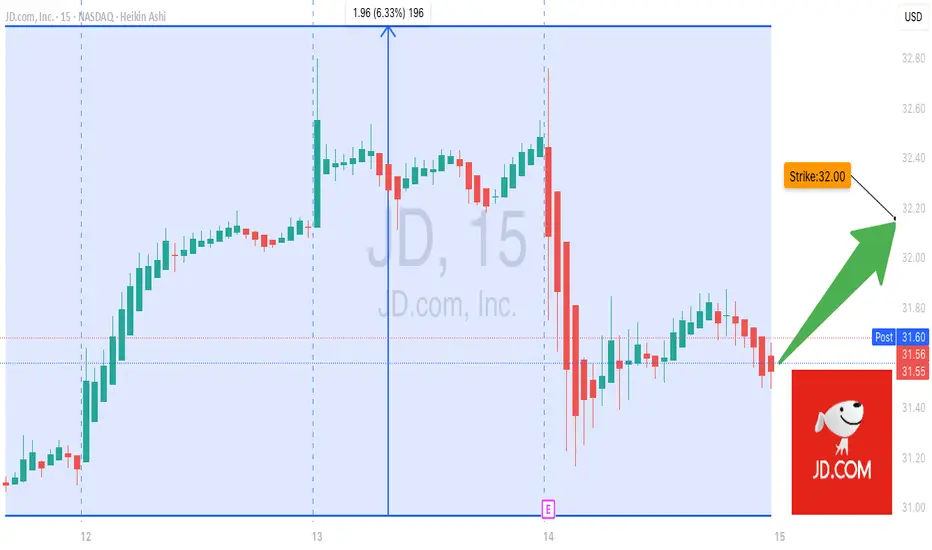
Don’t Sleep on JD! $32 Calls Set to Explode
## 🚀 JD.com \$32 Calls – Earnings Bullish Play!
**Sentiment:** 🟢 *Moderate Bullish (75% Confidence)*
* **Revenue Momentum:** 15.8% TTM growth – strong e-commerce demand
* **Margins:** Profit 3.8%, Gross 9.9% – operational efficiency under pressure
* **Earnings Beat History:** 100% over past 8 quarters
* **Options Flow:** Heavy bullish call activity at \$32 strike – institutional interest rising
* **Technical Indicators:** RSI 39.24 (oversold), trading above 20-day MA
* **Key Levels:** Resistance \$33.50, Support \$31.50
* **Macro:** China stimulus + logistics advantage = tailwinds
* **IV & Volatility:** IV Rank 75% – moderate volatility expectations
---
### 📊 **Trade Snapshot**
* **Type:** CALL (Long)
* **Strike:** \$32.00
* **Expiry:** 2025-08-15
* **Entry Premium:** \$0.30
* **Profit Target:** \$0.90 (+200%)
* **Stop Loss:** \$0.15 (50%)
* **Size:** 1 contract
* **Entry Timing:** Pre-earnings close
* **Expected Move:** 5%
---
### 💡 **Strategy Notes**
* Limit exposure to 2% of portfolio due to binary earnings risk.
* Close within 2 hours post-earnings if stop or profit target not met.
* Profit target exit: shares above \$34.00
* Stop loss exit: shares below \$31.50
---
📌 *Strong fundamentals + bullish options flow + oversold technicals = high-conviction earnings play!*
**#JD #EarningsPlay #CallOptions #ChinaEcommerce #HighConviction #OptionsTrading #PreEarnings #AMC #VolatilityPlay #TradingSignals**
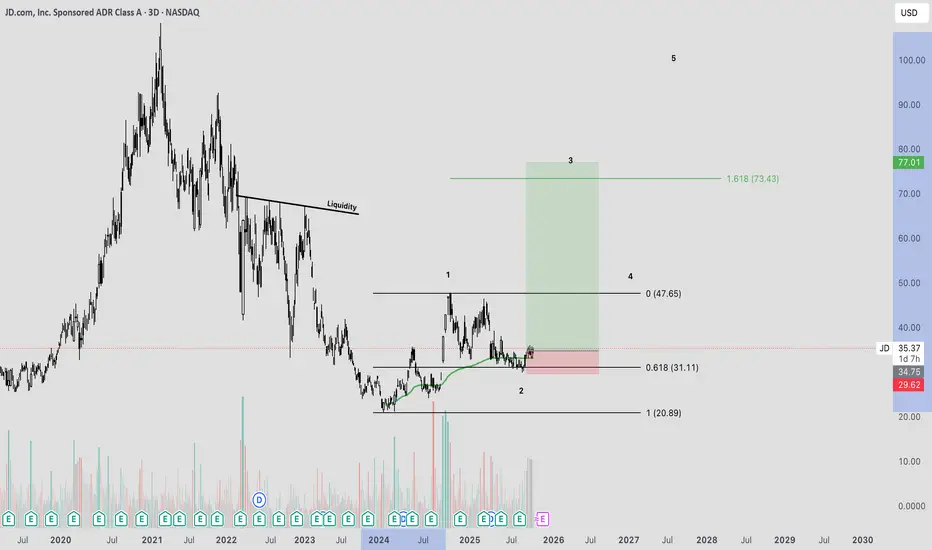
JD last correction is overSince fiscal stimulus announced by China, JD started to print an expanding diagonal which I labeled in black as 1-2-3-4-5. Currently, wave 4 is over (or will be over within a few days) and wave 5, the longest in such a type of diagonal, is set to unfold.
Which supportive evidence I found:
wave 4 is formed as a double three as (w)-(x)-(y) and (y) contains and ending diagonal - see green impulsive wave down. The diagonal's wave 5 reached the lower edge.
wave 4 retraced 61.8% of wave 3
wave can be seen as a bullish flag - it nicely fits into the channel (I showed in green)
both RSI and MACD show bullish divergence with price on daily
I believe JD will revert with strong impulse up in the coming days.
See divergences:
