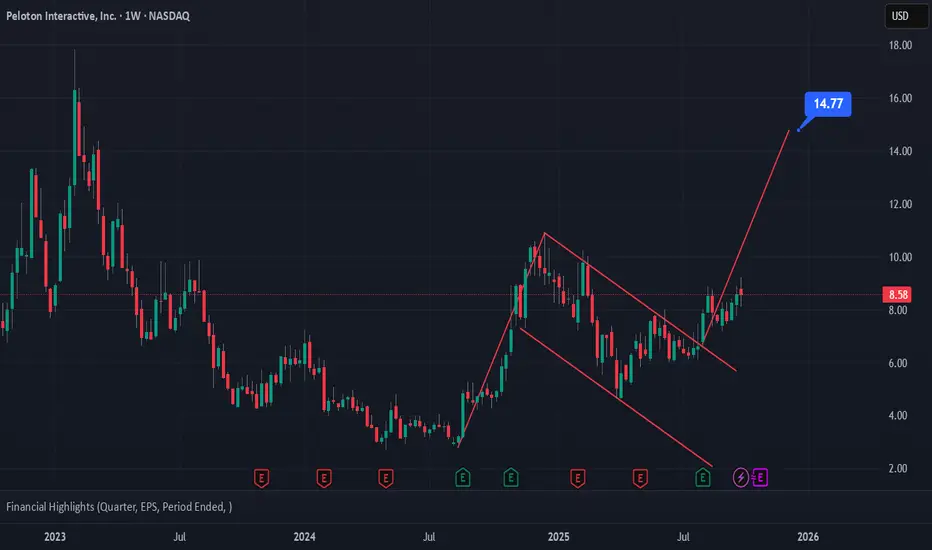
Peloton (PTON) Weekly — Bullish Flag Breakout Targeting $14.77Peloton (PTON) is forming a clean bullish flag pattern on the weekly timeframe. The price broke out from the downward channel, suggesting the continuation of the prior bullish impulse.
Pattern: Bullish flag breakout
Breakout Confirmation: Above $8.00
Current Price: ~$8.58
Target Levels: $13.80 and $14.77
Support Zone: $7.00–$7.50
Invalidation: Below $7.00
If momentum continues, a move toward $14.77 looks achievable in the coming weeks as price resumes its prior uptrend.
📈 Bias: Bullish continuation
⏰ Timeframe: Weekly (1W)
Trade ideas
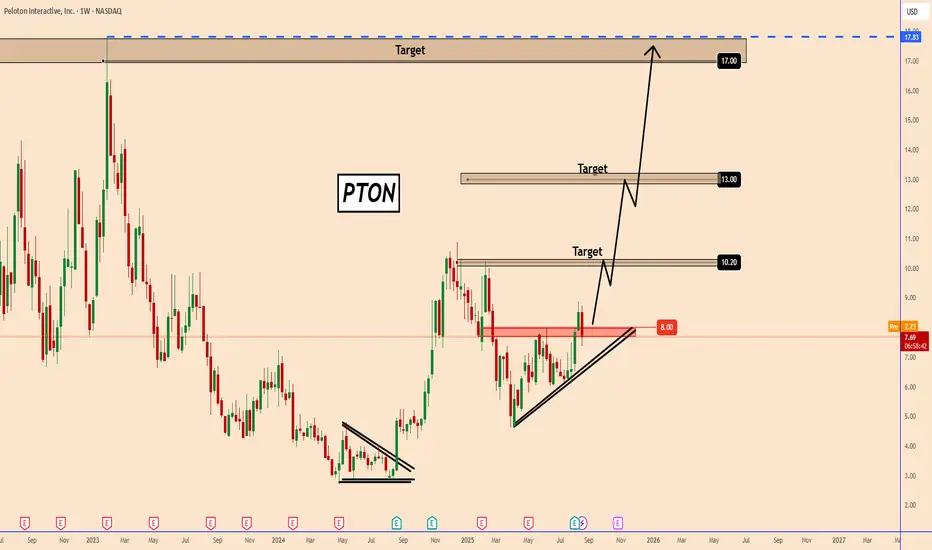
Peloton (PTON): Can Bulls Ride Toward $17?Peloton (PTON): Can Bulls Ride Toward $17?
Peloton is showing signs of life after months of consolidation. With price action breaking above the $8.00 resistance and forming a bullish pattern.
The breakout above $8.00 confirms bullish intent. A sustained close above $8.00 could attract swing traders and institutions. A breakdown below the pattern's lower trendline would invalidate the setup and suggest a return to range-bound behavior.
Peloton’s chart is offering a clean bullish setup with well-defined targets. While $10.20 is the first hurdle, the structure hints at a possible run toward $13.00 and even $17.00 if momentum builds.
🎯 Target Zones
$10.20
$13.00
$17.00
You may find more details in the chart!
Thank you and Good Luck!
PS: Please support with a like or comment if you find this analysis useful for your trading day

PTON Squeeze 2.0?Its Christmas Eve today, and Santa Powell is likely voting today to lower rates. By how much? Depends on the proportion of slurs / message in your favorite discord serve, but I'm leaning towards the standardized view of 0.25. If we get anything above, or below for that matter, expect to have your hair blown back.
That being said, PTON was an overpriced COVID darling running off of hot air fueled by everyone pretending an exercise bike with an iPad screen wasn't going to become a clothing rack. As of today, it has a short interest of 18%, price to sales of around 1, and a demolished market cap relative to 2020/2021.
I see PTON pushing out of this gutter and back to a $10B valuation with haste. They're working on profitability and the metrics i've mentioned look solid.
Listen, If i know anything right now its that we're about to see the most intense two quarters in recent memory. I do wish you well in this phase because it may very well be the end of the road for this bubble. But what do I know.
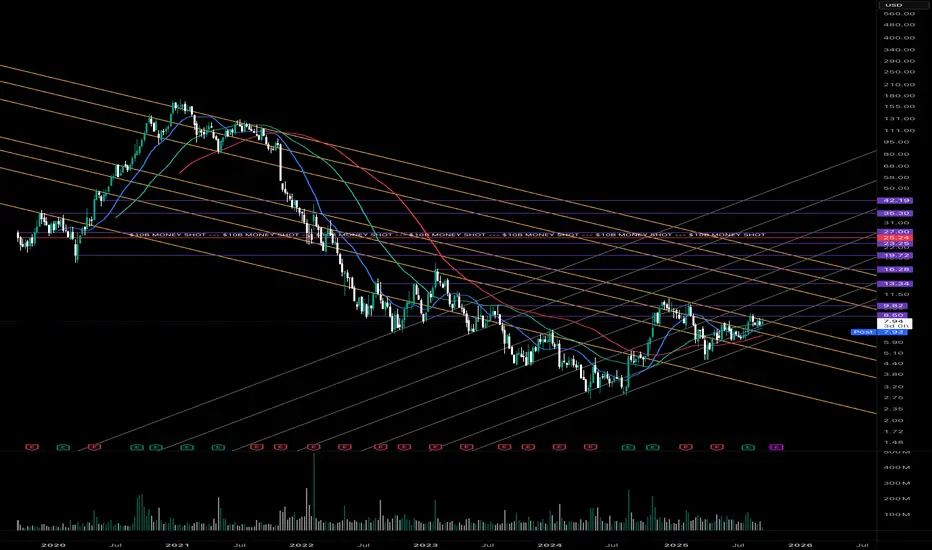
PTON: Structural Reversal in Progress?PTON's price action has triggered a quarterly MSB setup, indicating a probable bullish expansion. A trendline is also due for a retest, presenting an excellent low-risk opportunity for a discounted entry.
There is a key observation zone between $15 and $17, which may act as resistance. This level represents the equilibrium point of a quarterly bearish breaker, and reclaiming this region is crucial for reversing the prevailing downtrend.
Notably, the initial algorithmic targets of the candle currently governing price action are in confluence with the critical level mentioned above. However, it is expected that at least two algorithmic channels will be tested in the near future.
Not financial advice.
Peloton (PTON): Can Bulls Ride Toward $17?Peloton (PTON): Can Bulls Ride Toward $17?
Peloton is showing signs of life after months of consolidation. With price action breaking above the $8.00 resistance and forming a bullish pattern.
The breakout above $8.00 confirms bullish intent. A sustained close above $8.00 could attract swing traders and institutions. A breakdown below the pattern's lower trendline would invalidate the setup and suggest a return to range-bound behavior.
Peloton’s chart is offering a clean bullish setup with well-defined targets. While $10.20 is the first hurdle, the structure hints at a possible run toward $13.00 and even $17.00 if momentum builds.
🎯 Target Zones
$10.20
$13.00
$17.00
You may find more details in the chart!
Thank you and Good Luck!
PS: Please support with a like or comment if you find this analysis useful for your trading day
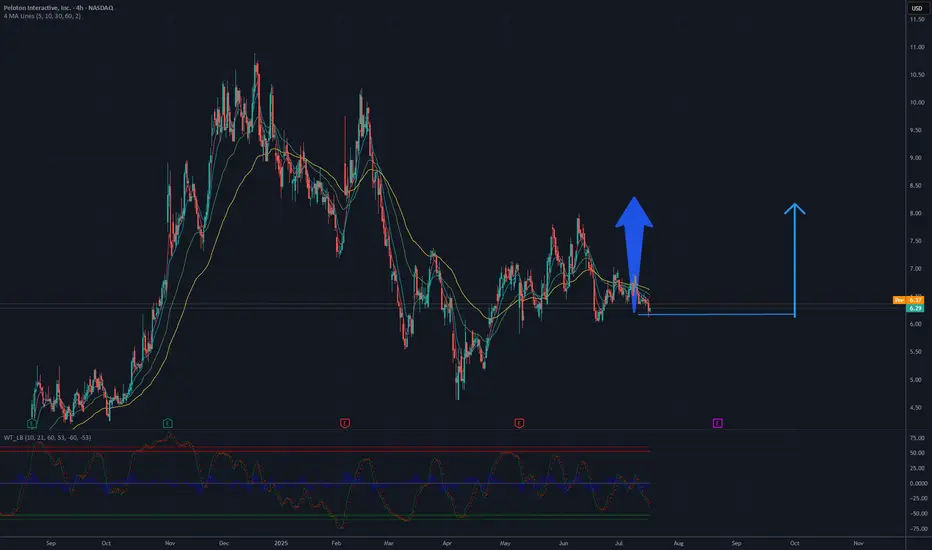
It's a time for Peloton Interactive, Inc. (PTON)-Target 8.20 $The chart analysis for Peloton Interactive, Inc. (PTON) suggests a potential rise with a target of 8.20 USD. The 4-hour chart indicates a recent downtrend from a peak around 10 USD, with the current price stabilizing near 6.30 USD. A key support level is observed around 6 USD, which could provide a strong base for an upward move. The 50-day and 200-day moving averages are converging, hinting at a possible trend reversal if buying pressure increases.
Breaking through the resistance at 6.50-6.70 USD, a recent consolidation zone, could trigger a rally. With rising volume and bullish candlestick formations, the price may aim for 8.20 USD, a significant resistance level based on prior highs. The RSI, currently in oversold territory, could support this upward movement if it starts to recover, indicating renewed momentum. However, a drop below 6 USD support could invalidate this outlook and lead to further declines.
Potential TP: 8.20 USD
PTON is staging a potential long-term rebound. NASDAQ:PTON is looking very strong upside after it has broken out of the major downtrend line which started in Feb 2021 and the recent rebound was seen rebounding off strongly above 61.8% Fibonacci retracement level. NeXT, the stock is building up very aggressive uptrend channel with recent bullish morning star in the midst. Inverted head and shoulder is close to completion and prices have trend above all ichimoku indicators.
Long-term MACD is back to the neutral phase. Mid-term stochastic rose steadily, indicating healthy mid-term upside momentum and short-term 23-period ROC has rebounded above the zero line.
Volume remain healthy and Directional Movement index is showing early signs of bullish strength.
Target remain is at 13.20.

$PTON - LongNASDAQ:PTON in lower time frames is reversing. If momentum to upside continues, this would be a good trade for short-term.
* First Entry: $7, targeting the daily supply around ~$7.75
* Second Entry: ~$6, if price continues lower, with the same $7.75 targe if the first entry doesn't reach it.

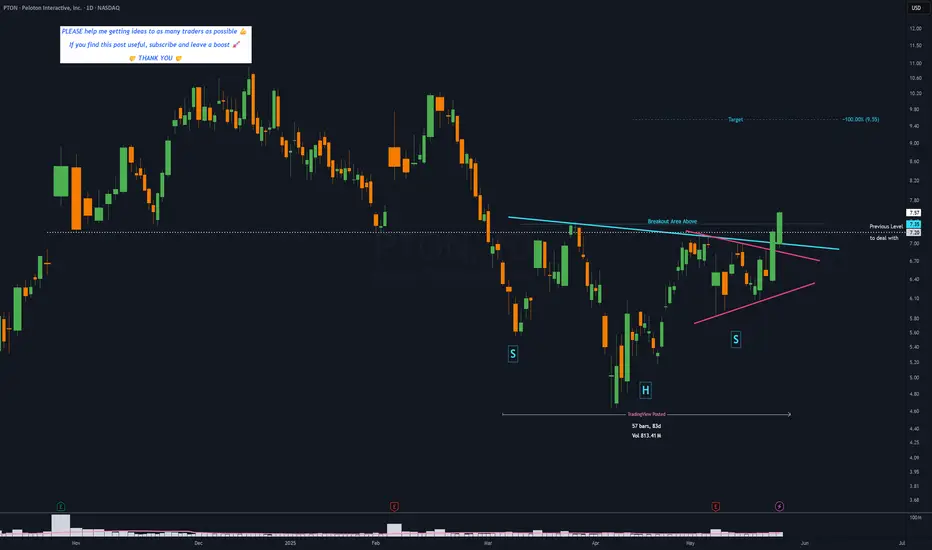
PTON - 3 months HEAD & SHOULDERS══════════════════════════════
Since 2014, my markets approach is to spot
trading opportunities based solely on the
development of
CLASSICAL CHART PATTERNS
🤝Let’s learn and grow together 🤝
══════════════════════════════
Hello Traders ✌
After a careful consideration I came to the conclusion that:
- it is crucial to be quick in alerting you with all the opportunities I spot and often I don't post a good pattern because I don't have the opportunity to write down a proper didactical comment;
- since my parameters to identify a Classical Pattern and its scenario are very well defined, many of my comments were and would be redundant;
- the information that I think is important is very simple and can easily be understood just by looking at charts;
For these reasons and hoping to give you a better help, I decided to write comments only when something very specific or interesting shows up, otherwise all the information is shown on the chart.
Thank you all for your support
🔎🔎🔎 ALWAYS REMEMBER
"A pattern IS NOT a Pattern until the breakout is completed. Before that moment it is just a bunch of colorful candlesticks on a chart of your watchlist"
═════════════════════════════
⚠ DISCLAIMER ⚠
Breakout Area, Target, Levels, each line drawn on this chart and any other content represent just The Art Of Charting’s personal opinion and it is posted purely for educational purposes. Therefore it must not be taken as a direct or indirect investing recommendations or advices. Entry Point, Initial Stop Loss and Targets depend on your personal and unique Trading Plan Tactics and Money Management rules, Any action taken upon these information is at your own risk.
═════════════════════════════
Long Trade Setup Breakdown for (PTON) 30 Mins📊
🔹 Asset: Peloton Interactive, Inc. (PTON)
🔹 Timeframe: 30-Min Chart
🔹 Setup Type: Rising Wedge Breakout
🚀 Trade Plan (Long Position):
✅ Entry Zone: $10.14 (Breakout Confirmation)
✅ Stop-Loss (SL): $9.74 (Below Support)
🎯 Take Profit Targets (Long Trade):
📌 TP1: $10.64 (First Resistance)
📌 TP2: $11.11 (Extended Bullish Target)
📊 Risk-Reward Ratio Calculation:
📈 Risk (Stop-Loss Distance):
$10.14 - $9.74 = $0.40
📈 Reward to TP1:
$10.64 - $10.14 = $0.50
💰 Risk-Reward Ratio to TP1: 1:1.25
📈 Reward to TP2:
$11.11 - $10.14 = $0.97
💰 Risk-Reward Ratio to TP2: 1:2.4
🔍 Technical Analysis & Strategy:
📌 Breakout Confirmation: Strong buying momentum above $10.14 signals continuation.
📌 Pattern Formation: Rising wedge breakout, indicating a bullish move.
📊 Key Support & Resistance Levels:
🟢 $9.74 (Strong Support / SL Level)
🟡 $10.14 (Breakout Zone / Entry)
🔴 $10.64 (First Profit Target / Resistance)
🟢 $11.11 (Final Target for Momentum Extension)
🚀 Momentum Shift Expected:
If price stays above $10.14, it could push towards $10.64 and $11.11.
A higher volume breakout would confirm strength in the trend.
🔥 Trade Execution & Risk Management:
📊 Volume Confirmation: Ensure buying volume remains strong after breakout.
📈 Trailing Stop Strategy: If price reaches TP1 ($10.64), move SL to entry ($10.14) to lock in profits.
💰 Partial Profit Booking Strategy:
✔ Take 50% profits at $10.64, let the rest run to $11.11.
✔ Adjust Stop-Loss to Break-even ($10.14) after TP1 is hit.
⚠️ Fake Breakout Risk:
If price drops below $10.14, be cautious and watch for a retest before re-entering.
🚀 Final Thoughts:
✔ Bullish Setup – If price holds above $10.14, higher targets are expected.
✔ Momentum Shift Possible – Watch for volume confirmation.
✔ Favorable Risk-Reward Ratio – 1:1.25 to TP1, 1:2.4 to TP2.
💡 Stick to the plan, manage risk, and trade smart! 🚀🏆
🔗 #StockTrading #PTON #BreakoutTrade #TechnicalAnalysis #MarketTrends #ProfittoPath

Peloton Swing Trade Idea - Riding for 39%PTON Swing Trade Unlocked
Get on that Peloton and RIDE!!! 🚴
🎯$11📏$13
- Bull Flag Breakout
- Green H5 with Bullish Cross
- Increasing Volume
- Volume Shelf with GAP
- Rising Wr%
Good luck traders
Not financial advice

PTON LONG INTO EARNINGSFavorable analysis by Wallstreet hedge funds.
Earnings ticking into positive territory
Loyal customer subscriber base
Daily Engulfing Bullish Candle Print on 1/23/2025
Earning coming soon
Green wicks to the left
Good Target
Bullish consolidation on the Daily Timeframe

1/7/25 - $pton - Ambiguous at $9, 2025 R/R poor1/7/25 :: VROCKSTAR :: NASDAQ:PTON
Ambiguous at $9, 2025 R/R poor
- have followed this yoga pants-wearing, starbucks guzzling, taylor swift blastin' name for some time
- first, the balance sheet/ net debt levels require some obvious cash flow generation to be neutralized... especially after a 2.5-3x move from floor
- on one hand the marginal change in sales (from -ve to +ve, probably in 4Q) is already baked in the calorie-free, guilt-free cake.
- and EBITDA mgn already forecasted at DD for this year and next, with not much expansion on the top line (which will at this stage take at LEAST 2-3 Q's - probably more - to get visibility on and materially alter real mkt consensus).
- so even if i assume 200 mm in 2026 fcf (another 20% bump to already likely bullish #s, i can only get to mid 3's - and for a lot of risk on a stretched out maxed out dopamine busted consumer). "yes" their B2B biz is awesome - top of the line - i love it. i do think mgmt gets a B+ all in...
- but friends don't let friends buy high teens EBITDA multiples for low DD's EBITDA growth on tough balance sheets, a name that's already worked (just don't chase it!) and a not-need-to-own name. if u like consumer discretionary just own NYSE:YETI , which is hard enough to own in this environment, but such a low-key sleep-at-night no bears in yo food middle of the night name).
as you can tell it's late. i'm reviewing some oldies i've never written up. maybe a bit more wit. excuse the hyperbole (i'm not restricted in terms of my investment committee anymore so i let it rip these days).
be well <3
V

$PTON bullish to $12 into 2025Touched my control price and rejected to the bottom of my green fair value area and bounced off of that right back to my control price. Expecting $12 price target into jan/feb 2025

PTON Analysis: Dark Pool Levels & Trade SetupsThis chart analysis focuses on Peloton Interactive, Inc. (PTON), observed on the daily timeframe, with a strong emphasis on institutional activity highlighted by Dark Pool Levels (represented by white dashed lines). The stock is currently at a critical juncture, where the price action is consolidating near a significant dark pool level ($9.38). This suggests a potential setup for a decisive move, either continuing the bullish trend seen earlier or reversing into a bearish correction.
By integrating key technical indicators—such as Exponential Moving Averages (8 EMA and 21 EMA), pivot levels, and volume analysis—this analysis aims to provide a clear trading plan, including profit targets and stop-loss levels, for both bullish and bearish scenarios. The focus is on aligning with institutional behavior and leveraging price action around pivotal levels to make well-informed decisions.
Trend and Price Action
The stock experienced a bullish breakout in early September, as the price moved above the 8 EMA and established a strong uptrend.
The bullish momentum was further confirmed by the price staying consistently above the 21 EMA, signaling institutional interest and strong upward momentum.
Recently, the price has entered a consolidation phase, trading within a range near the critical dark pool level of $9.38, suggesting indecision or accumulation by larger players.
Key Indicators
8 EMA and 21 EMA:
The 8 EMA (yellow line) has acted as a reliable support throughout the uptrend. It remains a critical level to watch for trend continuation.
The 21 EMA (blue line) serves as a secondary support and trend confirmation tool. A break below this level may signal a trend reversal.
Pivot Points:
Resistance Levels:
R1 ($10.53): The first major resistance, where the price has struggled to break through during the consolidation phase.
R2 ($11.28) and R3 ($12.49): Potential targets if the bullish trend resumes.
Support Levels:
S1 ($8.10): Key support below the current price. A breakdown here could trigger a bearish move.
S2 ($7.35) and S3 ($6.13): Deeper support levels for potential downside targets.
Dark Pool Levels:
The white dashed lines represent areas of significant institutional activity. These levels often act as zones of support or resistance, with the current level at $9.38 being a key area to watch.
Volume:
Volume spikes during November indicate strong participation by institutional traders, likely around dark pool levels.
Current volume shows signs of normalization, suggesting a period of consolidation or preparation for the next big move.
Patterns Observed
The chart shows a rising channel (from September to November), indicating steady bullish momentum. However, the price has broken out of this channel and entered a sideways consolidation near $9.38.
The consolidation near a dark pool level is often a precursor to a breakout or breakdown, as institutional traders accumulate or distribute their positions.
Bullish and Bearish Scenarios
Bullish Scenario:
Key Factors:
The price remains above the $9.38 dark pool level and the 8 EMA, showing bullish momentum.
A breakout above R1 ($10.53) could trigger a run toward R2 ($11.28) and potentially R3 ($12.49).
Entry Point:
Enter a long position above $9.50, confirming a bounce off the dark pool level.
Profit Targets:
First target: $10.53 (R1).
Second target: $11.28 (R2).
Stretch target: $12.49 (R3).
Stop Loss:
Place a stop-loss below $9.00, as a breach would invalidate the bullish setup.
Bearish Scenario:
Key Factors:
A sustained breakdown below the $9.38 dark pool level and the 8 EMA, with volume confirmation, would indicate bearish pressure.
A break below S1 ($8.10) could lead to a deeper decline toward S2 ($7.35) or even S3 ($6.13).
Entry Point:
Enter a short position below $9.30, confirming a breakdown.
Profit Targets:
First target: $8.10 (S1).
Second target: $7.35 (S2).
Stretch target: $6.13 (S3).
Stop Loss:
Place a stop-loss above $9.50, as it would invalidate the bearish setup.
Conclusion
PTON is at a critical juncture, consolidating near a dark pool level at $9.38. A breakout above $10.53 could reignite the bullish momentum toward higher resistance levels, while a breakdown below $9.38 could trigger a bearish move to key support zones. This setup offers a clear trading plan with well-defined entry points, profit targets, and stop-loss levels, allowing for strategic risk management.

PTON shows probability for the long lineNASDAQ:PTON came back to the level next to 9. This show a good opportunities for keeping on the trend line and move to the next level near 20 during 2025.
Not a recommendation.

ZM BreakerPTON forming bullish breaker after large accumulation. New CEO coming in january from apple fitness, expecting positive reaction.

PTON Longprice above daily SMA50, above SMA200
Earning 10/31/2024
Long 5.50
Stop 4
Target 10
Risk management is much more important than a good entry point.
I am not a PRO trader.
In my trading plan, the Max Risk of each short term trade should be less than 1% of an account.

Update on Peloton Interactive, Inc.Hey, guys. Quick update here on Peloton stock. Interesting day. It seems the market is getting excited for earnings at the end of the month. We will see how things play out!
Hope you enjoy, and best of luck out there.

Possible break out?Good morning Did PTON just break out? good RSI and SRISI levels. MACD looking like it is going to cross. Paper trade safely friends

Peloton Short - Thanks for the rideStoryline: CFO sold shares + (bad economic data incoming?)
Chart: Weekly high broken, retrace due as usual.
Question: Was that whole pump really reasonable?
You can bet that the majority of retail investors bought (as always) on the very top during this wonderful pump and now just patiently waits to feel the real pain of retracement. I doubt in general, that this was a major turnaround for the company, yet.

PTON Peloton Interactive Options Ahead of EarningsAnalyzing the options chain and the chart patterns of PTON Peloton Interactive prior to the earnings report this week,
I would consider purchasing the 3.50usd strike price Calls with
an expiration date of 2024-8-23,
for a premium of approximately $0.24.
If these options prove to be profitable prior to the earnings release, I would sell at least half of them.

PTON clear upsideBased on recent price action and technical indicators i see a potential upside of PTON to 8.5
