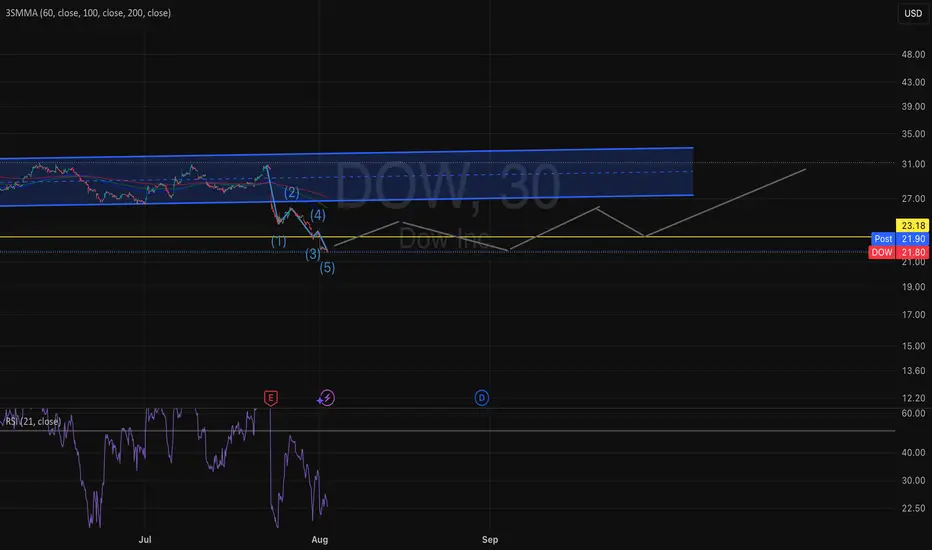
DOW BUY SIGNAL Trade at Own RIsk! Exclaimer
seems as though the DOW is following a well put FIB retracement as well as Elliot Wave
2OY trade ideas

The DOW, Gold, and Morgan StanleyAs it turns out, the stock market that appears to be the gift that keeps giving, is actually giving nothing. In reality, when we measure the value of the DOW with real money (Gold) rather than fiat inflationary currency, the markets are crashing down so fast it'll make your head spin. The $NYSE:DOW/TVC:GOLD shows us that what appears to be one of the greatest bull markets in the history of the entire exchange, is actually just one giant melt up fueled by monetary expansion and inflationary action.
Morgan Stanley NYSE:MS recent came out and shared their new edit to their famous 60/40 portfolio arrangement. In this edit, they entertained the idea that inflation was simply not friendly to the client's holdings and that they should actually diversify their positions. Originally, the 60/40 portfolio consisted of 60% equities, and 40% bonds. However, they presume that the future will not bring a passive environment to the boring 40% bonds because, like anyone with two eyes and a brain, they believe that higher inflation lies ahead. Their solution? Get this, to buy Gold . Who would of thought of something so genius? The profound idea that a placeholder of value would hold value and protect you from inflation could only possibly be developed in such a megabank super titan with trillions in AUM. All sarcasm aside though, it might not be exactly obvious to most what this means for gold and bonds.
Firstly for bonds, most of which are held in treasuries, we can expect some sort of retail selloff only to be bought back up again by the Fed. So nothing news worthy there. However for our precious gleaming metal, we can expect a continuing bull run as money leaves the debt market and enters into precious metals (again namely gold). We should also be inclined to believe that this should help gold mining companies and give them a nice increase in their stock values over time. Next, we shouldn't expect to much of a move from this in the stock market except the usual volatility and seasonal shifts.
Lastly, from this admission from the boys at Morgan Stanley, we can also expect continuing inflation despite what the numbers released by the Fed say. No, the cost of living will not lower. No, the Fed will not raise rates to curb inflation. No, the numbers are never real and never will be. But this does mean that we know what's coming and how to protect ourselves.
Here are the possible plays to consider
Gold: GOLD (USD/OZ)
Stocks: NYSE:NEM , $B, NYSE:EGO , AMEX:EQX , NYSE:AEM
ETF: GDX, GDXJ

DOW — possible Inverse Head & Shoulders baseDOW remains in a well-defined downward channel with the long 50EMA still sloping lower. Within that trend, price rebounded off the channel floor and is building a potential Inverse Head & Shoulders that could trigger a trend-counter rally inside the channel (not a confirmed long-term reversal yet).
Structure & momentum:
Left shoulder: ~24–25
Head: ~22 (capitulation into the lower rail)
Right shoulder: ~24–25 (forming)
Neckline: 26.5–27.0 (prior swing/supply)
Bullish divergences on weekly RSI / MACD into the head, consistent with basing.
Levels & measured move:
Support: 25.0 (pivot), 24.2, 22.2 major, then ~20.4 channel floor.
Resistance / Objectives: 26.5–27.0 (neckline) → 29–30 → 31–33 from the measured move (26.5 – 22 ≈ 4.5 added to the neckline). Stretch: 33.9–34 near upper channel supply.
Probable path:
Hold 24.8–25.0 → test 26.5–27.0 → brief pullback toward 25–25.5 → weekly close above the neckline opens 29–30 first, then 31–33, potentially tagging ~34 if momentum persists. Failure to clear the neckline likely keeps price ranging 24–27 until resolved.
Risk management / invalidation:
This is a counter-trend idea against a declining higher-timeframe trend. For longs, use weekly-close signals.
Tighter risk: invalidate on loss of 23.5 after a shoulder retest.
Structural invalidation of the IHS on a weekly close < 22.0 (break of the head), which reopens the channel downside.
Summary: I’m treating the setup as a potential reversal pattern within a broader downtrend—looking for confirmation only on a weekly breakout above 26.5–27 and aiming for 31–33 (stretch 34) while the channel remains intact. Not financial advice.

Dow short term analysys t Dow Inc. is currently consolidating in the 23.5 range with bullish momentum, having reversed from the lows. If it holds above (~23.3), the next target could be 26+ (Strong High), while key downside protection lies at 21.3–20.4 support zone.

DOWNYSE:DOW Usually when you have bottom with huge rally like that and long distance between the bottom and the back test the first touch candle is your opportunity to buy watch this stock carefully in coming days in smaller time frame and find enter and stop loss.

Will the DOW every Rally after Tariffs?Disclaimer: I do NOT know what I am doing.
Based on Elliot Wave, recent consolidation, and Phi sequencing, the pullback for 'Merican production should fire up the movement.
DOW is in the Wyckoff accumulation phaseThis Week (July 8 - 11):
Support: The recent low at $27.10 is the immediate floor. The ultimate support is the Selling Climax low at $25.10.
Resistance: The 20-day moving average (green line) around $28.50 is the first hurdle. Above that, look for a test of $30.00.
Next Month (July):
Support: The $25.10 low absolutely must hold.
Resistance: The primary target is the top of the trading range, established by the Automatic Rally, at $33.00.

Dow Inc.: Low in PlaceDow Inc. managed to hold and respond well within our active Target Zone(s) between $35.93 and $22.83 at the relevant Fibonacci levels. We currently assume that wave (II) in blue has been successfully completed, which leads us to anticipate a rise above the two indicated resistance levels ($55.67 and $71.86). Our zones remain active and could still be used for entering long positions. However, it should be noted that the price range could be tested further, and a completely new low is even possible under our alternative scenario: this wave count outlines a significantly stronger setback with the blue wave alt.(II), which would mean breaking through our dark green-blue Target Zones (probability: 35%).

DOW Inc | DOW | Long at $27.59NYSE:DOW Inc is a strong company with good fundamentals currently trading at a good value (it just may take time for the value to truly show).
P/E = 18x
Dividend Yield = 7.74%
Price/Cahs Flow = 6.9x
Debt/Equity = 0.94x
Price/Book = 1.14x
Insiders buying and awarded options
Thus, at $27.59, NYSE:DOW is in a personal buy zone.
Targets:
$34.00
$40.00
$44.00

Swing Long For DOWProcessing manufacturers and utility companies are all safe bets right now in an overall bearish market. A company like DOW is severely underpriced right now, so I'm long for the long haul.

DOW. LONG IDEA.Hello!
I'm long dow from the box. First price target is around $50. If we gain $50, I expect all time highs. If we start breaking down from the box, it will probably be new lows.

DOW 20% Potential move. Dow looks primed to hit some targets. Avg Vol and today's Vol are even. Let's see if buyers step in and lift this higher.

DOW has a daily RSI at 26 and a div yield @ 7%Dow is trading at a 5 year low with an attractive yield of 7+ % . They are one of America's worst polluters and have been the target of the EPA for years. We're about to get a new President that absolutely hates the EPA. That may not be good for the environment, but it's probably very good for DOW.

Can DOW survive?Breaking that lower support line was not good. With the upward pullback channels starting to flatten out, will DOW turn around before January? Have to decide to roll options if there's any chance of it targeting $50/sh. Risky, risky. Good luck.


Dow long term ideaI showed my long-term forecast for the Dow index on the chart. People who pump fear into you are making money from it. Everything will be better in this world. It is a good thing to live. I also pointed out the target and the levels that will be needed on the chart. Why don't you try to look through my eyes. Of course, it is useful to be realistic. This will not happen right away. Smart people understand. Look at my past analyses and my profile. Don't forget to follow :) good luck

DOW, nice looking short term option tradeBulls are tired on SPX, its a doji. Looks like a perfect start. Godspeed. NYSE:DOW

DOW: inclining channel pattern at playA price action above 58.00 supports a bullish trend direction.
Bullish confirmation for a break above 60.00.
The target price is set at 62.00 (at the upper range of the inclining channel pattern).
The stop-loss price is set at 57.00 (at its 38.2% Fibonacci retracement level).
Remains in a well-established inclining channel pattern.
Favourable win/loss ratio applicable.

Dow market analysisA potential of 44% was detected against a temporary loss of 22% from the current level. Taboo this does not happen immediately. Patiently accumulate positions in the direction of the long-term goal. I don't expect the price to operate below 53.73, but if that happens, we should wait from 53.73 towards 46.10 and increase the position here. It will result in monetary expansion over a long period of time. Contrary to popular belief, stock markets are not falling markets. The chart wave structure is suitable for long positions. The psychological basis and the world conjuncture will bring the position target shown on the chart. It points to the change in dynamics that cause prices to remain under pressure for a long time. Ignoring the fluctuations, the strategy was determined in the direction of the target

Dow Inc.: Knock Knock…✊The price of the Dow Inc. is currently trying to overcome the resistance at 57.74. We expect that the price will succeed and continue the uptrend until the magenta wave (Y) reaches its top. In the short term, there is a 36% probability that another corrective low will be made, which will be confirmed if the support at $52.64 is lost.

DOW breaking out of it's downtrend?DOW Inc. had been downtrending for quite some time (since it made a double-top peak in April of '22). But, I'm seeing signs of life. On the monthly timeframe, it's squeezing with rising momentum. On the weekly timeframe, the squeeze fired 2 bars ago and, there's a Daily squeeze primed to fire long. Combine that with the fact that it just formed a nice cup & handle as it broke through the downtrend line and I think the squeeze could provide enough juice for a run up to that resistance just in time for earnings.

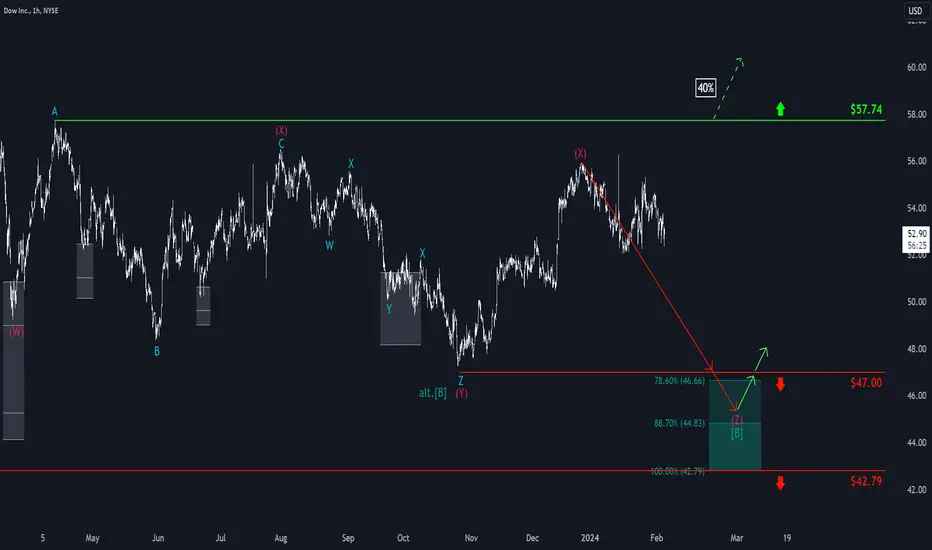
Dow: Heading South 👇We continue to locate the Dow stock in the bearish wave (Z) in magenta and expect the price to fall back to our dark green Target Zone on the south side (coordinates: $46.66 - $42.79). Traders could place a stop for long positions 1% below the lower edge of the Target Zone, or in this case 1% below the support level at $42.79. However, it should be noted that our alternative scenario has a 40% probability and would see break above the resistance level at $57.74. Wave alt. (B) in dark green would have already been completed in this scenario.
EOY Review $DOW how to make 0,11 $ in 4 years....NYSE:DOW a great example why long term investing doesn't always beat shorter term speculating/trading
current price at same level as EOY '19....
closed the 2 down quarter green, above the low of previous quarter = positive
inside year = no clear direction, until market gives us new clues = neutral
anything can happen
