After-Hours Update: APO Break & Retest Continuation Passed 50FibOverview
Looking for an incoming buy-in opportunity on APO - Apollo around the $158-$160 range by mid-February. This setup aligns with a potential longer-term hold and a continuation back to its previous all-time highs (ATHs). If it follows an incremental climb higher, this could yield a 19-20%+ ga
Next report date
—
Report period
—
EPS estimate
—
Revenue estimate
—
4.281 CHF
4.02 B CHF
23.91 B CHF
402.01 M
About Apollo Global Management, Inc. (New)
Sector
Industry
CEO
Marc Jeffrey Rowan
Website
Headquarters
New York
Founded
1990
ISIN
US03769M1062
FIGI
BBG01NNHHKK0
Apollo Global Management, Inc. provides asset management services. It offers its clients excess return at every point along the risk-reward spectrum from investment grade to private equity with a focus on three business strategies: yield, hybrid, and equity. It operates through following segments: Asset Management, Retirement Services and Principal Investing. The Asset Management segment focuses on credit and equity investing strategies. The Retirement Services and Principal Investing segment consists of realized performance fee income, realized investment income from balance sheet investments, and certain allocable expenses related to corporate functions supporting the entire company. The company was founded by Marc Rowan in 1990 and is headquartered in New York, NY.
Related stocks

The Bull Market in Private EquityThe other day I was scanning for stocks hitting 52-week highs (or in other words, their highest price in 12 months' time) and noticed that several private equity stocks appeared on this custom scan that I was performing. The stocks were KKR, Blackstone, and Apollo Global. I found a few things intere

NYSE> short *APO*Based on my graphic analysis I observe a bearish projection reaching minus 6,2% in the price of this corporation, that is; from $107 it will drop to $100. With a buy exit emerging at $113, it is worth remembering that the exact time the decline will take is unpredictable, the market will simply do i

APO ( Apollo Global Management ) breaking bullish flag patternStock : PYPL ( Apollo Global Management Inc )
Date : 27 Mar 2024
Trend : Up
preferred Transaction : Buy ( 113.50 $ )
Reasons : The stock has broken up the bullish flag pattern
Technical Analysis success at level : Target 1 :( 128 $ ) - Target 2 :( 136.60 $ )
Technical Analysis fail at leve

APO broke out of consolidation phaseBroke-out of consolidation and crossed over resistance of 114.92. There is no target as the stock is hitting ATH. Manage the trade by having stop losses. We can go long with stock and set stop loss slightly below 114.77. There is currently no good option flows.

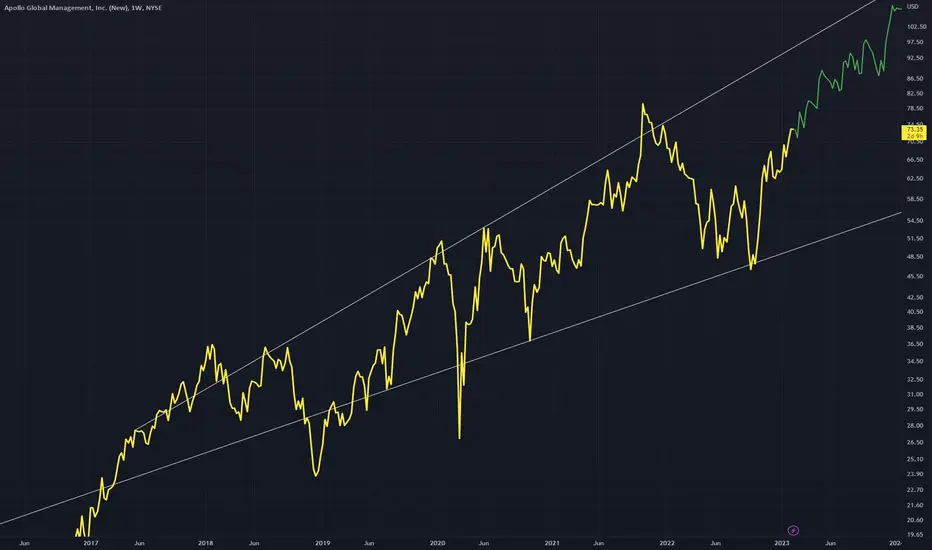
APOLLO Stock Chart Fibonacci Analysis 043023Trading Idea
1) Find a FIBO slingshot
2) Check FIBO 61.80% level
3) Entry Point > 63/61.80%

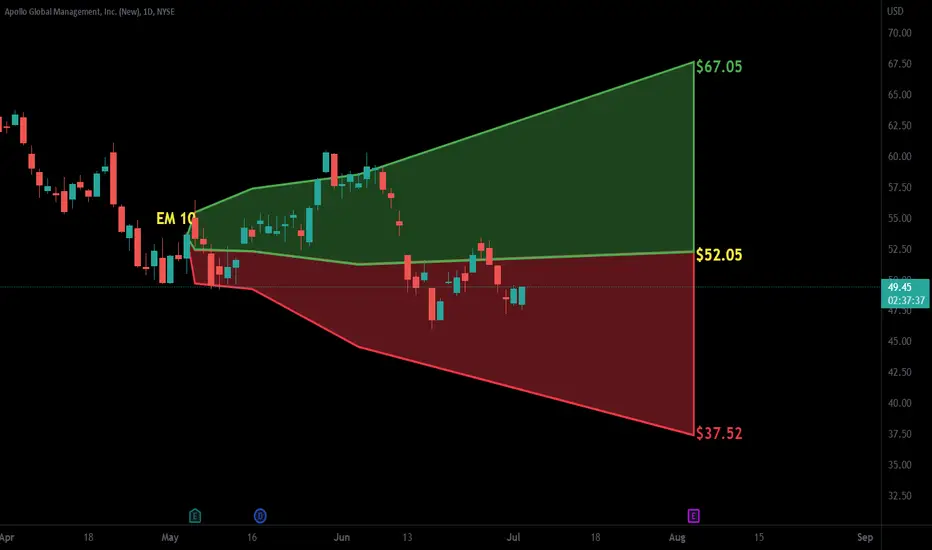
APO - Megaphone Up An up megaphone structure
Expect bullish continuation as price rebounds of the lower band of the megaphone
BULLISH
$APO - Short opp? look at that recent percentage gain CC:$KKR $APO - Short opp? look at that recent percentage gain CC:$KKR

$APO with a Bearish outlook following its earnings #Stocks The PEAD projected a Bearish outlook for $APO after a Positive over reaction following its earnings release placing the stock in drift B with an expected accuracy of 100%.
Apollo Global Managmentlove the name of this company and they are into the business of diamonds- but they are mostly synthetic --- I like synthetic black diamonds --- so I will invest in the companies that I admire- or hope succeed

See all ideas
An aggregate view of professional's ratings.
Neutral
SellBuy
Strong sellStrong buy
Strong sellSellNeutralBuyStrong buy
Neutral
SellBuy
Strong sellStrong buy
Strong sellSellNeutralBuyStrong buy
Neutral
SellBuy
Strong sellStrong buy
Strong sellSellNeutralBuyStrong buy
Displays a symbol's price movements over previous years to identify recurring trends.
APO5910270
Apollo Global Management, Inc. 6.0% 15-DEC-2054Yield to maturity
—
Maturity date
Dec 15, 2054
APO5700540
Apollo Global Management, Inc. 6.375% 15-NOV-2033Yield to maturity
—
Maturity date
Nov 15, 2033
APO5813716
Apollo Global Management, Inc. 5.8% 21-MAY-2054Yield to maturity
—
Maturity date
May 21, 2054
US3769MAE6
Apollo Global Management, Inc. 5.15% 12-AUG-2035Yield to maturity
—
Maturity date
Aug 12, 2035
See all APO bonds
Curated watchlists where APO is featured.

Frequently Asked Questions
The current price of APO is 152.481 CHF — it has decreased by −1.03% in the past 24 hours. Watch Apollo Global Management Inc stock price performance more closely on the chart.
Depending on the exchange, the stock ticker may vary. For instance, on BX exchange Apollo Global Management Inc stocks are traded under the ticker APO.
We've gathered analysts' opinions on Apollo Global Management Inc future price: according to them, APO price has a max estimate of 143.48 CHF and a min estimate of 124.13 CHF. Watch APO chart and read a more detailed Apollo Global Management Inc stock forecast: see what analysts think of Apollo Global Management Inc and suggest that you do with its stocks.
APO stock is 1.04% volatile and has beta coefficient of 2.06. Track Apollo Global Management Inc stock price on the chart and check out the list of the most volatile stocks — is Apollo Global Management Inc there?
Today Apollo Global Management Inc has the market capitalization of 62.40 B, it has decreased by −0.44% over the last week.
Yes, you can track Apollo Global Management Inc financials in yearly and quarterly reports right on TradingView.
Apollo Global Management Inc is going to release the next earnings report on Oct 29, 2025. Keep track of upcoming events with our Earnings Calendar.
APO earnings for the last quarter are 1.52 CHF per share, whereas the estimation was 1.46 CHF resulting in a 4.14% surprise. The estimated earnings for the next quarter are 1.56 CHF per share. See more details about Apollo Global Management Inc earnings.
Apollo Global Management Inc revenue for the last quarter amounts to 5.41 B CHF, despite the estimated figure of 3.63 B CHF. In the next quarter, revenue is expected to reach 3.96 B CHF.
APO net income for the last quarter is 483.18 M CHF, while the quarter before that showed 376.23 M CHF of net income which accounts for 28.43% change. Track more Apollo Global Management Inc financial stats to get the full picture.
Yes, APO dividends are paid quarterly. The last dividend per share was 0.41 CHF. As of today, Dividend Yield (TTM)% is 1.39%. Tracking Apollo Global Management Inc dividends might help you take more informed decisions.
Apollo Global Management Inc dividend yield was 1.10% in 2024, and payout ratio reached 25.36%. The year before the numbers were 1.81% and 20.58% correspondingly. See high-dividend stocks and find more opportunities for your portfolio.
As of Sep 1, 2025, the company has 3.13 K employees. See our rating of the largest employees — is Apollo Global Management Inc on this list?
EBITDA measures a company's operating performance, its growth signifies an improvement in the efficiency of a company. Apollo Global Management Inc EBITDA is 5.60 B CHF, and current EBITDA margin is 31.94%. See more stats in Apollo Global Management Inc financial statements.
Like other stocks, APO shares are traded on stock exchanges, e.g. Nasdaq, Nyse, Euronext, and the easiest way to buy them is through an online stock broker. To do this, you need to open an account and follow a broker's procedures, then start trading. You can trade Apollo Global Management Inc stock right from TradingView charts — choose your broker and connect to your account.