Trade ideas
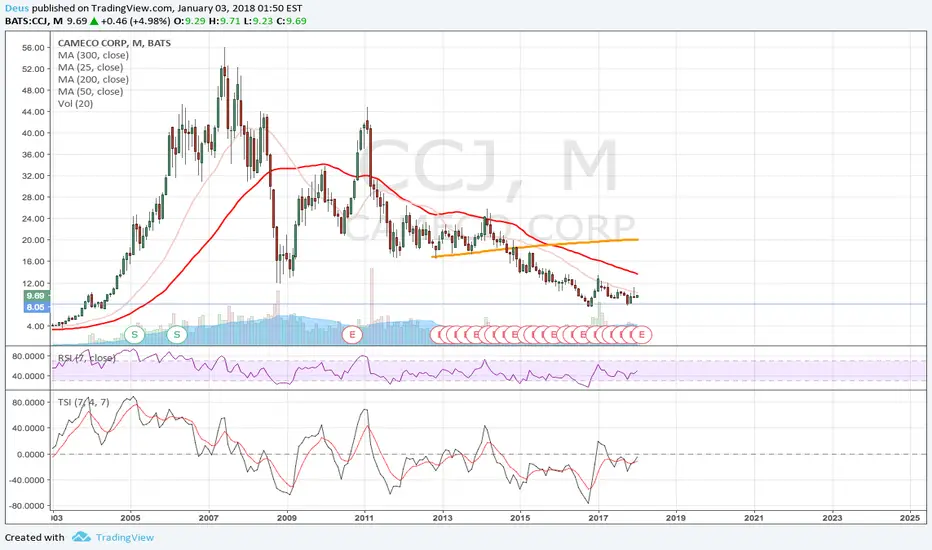
Cameco long term play $CCORecently Cameco touched 50MA.
Cameco has to close and remain above its 50 day moving average (blue line) to consider trend change.
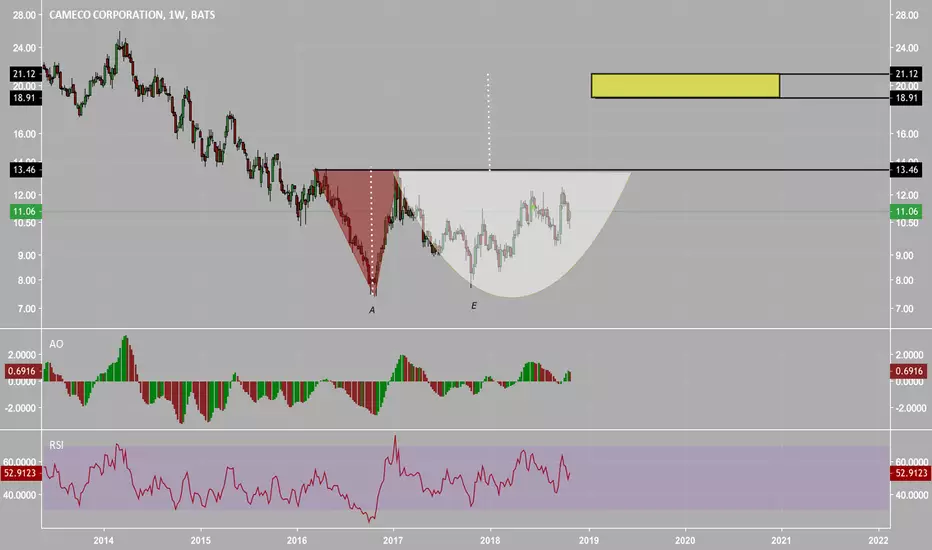
Cameco could go to $21 (0.23 fib line) in 9 months and $29 (0.38 fib line) in months 10-12 WHEN cycle ends, which could be Q2-3 2019 or right now Q4 2018.
DXY and Libor not done rising yet until Federal Reserse stops raising rates in 2019.
Cameco is a buy at $10 or otherwise $5 if doesn't hold above $10 resistance.


CCJ - Cameco Corp. Mining - domestically sourced energy sourceNYSE:CCJ
Recent changes to using domestic sources of Ur (Uranium symbol) for nuclear power.
Cameco Corp. is also at an extreme low due to the 2011 psunami that hit Japan that
had back-up power failure causing a melt down and Japan shuttering 32 Nuclear
Power Plants until they had full double fault protection to prevent such from ever
occuring again. They are now getting ready to start back up, which will drive up the
prices of Ur futures (UX) and thus profits for domestic suppliers, as no new power
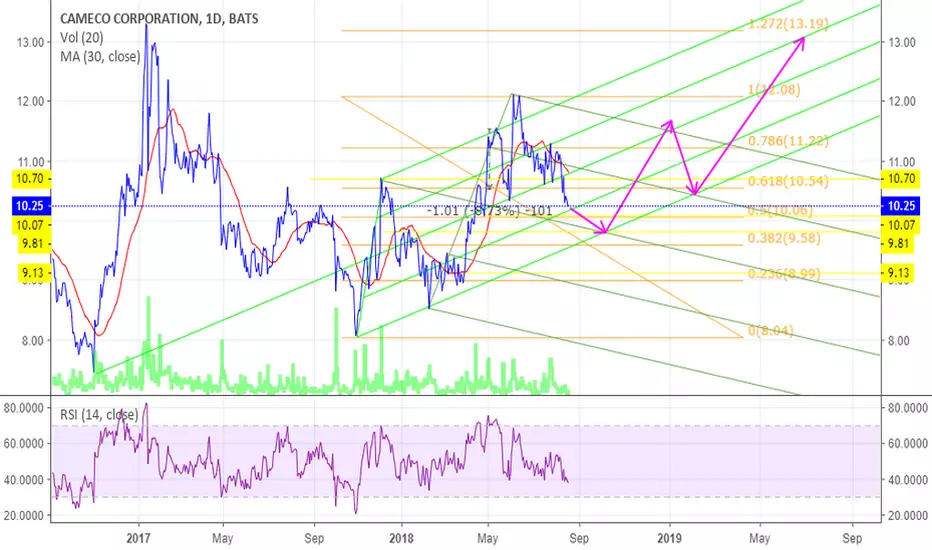
plants are being built these days. CCJ pricing in near break-out of 9.75-9.81 resistance
level.
View the 1w, 1d, 1h, 1m chart and look for pricing to go past 9.80-9.81 range for entry
upward and simply know prices are going up. Lower Fib retracement is 9.50 which it
quickly bounced off today. Below this 9.13 is the low and not likely with current
dynamics.

CCJ - NYSE CCO - TSX Powering the grid Cameco Corp. Mining Uranium stock likely recovers in breakout of FIB retracements 0.5 (recent down) and 0.382 (recent up) and near 9.81 or drop below 9.50 to 8.95-9.25 resistance.
Point of interest:
* Uranium prices beaten down since 2011 Fukashima Reactor melt-down and back-up generator cooling failures from psunami hitting Japan.
* Japan shuts down all of the 32 Nuclear Reactors to assure public safety and clean-up causing global Uranium (Ur) prices to tumble to where it now is.
* Nuclear energy is still a paid for and quite reliable energy source with proper safety measures, which Japan now has and plans to restart.
* No. Amer. power also relies on nuclear power, which Pres. Trump will not import from other countries supporting demand.
* This is one of several plays, which is safe haven mid to large-cap mining stock and away from volatility (VIX) moneyballers like, as VIX up near 5% each of last 2 days.
Viewers come to own conclusions. Like, share, comment.

Still negative short term CamecoLooking for the RSI Line to break the downward tren while the share price gets back over the 30 MA.
Long term bullish,, short term it as probably got ahead of itself but not by much.

CamecoBuying at below $10, small positions to begin with. from a macro point of view Trump will support the US nuclear industry by making harder for countries like Kazakhstan to import. 20% of the USA energy is generated by nuclear. Productionn as been locked in.. the uranium price as risen from 20-26 in 2018. In 4-5 years you will look at the price and think why wasnt i loading up then

More Bullish Wave count emergingNot enough structure unfolded to allow a valid five wave count up to Complete Wave 3. My supposition is that we are still within Wave 3 of Intermediate Cycle 3 of Primary Cycle 3, which allows for more bullish action to commence shortly and carry us into 2019.

Elliott in Cycle 1 to $26
My preferred count for Cameco is that we are currently in Cycle 1 that may go on for some months yet. Within Cycle 1 we have completed an Intermediate Wave 1 in Jan 2017, and Intermediate Wave 2 in October 2017.
We are now in Intermediate Wave 3, and are completing a minor Wave3 right now. We then need to complete 4 and then 5 to complete higher degree Intermediate Wave 3.
Once Intermediate Wave 5 is actually complete sometime next year, we can expect a larger degree correction that would complete Cycle 2. From there we will embark on Cycle 3.


Cameco Looks Ready For A Breakout.CCJ looks prone to a volatility spike to the upside. It could finish the year closing in on the multi year downtrend resistance level.

Inverse HnS w/ supporting volumeDaily shows inverse HnS reversal. Wait for backtest to enter and get long!


$CCJ "Cameco one of the worlds largest publicly traded uranium."NYSE:CCJ - double bottom.. would be a nice try.


When this giant awakes, it would be phenomenalI picked this up while reading an article recently about commodities cycle turning bullish again.
Please do not ask me about the FA of this company as I do not dwell in it. From a chart perspective, this is what I see. The downside from the current price is it may falls to 1.50, all time low. It can also stay there for a long long time and never recover.
That is the risk , meaning you are holding on to a dead stock. Is this your kind of risk ? Do you have the patience to sit and hold?
Or can this be the kind of stock you wanna leave behind for your children in 5,10 years or more ?
I will monitor this and would be keen to participate on a small scale. Anyone with any insight or articles please share . Thanks
p/s : I see a descending wedge pattern which may break out from current price or heads further south before breaking out. Note this is a monthly chart so do not expect to see price actions movement so fast, you may go to lower time frame if you are keen to partake in this stock.

Will 2018 Deliver Bullish Momentum to CAMECO?I believe it will. Technicals support the formation of a double bottom. Although it does not look like the share price is going to break up any week soon, it seems the share price is cooking a potential bullish first wave.
Good luck fellow traders

CCJCCJ turning around. Strong weekly bullish convergences.
Going to go with a tight trade. Stop Limit of $10 with price target of $11 and stop loss of $9.70.
Daily chart:

Confused bearish trendline breakoutI always try no to draw too many lines because I work with the more basic concepts of support and resistance, trend lines breakout and price patterns .
Now Here I have double bottom and a main bearish trend line breakout but the price now have acquired and erratic behavior and more recently the price did a deep pullback and here is the opportunity to entry after this dip (9.79)
Other important aspect here is the tails of the candlestick bars in the 7.80 level confirming the double bottom.
When I categorize something like a double bottom like in this chart I need a considerable lapse of time between the first floor to the second floor touched in the 7.80 level in this example the double bottom takes one year and one month to take shape.
The majority of my ideas have this component a bearish trend line breakout with a double bottom.
by the way I not publish the same chart idea twice I not repeat symbols look my published ideas
By last the horizontal resistance line in the area of 12.00 was a support broken in the 2008 in the financial crisis and then again was broken in June 2016
This idea need time and observation because the 12.00 resistance level has a lot of relevance in the recent history of this stock.
I use a price action analysis with multiple time frame. Without Indicators