$ACN how it's going so far, I guess we will see...I posted this a while back NYSE:ACN has chart is prepped for takeoff and apparently, they outperformed on their Earnings, but I think due to a lack of volume there has been minimal upside, but I placed a position in a liquidity zone and am up $500,000.
This is just a paper trading account so I obviously YOLO'd a bunch of money into this. This is really just a test but the technical are there so I guess we will see. Also, I wanted to see if it'll show my position.
PLEASE BE AWARE THIS IS NOT FINANCIAL ADVICE; no strategy is 100% accurate. I am still learning myself I am strictly PAPERTRADING because I do not want to risk money I do not have. I do hope all of you are profitable. GODBLESS YOU ALL GOODLUCK
Trade ideas

$ACN super undervalued - NYSE:ACN earning reports were solid and their Gen AI projects backlog are increasing that will translate into revenue next year.
- Every company is currently building their Gen AI applications. NYSE:ACN stands to benefit this industrialization of the trend.
- Valuation is quite low in decades despite them growing and adapting to the most hottest tech trends in the industry.

$ACN A POTENTIAL BEAUTIFUL BY THE BOOK SET UPThis one just came across my desk, this one's interesting from what I gather they essentially teach companies how to use AI, they have an Earnings Report tomorrow. So as of right now they are at their support Line. This is where people have been defending and loading up. Fun Fact Apparently someone bought 510,732 Shares at the close of the market today.
It's been in a Bearish Trend for the past few months maybe this will be there turning point. Overall, to keep it simple 2+2 = 4. Earnings Report tomorrow currently riding the support line. Being that's its been a red week so far lets just be cautious.
NOT FINANCIAL ADVICE.

MY BULLISH VIEW ON ACCENTURE (ACN)
📈 My Bullish View on Accenture (ACN)
Looking at the chart and the fundamentals, I believe Accenture has strong chances of a significant bullish move. Here’s why:
🔍 Technical Analysis / Patterns
A double bottom formation (“Bottom 1” and “Bottom 2”) suggests the price may have found solid support around these levels.
There’s a descending trendline acting as resistance: if the stock breaks above it, a new upward impulse could begin.
Volume has also sent interesting signals: a recent increase (as shown in the chart) indicates growing market interest in Accenture.
Based on these technical elements, the target price marked in the chart looks reasonable if a breakout occurs.
🔑 Fundamental Drivers Supporting the Bullish Potential
Here are recent factors that strengthen the case for Accenture’s growth:
Revenue and EPS Growth
In Q3 FY2025, revenues reached ~$17.7 billion, up 7% in local currency year over year.
Adjusted EPS rose by 12% YoY.
Expanding Margins
Operating margin improved by about 40 basis points compared to the same quarter last year.
Full-year operating margin outlook confirmed at around 15.6%. (Investing.com, Financial Modeling Prep)
Positive Guidance / Updated Estimates
Accenture expects 6–7% revenue growth in local currency for FY2025. (investor.accenture.comFull-year diluted EPS is projected between $12.77 and $12.89. (Investing.com)
Focus on AI / Reinvention
Accenture is restructuring its services into a new unit called “reinvention services”, better integrating consulting, technology, operations, and AI into a more scalable offering. (Business Insider)
The company announced it will train over 700,000 employees in the use of agentic AI technologies — a strong commitment to digital transformation, one of today’s leading trends. (The Economic Times)
Strategic Expansions / Acquisitions
Recently acquired Australian cybersecurity firm CyberCX, its largest-ever deal in the cyber sector. This strengthens Accenture’s positioning in a high-growth field (cybersecurity, defense, digital risk).
Valuation / Upside Potential
Some DCF analyses suggest the stock may be undervalued at current levels, with upside potential if the market begins rewarding growth and innovation investments (AI, security, etc.). (Simply Wall St)
Despite recent weak price performance, fundamentals remain solid, which could trigger a positive reaction once technical signals confirm. (Investing.com)

ACN | RSI Divergence | Buy @LTP ACN | RSI Divergence | Buy @LTP | SL below $235 in closing basis | 1st Target $275
Disclaimer:
This is not financial advice. Please do your own research or consult with a financial advisor before making any investment decisions. Investments in stocks can be risky and may result in loss of capital.

Accenture near 2021 levels, ready for a contra buyAccenture that was in a down trend for a long time is finally reached its 2021 levels and may forma double bottom. It looks a good buy if we get a daily closing above $246, for targets of 260, 280 and 300+. (This view is for educational purpose only)

ACN
Here’s a clear explanation of **Accenture plc (ACN)** stock in English, without links:
---
## 1. Stock Snapshot (as of late August 2025)
* **Current Price**: Around **\$259.22**, up about **2%** on the day.
* **Trading Range**: Between **\$254 and \$262** during the session.
* **52-Week Range**: The stock is still about **35% below its peak of nearly \$398** reached in February 2025.
* **Volume**: Roughly **3.1 million shares traded**, slightly lower than its 50-day average.
---
## 2. Analyst Views
* Most analysts rate Accenture as a **“Buy”**, with price targets generally between **\$302 and \$354**, suggesting potential upside of 20–35%.
* Some firms are more cautious, trimming their targets due to near-term growth concerns, but the majority still expect the stock to recover strongly.
---
## 3. Growth Drivers
* **Artificial Intelligence (AI)**: Accenture has secured about **\$3 billion in new AI business orders** in fiscal 2024, tripling its revenue from generative AI to nearly **\$900 million**. This shows strong demand for its AI consulting and solutions.
* **Strategic Acquisitions**: Recently, Accenture acquired **CyberCX** in Australia (valued around \$650 million) to strengthen cybersecurity, as well as smaller firms in digital marketing and consulting to broaden its service scope.
* **Quarterly Earnings**: In the latest quarter, revenue rose about **7% year-over-year** to roughly **\$17.7 billion**, with earnings per share climbing **12%**. The company guided for continued 6–7% revenue growth in the near term.
---
## 4. Business Overview
Accenture is a **global professional services company** headquartered in Dublin, Ireland. It operates across five main areas:
* Strategy and Consulting
* Technology
* Operations
* Accenture Song (digital and marketing services)
* Industry X (engineering and manufacturing digital services)
It employs over **770,000 people worldwide** and generates more than **\$64 billion in annual revenue**.
---
## 5. Strengths and Challenges
**Strengths**
* Strong position in digital transformation and AI services.
* Diversified global business across many industries.
* Strategic acquisitions reinforcing long-term growth.
**Challenges**
* Stock still significantly below its highs, reflecting investor caution.
* Pressure to show consistent profitability from AI investments.
* Competition from other global consulting and technology firms.
---
## Final Take
Accenture (ACN) is a high-quality consulting and technology leader. While its stock has pulled back from highs, analysts see it as undervalued with room to rebound. Success will depend on how effectively it converts AI demand and acquisitions into sustained revenue and margin growth.

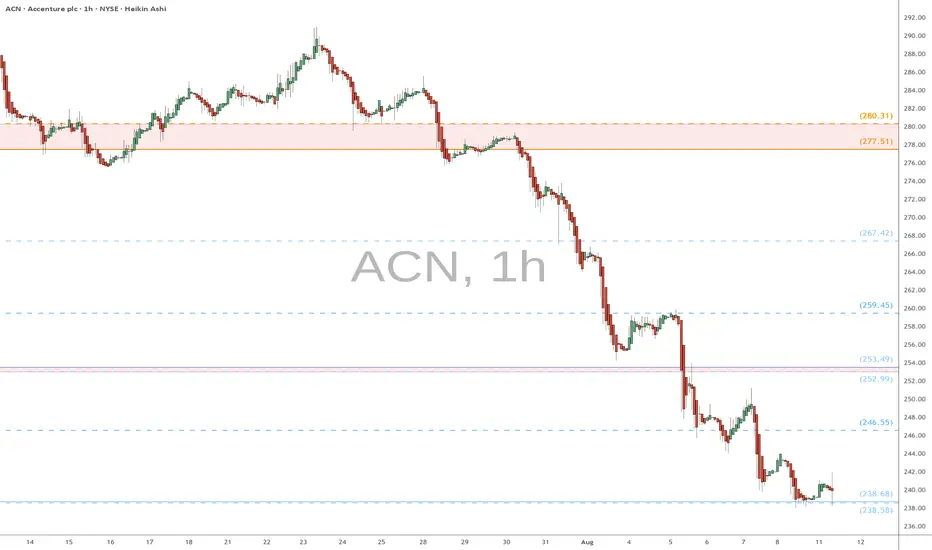
ACN eyes on $238.58/68: Double Fib that could mark the BOTTOM ACN has been in a massive correction from its ATH.
Currently trying to hold double fib at $238.58-238.68
Looking to enter longs here, add on break of fibs above.
ACN | Buy @LTP | SL below 260 on closing basis | Target 385Disclaimer:
This is not financial advice. Please do your own research or consult with a financial advisor before making any investment decisions. Investments in stocks can be risky and may result in loss of capital.
ACN watch $315: Resistance may reject to 280, or break to 340?ACN bounced into a significant resistance around $315
Look for a break and retest which would target $340.
Rejection could drop it to Double Golden fibs at $280.
$ 314.05 - 316.37 is the immediate resistance.
$ 277.51 - 280.31 is the best guess target below.
$ 334.93 - 340.33 would be first target for bounce.
===============================================

ACCENTURE Stock Chart Fibonacci Analysis 042525Trading Idea
1) Find a FIBO slingshot
2) Check FIBO 61.80% level
3) Entry Point > 290/61.80%
Chart time frame: D
A) 15 min(1W-3M)
B) 1 hr(3M-6M)
C) 4 hr(6M-1year)
D) 1 day(1-3years)
Stock progress: A
A) Keep rising over 61.80% resistance
B) 61.80% resistance
C) 61.80% support
D) Hit the bottom
E) Hit the top
Stocks rise as they rise from support and fall from resistance. Our goal is to find a low support point and enter. It can be referred to as buying at the pullback point. The pullback point can be found with a Fibonacci extension of 61.80%. This is a step to find entry level. 1) Find a triangle (Fibonacci Speed Fan Line) that connects the high (resistance) and low (support) points of the stock in progress, where it is continuously expressed as a Slingshot, 2) and create a Fibonacci extension level for the first rising wave from the start point of slingshot pattern.
When the current price goes over 61.80% level , that can be a good entry point, especially if the SMA 100 and 200 curves are gathered together at 61.80%, it is a very good entry point.
As a great help, tradingview provides these Fibonacci speed fan lines and extension levels with ease. So if you use the Fibonacci fan line, the extension level, and the SMA 100/200 curve well, you can find an entry point for the stock market. At least you have to enter at this low point to avoid trading failure, and if you are skilled at entering this low point, with fibonacci6180 technique, your reading skill to chart will be greatly improved.
If you want to do day trading, please set the time frame to 5 minutes or 15 minutes, and you will see many of the low point of rising stocks.
If want to prefer long term range trading, you can set the time frame to 1 hr or 1 day.

ACN - Accenture | Buy if close above 388Disclaimer:
This is not financial advice. Please do your own research or consult with a financial advisor before making any investment decisions. Investments in stocks can be risky and may result in loss of capital.

Wedge Play - Accenture $ACNPretty clean chart. Symmetrical wedge with bullish bias. Above all monthly VWAP and EMAs. Just needs to clear the $371 volume profile shelf and then it should send it. Macro monthly place.
Long.

$ACN with a bullish outlook following its earnings #StocksThe PEAD projected a bullish outlook for NYSE:ACN after a positive over reaction following its earnings release placing the stock in drift B with an expected accuracy of 71.43%.

ACN Accenture plc Options Ahead of EarningsIf you haven`t bought ACN before the previous earnings:
Now analyzing the options chain and the chart patterns of ACN Accenture plc prior to the earnings report this week,
I would consider purchasing the 340usd strike price Calls with
an expiration date of 2024-11-15,
for a premium of approximately $11.55.
If these options prove to be profitable prior to the earnings release, I would sell at least half of them.

BEAT 365 AGAIN and it could be a shift in directionWith the catalyst and the selloff from market conditions, this is poised to break 364 and fill the gap; we may see it consolidate around here before another big move up.

Accenture Stock Surges as Generative AI Powers BookingsAccenture (NYSE: NYSE:ACN ), a global leader in business management consulting and technology services, has recently made headlines after its fourth-quarter earnings report exceeded revenue expectations, driven primarily by its leadership in generative AI. With strong financial performance and promising technical indicators, the stock presents a compelling opportunity for investors. Let’s dive into both the fundamental and technical aspects that make NYSE:ACN a stock to watch.
Generative AI and Strategic Acquisitions Drive Growth
Accenture’s fourth-quarter performance reflected strong growth, particularly in the realm of generative AI. New bookings jumped 21% to $20.1 billion, with $1 billion of that attributed to generative AI services. CEO Julie Sweet confidently described generative AI as "the most transformative technology of the next decade," positioning Accenture as a frontrunner in this space. These bookings for AI-related services are expected to grow even further, reaching $3 billion by the end of the fiscal year.
Revenue and EPS Beat
Accenture (NYSE: NYSE:ACN ) reported $16.41 billion in revenue for Q4, a 2.6% year-over-year increase that exceeded analyst forecasts. Adjusted earnings per share (EPS) came in at $2.79, just above the consensus estimate of $2.78. The company’s growth has been further fueled by a series of acquisitions. Notably, acquisitions have contributed 3% to fiscal 2025 revenue growth, with $5.2 billion in acquisitions completed this fiscal year alone.
Positive Fiscal 2025 Outlook
For fiscal 2025, Accenture (NYSE: NYSE:ACN ) predicts revenue growth in the range of 3% to 6%, projecting total revenue between $66.84 billion and $68.79 billion. This growth is further supported by a robust share repurchase program, with an additional $4 billion allocated, bringing the total buyback authorization to $6.7 billion. The firm also increased its quarterly dividend by 15%, reflecting confidence in its future performance.
Technical Outlook:
On the technical side, NYSE:ACN is displaying strong bullish momentum. Following the earnings beat, Accenture shares (NYSE: NYSE:ACN ) surged by 4.33%, pushing the stock above key resistance levels. The stock now trades around $354, up nearly 5% on the day, and has moved into positive territory for the year. The technical indicators are signaling further upside potential.
RSI and Moving Averages
At the time of writing, Accenture’s Relative Strength Index (RSI) sits at 64.49, which is close to the overbought level but still provides room for further growth. An RSI above 70 typically indicates overbought conditions, so the current level suggests a bullish trend without reaching an extreme. Additionally, the stock is trading above key moving averages, including the 50-day and 200-day moving averages, signaling ongoing strength in the upward trend.
Gap-Up Pattern
One particularly noteworthy signal is the gap-up pattern in Accenture’s daily price chart. This pattern, characterized by a sharp increase in price that leaves a "gap" on the chart, often suggests strong investor sentiment and the potential for continued bullish momentum. In this case, the gap-up was fueled by the company's strong earnings report and positive outlook, setting the stage for further upward movement.
Resistance and Support Levels
The stock is approaching a key resistance level around $360. A successful break above this point could see NYSE:ACN test even higher levels, potentially targeting the $380 range. On the downside, the nearest support level sits around $340, which has held strong in previous sessions. With the stock trading above both short- and long-term moving averages, the technical picture suggests that NYSE:ACN is poised for continued growth in the near term.
Conclusion
Accenture’s fourth-quarter earnings report highlights the company’s robust growth trajectory, driven by its strategic leadership in generative AI and ongoing acquisitions. On the technical front, the stock is showing strong bullish momentum, backed by favorable RSI levels, a gap-up pattern, and support from key moving averages. With a positive fiscal outlook, increased dividend, and an aggressive stock buyback program, Accenture is positioned as a compelling buy for investors looking to capitalize on both technological innovation and solid financial performance.

$ACN ProbabilitiesThe project is design to highlight potential support/resistance zones with the rectangles, but also a design of lower/higher probability of reach. The path of the white dots is projected to have a higher probability while the big blue polygon lower probability of penetration.
Marked level could be highly significant in the upcoming developments in this stock, while near the marked time stamps we could see some shifts in sentiment and mood. Shift in volatility and/or mood near the Earnings report and the vertical rectangle.
The squarish looking rectangles are more like milestones for potential developments if we reach those zones in the future. Any support/resistance level can provide reversals but also breakouts in some cases.
Currently at the longer purple rectangle with signs of support, but I wouldn't go long right now. Because of big blue lurking potential "no go" zone, I am little bit biased towards the more bearish toned scenario with a more sliding style of price action rather than power impulse runs, but time will tell.

Accenture plc (ACN) buy with 3 targets: 322.63, 329.76, and 340.Buy entry on Accenture plc (ACN), with targets at 322.63, 329.76, and 340.80.

$ACNNYSE:ACN is starting to break out, forming a bullish flag pattern on the daily chart. A move above $305 could trigger substantial momentum,Watch for a breakout above this key level.


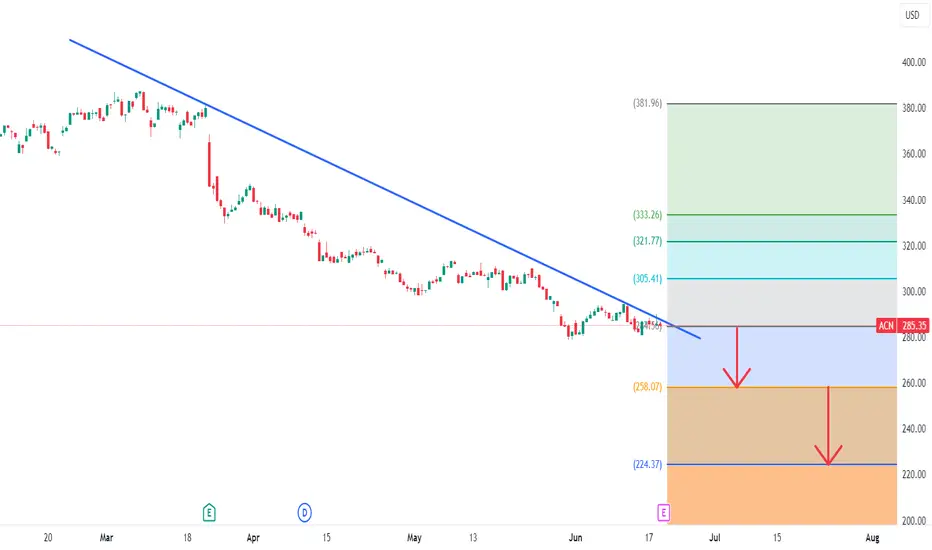
ACCENTURE Downtrend Line Rejection At $285.35. 20.06.2024Downtrendline Rejection: Observed at $285.35.
Bearish Scenario:
If rejection holds, potential decline to $258.07.
If $258.07 breaks, further drop likely to $224.37.
Bullish Scenario:
If rejection fails, potential rise to $305.41.
If $305.41 breaks, further climb likely to $321.77.
Apply risk management
Risk Warning: Trading in CFDs is highly speculative and carries a high level of risk. It is possible to lose all of your invested capital. These products may not be suitable for everyone, and you should ensure that you fully understand the risks taking into consideration your investment objectives, level of experience, personal circumstances as well as personal resources. Speculate only with funds that you can afford to lose. Seek independent advice if necessary. Please refer to our Risk Disclosure.
BDSwiss is a trading name of BDS Markets and BDS Ltd.
BDS Markets is a company incorporated under the laws of the Republic of Mauritius and is authorized and regulated by the Financial Services Commission of Mauritius ( FSC ) under license number C116016172, address: 6th Floor, Tower 1, Nexteracom Building 72201 Ebene.
BDS Ltd is authorized and regulated by the Financial Services Authority Seychelles (FSA) under license number SD047, address: Suite 3, Global Village, Jivan’s Complex, Mont Fleuri, Mahe, Seychelles. Payment transactions are managed by BDS Markets (Registration number: 143350)
Disclaimer
Trading Accenture Stock Following a Rising Wedge Breakout
Pattern
Accenture (ACN) stock has recently formed a noteworthy technical pattern known as a rising wedge. This pattern is characterized by a series of higher highs and higher lows, with the price action converging toward a single point, forming a wedge-like shape. Typically, a rising wedge is considered a bearish pattern, suggesting that the uptrend may be losing steam and a potential reversal could be on the horizon.
However, in the case of Accenture, the stock has recently broken out above the upper trendline of the rising wedge. This breakout could signify a continuation of the previous uptrend rather than a reversal.
Key Levels:
The key level to watch following this breakout is the top of the wedge, which falls around the $289-$290 price range. If Accenture's stock price can sustain above this level, it would confirm the bullish breakout and suggest potential for further upside.
On the downside, the bottom of the wedge, around the $280 level, now becomes a crucial support level to monitor. If the stock were to fall back below this level, it could negate the bullish implications of the breakout and suggest a potential false breakout.
Price Action:
The price action leading up to and following the breakout has been bullish. Accenture's stock price has been making a series of higher highs and higher lows, indicating strong upward momentum. The breakout itself was decisive, with the stock gapping up and closing well above the upper trendline of the wedge.
Relative Strength Index (RSI) has been trending upward, suggesting that bullish momentum is building. However, the RSI is approaching overbought territory, which could signal a potential short-term pullback or consolidation.
