ALT WAVE STRUCTURE IN MS SELL 50 TO 75 NET LONGS NOW An alt wave structure we just had 5 wave up to a .618 ret in MS at this morning high would take 75 % long off now and raise stops
Trade ideas


BANKS AND GS MS JEF WAVE 5 UNDERWAY MOVE NET LONG NOW A cycle low seem s to be in place in the banks and brokers as oil is in the last wave up look for new highs in all the bank and broker sector .I am net long calls


MSMS
1-2 Week Horizon
Price action for the past month or two has been respecting the 21ema, a good sign of bullish movement. Price just touched our buy zone however MACD lines are pointing down and histogram shows down momentum not letting up while stochastics just touched oversold level but still has a little more room to move down. Although price action is currently at a descent area for entry, there is a descent chance for price action to go down or sideways a little bit more before going up.
Weekly time frame shows MACD open pointing up and histogram shows bullish momentum slowing down but not much. Stochastics on the weekly has been on the oversold level but has been in that level for the past few weeks. It seems like it has a little more juice for a bullish move.
Disclaimer
I am not a registered investment advisor and do not offer investment advice and recommendation. All my post is not a recommendation, advise nor a suggestion and should not be used as a replacement for investment advice from a qualified licensed professional. All my post is for, information and entrainment purposes only. You, the reader, bear full responsibility for your own investment and trade decisions and should seek the advice of a qualified securities professional before making any investment or trade.

$MS with a slight bullish outlook following earningsThe PEAD projected a slight bullish outlook for $MS after a positive over reaction after earning release placing the stock in Drift B
If you would like to see the Drift for another stock please message us. Also click on the Like Button if this was useful and follow us or join us.


$MS - Bullish extension beyond ATHA push beyond $76.67 opens some extended targets into ATH:
TG1 🎯- $77.56
TG2 🎯 $79.21
extended TG3 🎯 - $81.50
extended TG4 🎯- $85.20
Invalidated below $70 ⚠️
We are in $76 calls for 1/29
Please like & follow if you enjoy my work! ❤️


Bullish on banksMS showing great upside on here, but always keep both scenarios in mind. My long PT is 91 in a strong bull case and with current market conditions 57 short

$MSMorgan Stanley (NYSE:MS) is approaching a key resistance point, which has contained the stock's attempts over the last 2 weeks. The sideway consolidation for the past couple of days is likely close to completion. Watch for a move above the 68.97 level to confirm further upside. On the bearish side, any close below the rising EMA9 would put the support line at 65.43 back on the map.

$MS Morgan Stanley Analysis Price Target $150News: $10B share repurchase following signal from Fed's stress test results and stimulus progress.
Fundamentals: P/E Ratio 10.83 Div/Yield 2.18 P/B 0.956
Indicators/Patterns: Fib-based trend time, Fib-based trend extension, RSI, Pivots, Rate of Change

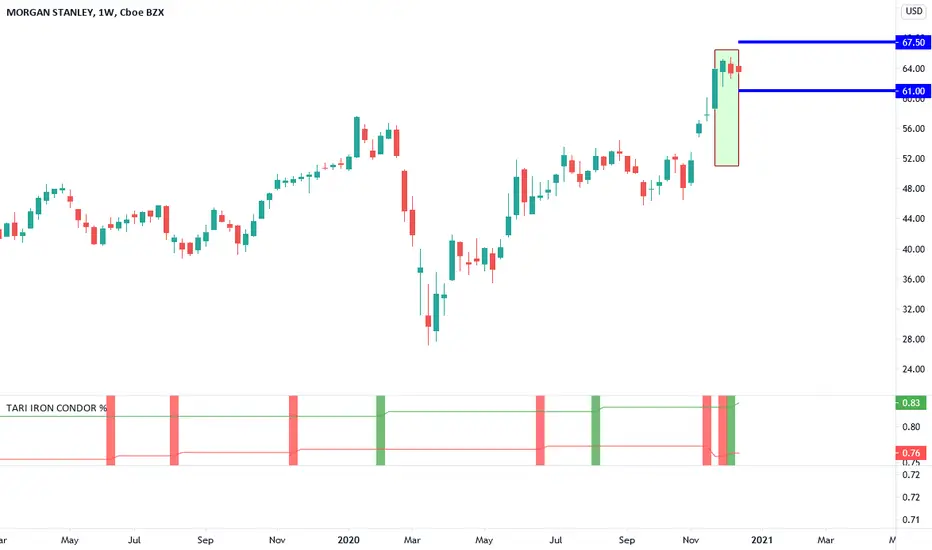
IRON TARIHi guys!
New Iron condor, check my last trades, and get my script for free!
Enjoy your wallet!
Tari.


IRON TARIHi guys!
New Iron condor, chek my last trades, and get my script for free!
Enjoy your wallet!
Tari.

"$MS Long" Bullish will this be able to push to 71.18NYSE:MS Nice retest of the trend will like to see if this has more continuation towards 66 on the break of 63.96 not a bad risk/reward with support setting at 62.83


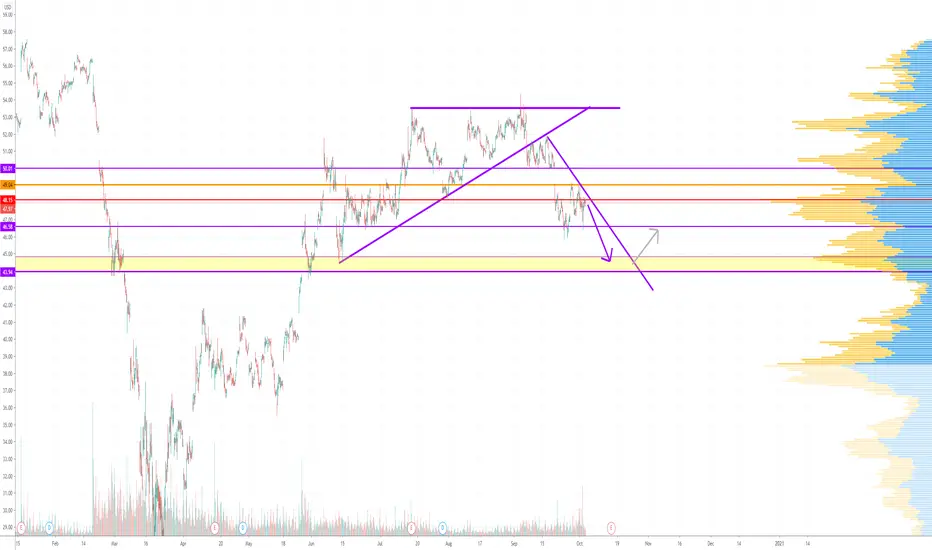
Short now or it would be lateRight now financial sector under pressure and price in declining channel, good possibility for small short to $44 support area. Further movement depends on stimulus pack and earnings report. Most likely long, but who knows.
MACD & STOCH RSI POSITIVELEGAL DISCLAIMER :
This is NOT AN INVESTMENT ADVICE ! It is intended to be used and must be used for informational & educational purposes only. It is very important to do your own analysis before making any investment based on your own personal circumstances. You should take independent financial advice from a professional in connection with, or independently research and verify, any information that you find on our Website and wish to rely upon, whether for the purpose of making an investment decision or otherwise.

Good Earning results for MS with a bullish projection$MS is trading towards the upper boundary of the projected PEAD cone, with price projected to have a bullish stance in the coming period.
