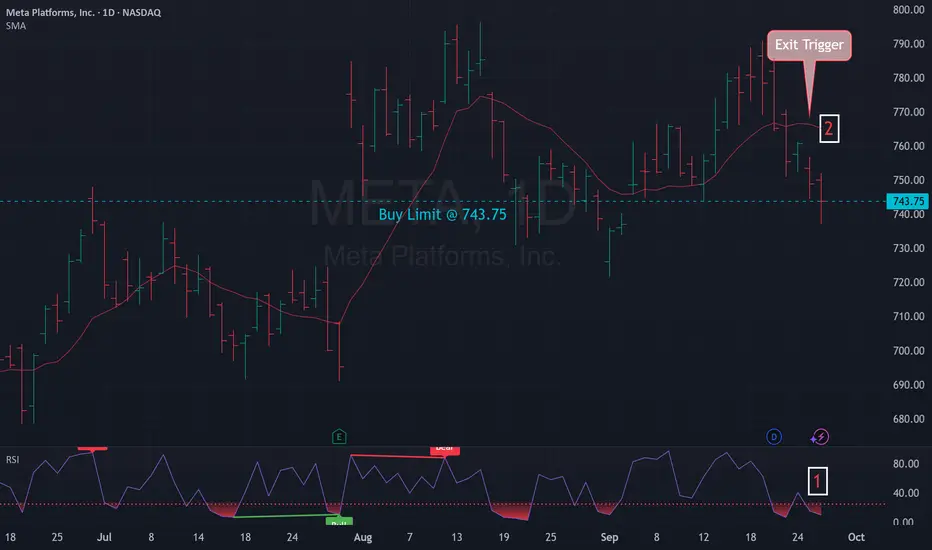
Mean Reversion Setup: META1. RSI in oversold region
2. Price likely to rebound back the the mean
Trade Rules:
Entry Trigger - RSI has cross below oversold region, enter limit buy at close price
Exit Trigger - Close at market when close price cross above exit trigger (Red Line)
FB2A trade ideas
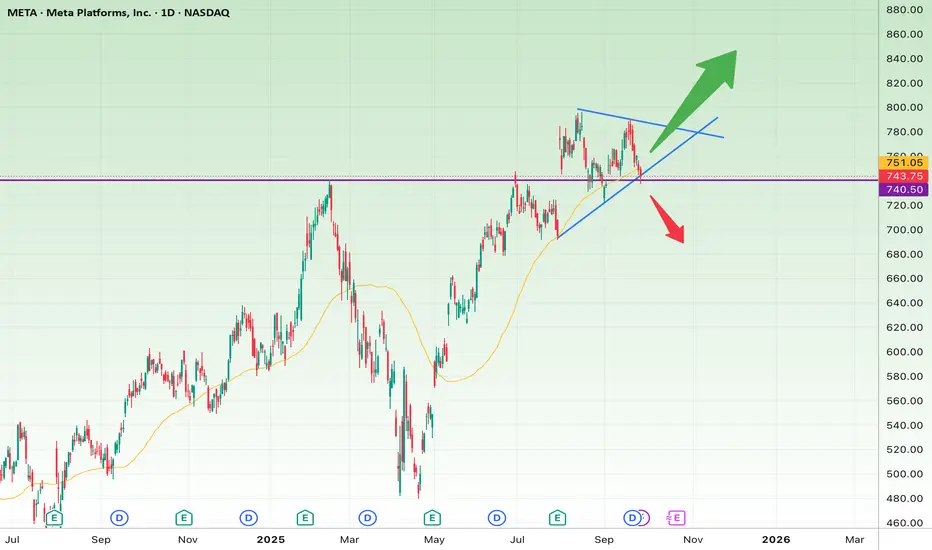
Meta’s Make-or-Break Triangle: Ready to Soar or Sink?Based on the daily chart of Meta Platforms (META):
🔹 Short-Term Outlook (1–3 weeks)
The price is consolidating within a symmetrical triangle pattern, usually a sign of an upcoming breakout.
Key support: $740–$745 (aligned with the rising trendline and 50-day moving average).
Key resistance: $770–$780 (downtrend line of the triangle).
📈 Bullish scenario (short-term):
A breakout above $780 with strong volume could trigger a move toward $805 (first target) and $830 (second target).
Stop-loss: A sustained close below $740.
📉 Bearish scenario (short-term):
A breakdown below $740 opens the door for a quick drop toward $710, and possibly $680.
Stop-loss: Recovery and close back above $760.
🔹 Long-Term Outlook (3–6 months)
The broader trend remains bullish, and the recent pullback looks more like a consolidation within the larger uptrend.
If the price breaks and holds above $805, the medium-term targets are $860 and then $920.
On the downside, losing $680 could trigger a deeper correction toward $620.
✅ Summary:
Short-term: The triangle is nearing completion; whichever side breaks first will define the next move.
Long-term: As long as $680 holds, the bigger picture remains bullish.
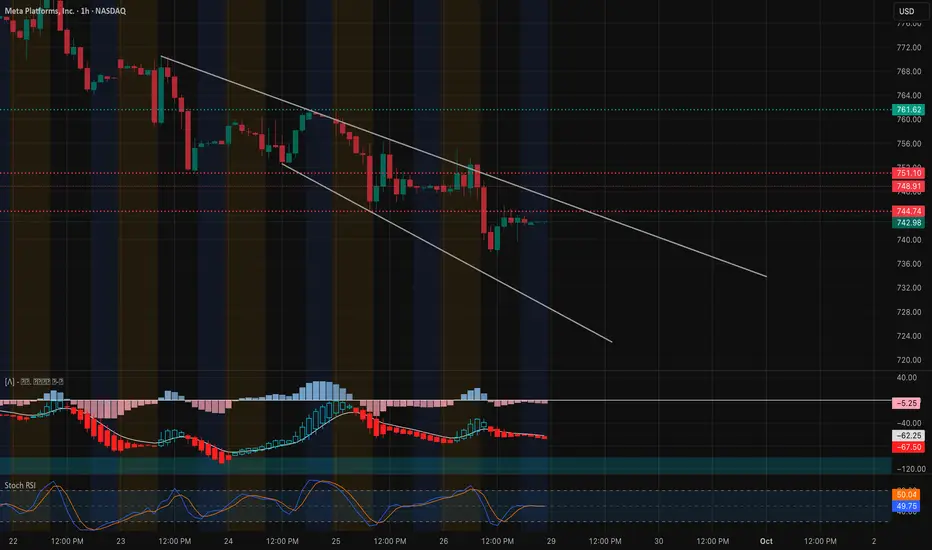
META – Testing Key Demand as Gamma Shows Heavy Put. Sep 29META – Testing Key Demand as Gamma Shows Heavy Put Defense 🛡️
1-Hour Technical Outlook
Meta remains in a well-defined descending channel that started early last week. After a sharp drop into the $737–$740 support area, price is trying to stabilize near $743, but still trades under a dominant downtrend line from the $760 zone. MACD momentum is weak and negative, while the Stoch RSI is only slowly recovering from oversold—suggesting cautious consolidation rather than an aggressive bounce.
Key resistance to watch is $745 (short-term pivot), with larger supply at $752.5 and $760–$765. On the downside, a break below $737–$735 would expose the lower channel target around $725.
Gamma Exposure (GEX) Confirmation:
Options positioning sharpens the roadmap:
* Largest positive GEX / Call Resistance sits near $752.5, matching the first significant upside barrier.
* Secondary call walls are at $760–$767.5, aligning with the top of the broader structure.
* Deep put support is stacked at $740, with heavier layers at $735 and $725, reflecting strong dealer hedging interest at those key floors.
This setup implies that if Meta reclaims $745 with conviction, a gamma squeeze could propel price toward $752.5 and possibly $760. Conversely, sustained action below $737 would likely invite further dealer selling into the mid-$720s.
Trade Ideas & Option Plays for This Week
* Bullish Play: Enter on a clean hourly close above $745, targeting $752.5–$760. Options: 1-week 745 calls or 745/755 call spreads for defined risk.
* Bearish Play: Short below $737, targeting $730–$725. Options: short-dated puts or 740/725 vertical spreads.
* With IVR around 25.5 and IVx near 33.6, options pricing is moderate—favoring debit or credit spreads depending on direction.
My Take:
META is hovering at a decision zone. Heavy put support near $740 suggests a temporary floor, but until bulls reclaim $745, the path of least resistance remains sideways to slightly down. A decisive move through either $745 or $737 will likely set the tone for the week.
Disclaimer: This analysis is for educational purposes only and does not constitute financial advice. Always do your own research and manage risk before trading.
Has META formed a double top?Meta platforms seem to form a double top with a perfect doji structure indicating a indecision at top. This is supported by a bearish divergence at both daily and weekly level. Once it slips below 765, it may run down the line to 740 and 720 levels. (For education purposes only)

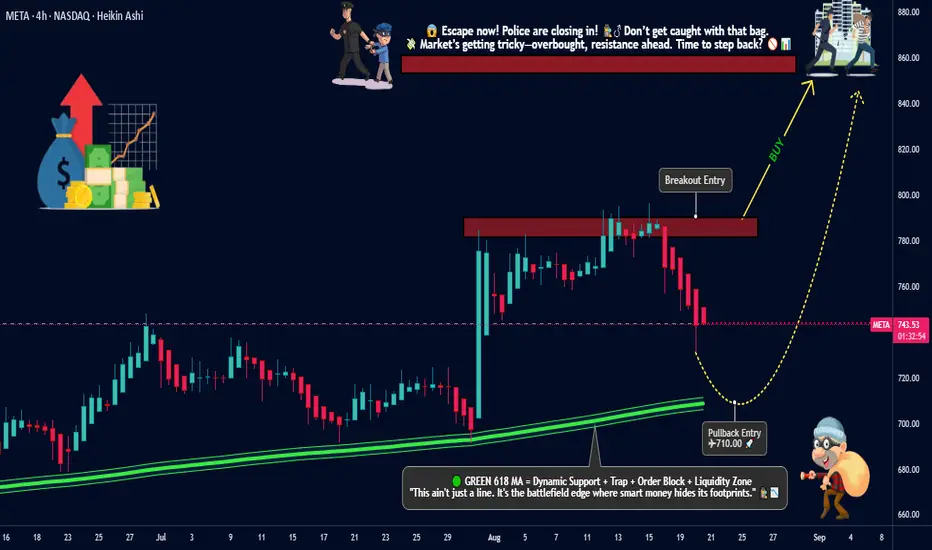
META Platforms Inc. Heist: Breakout Loot vs Pullback Entry🚨META Platforms Inc. Stock Heist Plan🚨
💎Asset: META Platforms Inc. (Swing Trade Robbery)
💎Plan: Bullish Break-In
📈 Breakout Entry: 790.00 (Vault Door Break)
📉 Pullback Entry: 710.00+ (Sweet Spot for the Thieves)
🔑 Any perfect pullback after 710.00, OG thieves may layer orders at chosen levels – stack the loot, DCA style!
🛑 Stop Loss (SL): Thief SL parked @ 675.00 (but remember OG’s—adjust based on your risk appetite & personal robbery strategy).
🎯 Target (Escape Point): 850.00 (Police barricade spotted! Don’t get greedy—take the cash and run before sirens go off 🚔💨).
🕵️♂️ Thief Trader Notes:
Use layering method (multiple limit orders) for maximum loot collection.
Don’t panic if guards (market makers) try to set traps; patience is the true thief’s weapon.
Adjust SL to protect your robbery stash.
Stay sharp—volatility = more doors to break in!
⚠️ Trading Alert for OG’s:
News & earnings reports are like security alarms—avoid entering new trades at that time.
Use a trailing SL to lock in profits once you’re in the getaway car 🚗💨.
💥 If you like this META Heist Plan, smash the Boost Button 💥 and join the robbery crew. Together we loot the markets, one breakout at a time! 🤑💰🏆
META watch $779 then 798: Dual Golden fib barrier to 800 round META earnings blew away the analyst expectations.
Surged into dual Golden fibs at $779.61 then 797.90
This "high gravity" zone will likely hold price for a bit.
.
See "Recent Publications" for previous charts ------------>>>>>>>>>
Such as this one that caught an HUGE BREAKOUT
Hit BOOST and FOLLOW for more such PRECISE and TIMELY charts.
=========================================================
.

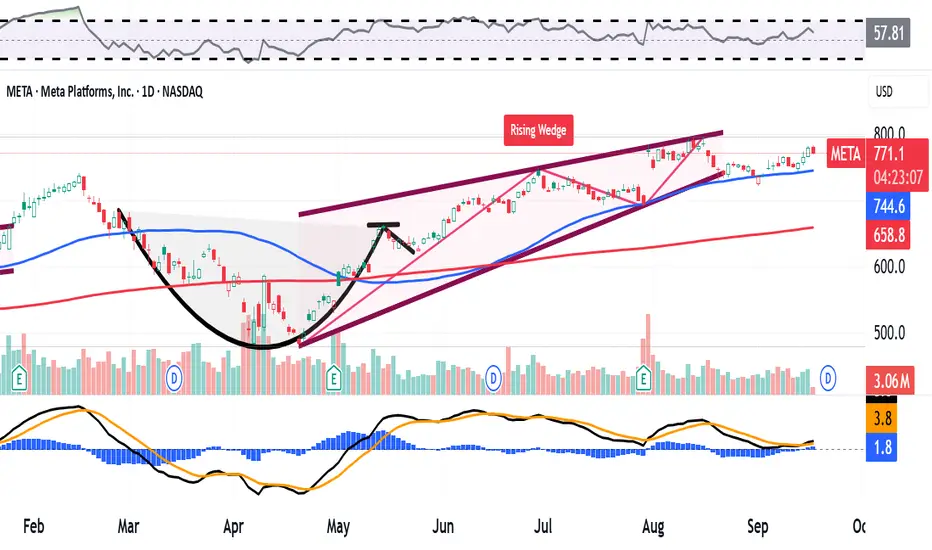
Meta Has Stalled Since July. Here's What Its Chart ShowsMeta Platforms NASDAQ:META has long seemed to defy expectations, but the social-media giant has seen its stock stall over the past six weeks or so. What does its chart say?
Meta's Technical Analysis
META has gained some 30% year to date and more than 40% over the past 12 months, but has gone pretty much nowhere since July. The stock was trading Wednesday morning at $770.77, down 0.3% from its July 31 $773.44 finish.
Let's look at META's six-month chart as of Thursday afternoon:
Readers will see that the stock came out of a bullish "cup-with-handle" pattern in May, as denoted with the black curving line at left in the above chart.
The stock blasted past the pattern's $661 pivot (marked with a short black horizontal line) to hit a $796.25 all-time intraday high on Aug. 15.
Based on that pivot and pattern, a trader such as myself would have had a target price in the mid-$790s. So, that technical pattern worked like a charm.
However, META has traded lower to sideways ever since hitting that apex.
In fact, the stock has developed what's called a "rising-wedge" pattern of bearish reversal that goes all the way back to the very bottom of its cup with handle.
META broke the rising wedge's lower trendline in recent days, but did find support at its 50-day Simple Moving Average (or "SMA," marked with a blue line above). A loss of that line would likely result in some loss of institutional support.
Why would technicals that worked so well for this stock suddenly look so lost? Maybe it becomes very difficult to sell tech stocks or even short them ahead of this week's expected dovish monetary-policy pivot by the Federal Reserve.
An Options Strategy Based on META's Volatility
Under these conditions, options traders might consider a strategy based on Meta's potential volatility instead of taking a directional stake in the stock.
After all, there are some potentially important catalysts for META on the way.
First, markets widely expect the Fed to cut the Fed Funds rate's target rate on Wednesday afternoon.
The Fed has scheduled its next policy decision after that for Oct. 29 -- roughly the same time that Wall Street expects Meta to release Q3 results. (META has yet to announce an official earnings-release date.)
An example of a volatility strategy would be a so-called "strangle." This would involve:
-- Selling a $690 Oct. 31 put.
-- Selling an $810 Oct. 31 call.
As I write this, that trade would net a rough $31 in premiums.
Of course, there's certainly risk in this move.
For instance, the trader would be obligated to purchase META shares at $690 or sell them at $810 if the stock moves beyond either of those bands.
That said, the trade doesn't lose money on a net basis in this set-up unless the stock trades above $846 or below $659 at expiration.
This chart illustrates the price levels for the equity where profit created by the options set up starts to degrade:
A more-cautious trader might purchase an even-wider strangle in order to manage the risk. However, that would eat into the net credit received from the premiums collected.
(Moomoo Technologies Inc. Markets Commentator Stephen “Sarge” Guilfoyle had no position in META at the time of writing this column.)
This article discusses technical analysis, other approaches, including fundamental analysis, may offer very different views. The examples provided are for illustrative purposes only and are not intended to be reflective of the results you can expect to achieve. Specific security charts used are for illustrative purposes only and are not a recommendation, offer to sell, or a solicitation of an offer to buy any security. Past investment performance does not indicate or guarantee future success. Returns will vary, and all investments carry risks, including loss of principal. This content is also not a research report and is not intended to serve as the basis for any investment decision. The information contained in this article does not purport to be a complete description of the securities, markets, or developments referred to in this material. Moomoo and its affiliates make no representation or warranty as to the article's adequacy, completeness, accuracy or timeliness for any particular purpose of the above content. Furthermore, there is no guarantee that any statements, estimates, price targets, opinions or forecasts provided herein will prove to be correct.
Options trading is risky and not appropriate for everyone. Read the Options Disclosure Document ( j.moomoo.com ) before trading. Options are complex and you may quickly lose the entire investment. Supporting docs for any claims will be furnished upon request.
Options trading subject to eligibility requirements. Strategies available will depend on options level approved.
Moomoo is a financial information and trading app offered by Moomoo Technologies Inc. In the U.S., investment products and services on Moomoo are offered by Moomoo Financial Inc., Member FINRA/SIPC.
TradingView is an independent third party not affiliated with Moomoo Financial Inc., Moomoo Technologies Inc., or its affiliates. Moomoo Financial Inc. and its affiliates do not endorse, represent or warrant the completeness and accuracy of the data and information available on the TradingView platform and are not responsible for any services provided by the third-party platform.
META Is this the final rally to $970??Meta Platforms (META) has been rising this month after successfully coming off August's Bull Flag. Technically this is an extension of the very aggressive rebound since the April 07 2025 Trade War bottom. It also took place right above the 1W MA100 (green trend-line).
This is quite similar to the Feb - March 2020 COVID crash, both corrections were -35.39% and -38.52% respectively. At the same time, they were both carried out by Bullish Megaphone patterns with similar 1W RSI sequences.
The Channel Up (green) that followed the COVID crash peaked on its 1.618 Fibonacci extension before turning sideways towards the 1W MA50 (blue trend-line) again.
As a result, given the remarkable symmetry between the two fractals so far, we can expect the current (post Trade War) Channel Up to peak near its 1.618 Fib ext at around $970.00.
-------------------------------------------------------------------------------
** Please LIKE 👍, FOLLOW ✅, SHARE 🙌 and COMMENT ✍ if you enjoy this idea! Also share your ideas and charts in the comments section below! This is best way to keep it relevant, support us, keep the content here free and allow the idea to reach as many people as possible. **
-------------------------------------------------------------------------------
💸💸💸💸💸💸
👇 👇 👇 👇 👇 👇

Meta Platforms (META) Shares Hold Steady After MishapMeta Platforms (META) Shares Hold Steady After Mishap
An awkward moment occurred at the Meta Connect 2025 product presentation, where Mark Zuckerberg showcased innovations but ran into technical glitches:
→ The AI assistant built into the Ray-Ban Display smart glasses froze;
→ The neural bracelet, designed to control the interface with gestures, failed to answer a video call.
News of the mishap quickly spread across social media, with the blame for the issues pinned on Wi-Fi. Despite the reputational blow, META shares showed resilience. This suggests that investors are focusing on deeper, fundamental factors, including the potential of augmented reality and the social media giant’s drive for greater efficiency.
Technical Analysis of META Chart
Analysing META’s chart a month ago, we:
→ Drew an ascending channel and a resistance area from the bearish gap (shown in purple);
→ Noted that the price was around its median;
→ Listed bearish signals and suggested a correction, pointing out that in such a case bulls might step in at support around $747 or the channel’s lower boundary.
Indeed, since then (as shown by the dashed arrow):
→ The price fell to the channel’s lower boundary and then rebounded (confirming bullish activity);
→ A bearish breakout attempt failed, and the price returned to the channel, forming a bullish gap (shown in yellow), which acted as support on 12 September.
How Might the Price Move Next?
From a bullish perspective:
→ The ascending channel remains valid, while the price is holding within a steeper growth channel (highlighted in turquoise).
→ The $764 level has switched its role from resistance to support.
→ As shown by the red lines, META’s price action over the past two months can be viewed as a large bullish flag (a corrective pattern within an uptrend) with the potential for trend continuation.
From a bearish perspective:
→ Pressure may come from the psychological $800 per share level.
→ The bearish gap area acts as resistance, as indicated by the black arrow.
→ It is possible that if the price falls below the channel’s lower boundary, the median could act as resistance.
Taking all of this into account, we could assume that bullish sentiment (supported by the Fed’s rate cut) may persist, although the $790–800 area appears to be a key obstacle for META shares.
This article represents the opinion of the Companies operating under the FXOpen brand only. It is not to be construed as an offer, solicitation, or recommendation with respect to products and services provided by the Companies operating under the FXOpen brand, nor is it to be considered financial advice.

META 1H + GEX Game Plan for Tue, Sep 16META Eyes 774 Gamma Wall — Will the Push Hold or Fade? 🔥
Market Structure (1-Hour View)
* Strong breakout: META ripped from 745 support through 760 and tapped a new short-term high at ≈774, now consolidating near 764–768.
* Trend support: Rising lower trendline sits near 757–760, with broader base around 745–748.
* Momentum: MACD just eased from a strong push; Stoch RSI cooled toward mid-zone — a sign that META may pause before the next leg.
Key Levels to Watch
* Resistance: 768.5 (immediate cap), 774.1 (recent high / call wall), and 780–800 if squeeze extends.
* Support: 760 (first intraday shelf), 757.1–756.5, and 745.0 (major gamma + HVL pivot).
GEX Read (Sep 16)
* Highest positive NETGEX / Gamma magnet: 774.1
* 2nd Call Wall: ~780, 3rd Call Wall: ~800.
* Put walls / supports: 745 (massive -76% GEX level) and 735.
* Options sentiment: Calls ~27%, IVR ~8.3, IVx ~33.4 → option premiums moderate, decent for debit spreads.
Implication:
* As long as META holds above 760, dealers may allow an upper pin toward 774.
* A daily close >774 opens a squeeze toward 780–800.
* Lose 760/757, and hedging can drag price quickly toward 745 gamma/put wall.
Trade Scenarios
1) Bullish Breakout
* Trigger: Hourly close >768.5–770 with strong tape.
* Entry: 770.5–772 on retest.
* Targets: 774.1 → 780, stretch to 800 if flows remain strong.
* Stop: Below 764.
* Options: 775/780 call debit spread expiring this week.
2) Range Fade
* Trigger: Failure to reclaim 770 and a 30–60m rejection wick.
* Entry: 768–769.5 short.
* Targets: 760, then 757.
* Stop: Above 772.
* Options: 770P or 768/760 put spread for quick fade.
3) Breakdown From Key Pivot
* Trigger: Clean 1H break <757 with retest fail.
* Entry: 756–757 short.
* Targets: 745.0 gamma/put wall, extended 735 if momentum accelerates.
* Stop: Back above 760.
* Options: 755/745 put spread for a measured pullback.
Scalping & Swing Notes
* Early in session watch 764–768 chop zone. Quick scalps inside may whipsaw — wait for a clear break.
* EMA/VWAP retests that hold above 764–765 favor continuation; fails below 760 lean bearish.
Risk & Management
* Scale out partials at first target; trail stops if META trends toward 774+.
* Be mindful of IV crush if breakout stalls — especially on same-week options.
This analysis is for educational purposes only and does not constitute financial advice. Always manage risk and trade your plan.

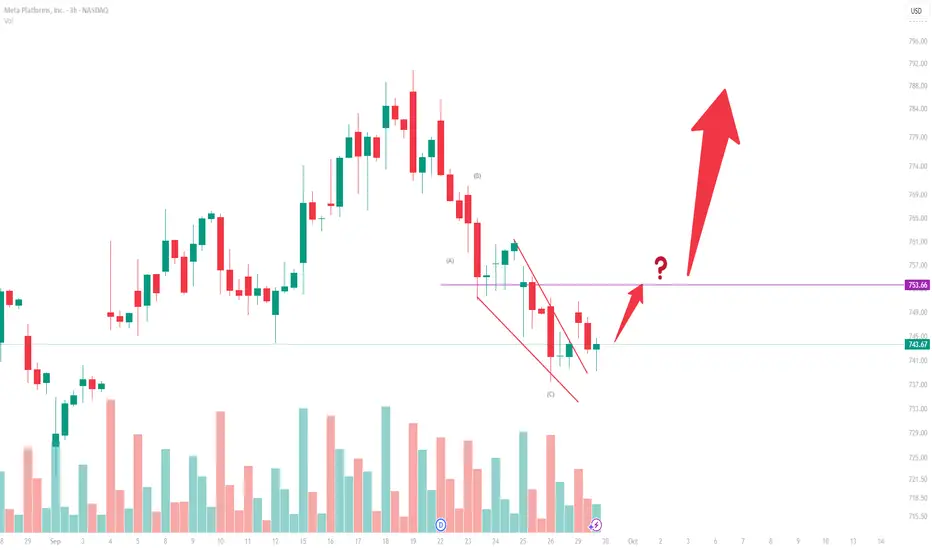
META (3H) — Elliott Wave AnalysisStructure
The chart displays a zigzag corrective pattern labeled (A) → (B) → (C).
Wave (C) unfolds inside a falling wedge (ending diagonal), a common terminal structure at the end of corrections.
The breakout attempt from this wedge suggests that Wave (C) may be complete.
Wave (A)
A sharp, impulsive decline in five subwaves.
Defines the start of the correction.
Wave (B)
A three-wave upward retracement.
Retraces roughly 0.38–0.50 of Wave (A), consistent with zigzag proportions.
Wave (C)
A five-wave structure contained within a converging wedge.
Subwave (v) shows diminishing momentum, typical of an ending diagonal.
The upward break through the wedge top signals the potential termination of Wave (C).
Key Level
753.66 is the critical resistance.
A confirmed move above 753.66 validates that the (A)–(B)–(C) correction has ended and a new impulsive sequence may be starting.
Failure to reclaim 753.66 leaves the risk that the bounce is only a temporary rally within a larger correction.
Alternate Scenario
A new low beneath the Wave (C) termination point would invalidate the completion view, implying the correction is extending.
META at a Critical Inflection Point: Support, FVG, and RSI AlignMeta Platforms (META) is at a decisive technical level where multiple signals converge, making this zone one to watch closely.
🔹 Technical Confluence:
• Trendline Support 🟢: Price is retesting the long-term ascending trendline, which has acted as a reliable base for the ongoing uptrend.
• Fair Value Gap (FVG) 📊: Price is sitting within a daily FVG, an area that often attracts liquidity and serves as a reversal zone.
• RSI at Lower Band 📉: The RSI remains flat at the oversold boundary, suggesting bearish momentum may be losing steam.
• Volume Context 🔎: Historical activity shows strong buying interest around this region, further validating support.
🔹 Fundamental Context:
Meta’s fundamentals remain robust — strong ad revenue recovery, efficiency-driven margin expansion, and heavy AI infrastructure investments continue to underpin long-term growth. Recent earnings beats reinforce investor confidence even during short-term corrections.
🔹 Trade Setup:
• Entry Zone: $740–745
• Profit Target: $785–800
• Stop Loss: Below $720 (break of structure)
📌 Conclusion: META is sitting at a make-or-break zone. A hold above current support favors a rebound toward prior highs, while a breakdown below $720 could trigger a deeper correction.
Global Energy and Geopolitical Trade Routes1. Introduction
Energy has always been a critical driver of human civilization, influencing economic growth, technological progress, and geopolitical power. From coal in the Industrial Revolution to oil and natural gas in the modern era, energy resources are both strategic assets and commodities. The flow of energy across borders—through pipelines, shipping lanes, and electricity grids—forms a complex network of trade routes that shapes global geopolitics. Understanding these trade routes is essential for comprehending the interplay between energy security, international relations, and economic stability.
Global energy trade is not just about moving fuel from one country to another; it is about ensuring reliability, affordability, and access in a world of shifting political alliances, regional conflicts, and environmental concerns. The strategic positioning of energy resources often determines the balance of power in international politics, making trade routes both economic lifelines and potential flashpoints for conflict.
2. Evolution of Energy Trade
2.1 Early Energy Trade
Historically, energy trade was local. Coal, wood, and water-powered mills dominated economies. With the discovery of oil in the 19th century, energy trade expanded internationally. Oil pipelines and shipping routes allowed nations to access distant reserves. Countries like the United States, Russia, and the Middle East became key players due to their rich resources.
2.2 The Oil Era and Strategic Importance
The 20th century saw oil emerge as the world’s dominant energy source. The U.S., Middle Eastern nations, and later Russia became central to the global energy landscape. Key shipping routes like the Strait of Hormuz, the Suez Canal, and the Panama Canal gained strategic importance as chokepoints controlling the flow of petroleum. Control over these routes often translated into geopolitical leverage.
2.3 Natural Gas and Modern Diversification
The late 20th and early 21st centuries brought diversification, with natural gas, coal, and renewable energy playing significant roles. LNG (liquefied natural gas) trade added a new dimension to energy geopolitics, allowing countries without pipeline access to participate in global markets. The development of liquefaction and regasification terminals enabled nations to bypass traditional transit routes, reducing dependency on politically unstable regions.
3. Types of Energy in Global Trade
3.1 Crude Oil
Crude oil remains the cornerstone of energy trade. It is used in transportation, manufacturing, and as feedstock for petrochemicals. Oil trade is highly concentrated; the Middle East holds roughly a third of global proven reserves, and the Organization of the Petroleum Exporting Countries (OPEC) plays a major role in controlling supply and prices.
Key characteristics:
Transported via tankers and pipelines.
Highly sensitive to geopolitical events.
Prices influenced by supply disruptions, conflicts, and sanctions.
3.2 Natural Gas
Natural gas is increasingly important due to its lower carbon footprint compared to coal. It is traded through pipelines (e.g., Russia–Europe networks) and as LNG. Global gas trade is shaped by regional alliances, energy contracts, and infrastructure availability.
Key characteristics:
Regionalized market, unlike oil’s global market.
Dependent on pipeline diplomacy.
LNG offers flexibility but requires expensive infrastructure.
3.3 Coal
Coal trade has declined in advanced economies but remains vital for emerging economies like India and China. It is largely transported via shipping and rail networks. Political stability in supplier countries like Australia and Indonesia significantly affects global coal markets.
3.4 Renewables and Electricity
While renewable energy does not traditionally require trade routes like fossil fuels, cross-border electricity trade (via grids) and critical materials for solar panels, wind turbines, and batteries are increasingly relevant. Materials like lithium, cobalt, and rare earth elements follow trade routes essential for renewable infrastructure.
4. Major Global Energy Trade Routes
Energy trade relies on a combination of maritime chokepoints, pipelines, and rail/road networks. Each route has strategic, economic, and geopolitical significance.
4.1 Maritime Routes
Maritime routes dominate global energy trade due to the volume of crude oil and LNG transported by tankers.
Strait of Hormuz: Located between Oman and Iran, it is the most critical chokepoint for oil transport. Approximately 20–25% of global oil passes through this strait daily. Any disruption, due to geopolitical tensions, can sharply increase global oil prices.
Suez Canal: Connecting the Mediterranean and Red Sea, this canal is vital for oil, LNG, and other commodities between Europe and Asia. Blockages, like the 2021 Ever Given incident, highlight the canal’s economic vulnerability.
Bab el-Mandeb Strait: Linking the Red Sea to the Gulf of Aden, this route is crucial for Middle Eastern oil shipments to Europe and North America. Piracy and regional conflicts pose threats.
Malacca Strait: Connecting the Indian Ocean with the South China Sea, this strait is critical for oil supplies to East Asia, especially China, Japan, and South Korea.
Panama Canal: Facilitates oil and LNG transport between the Atlantic and Pacific Oceans. While smaller in volume compared to the Middle East, its strategic importance is increasing for the Americas.
4.2 Pipelines
Pipelines are the backbone of natural gas and oil transport on land. They reduce dependence on maritime routes but are vulnerable to political conflicts.
Druzhba Pipeline: Russia to Europe, transporting crude oil to central and eastern Europe.
Nord Stream 1 & 2: Russia to Germany, key to European natural gas security.
Trans-Anatolian Pipeline (TANAP): Part of the Southern Gas Corridor, linking Azerbaijan to Europe.
Keystone Pipeline: Canada to the U.S., transporting crude oil.
EastMed Pipeline (planned): Will link Eastern Mediterranean gas reserves to Europe.
4.3 Rail and Road Networks
While less significant than pipelines or shipping for bulk trade, rail and road are essential for regional energy supply, particularly for coal and refined products in Asia and Europe.
5. Geopolitical Dynamics of Energy Trade
Energy trade routes are highly sensitive to geopolitical shifts. Control over resources and transit routes confers power, while dependency on foreign energy exposes vulnerabilities.
5.1 Middle East Influence
The Middle East controls a significant portion of global oil reserves, giving it leverage over oil prices. Conflicts, sanctions, and OPEC decisions have historically influenced global energy markets. Countries reliant on imported oil, like Japan or Europe, must navigate complex relationships with suppliers.
5.2 Russian Energy Leverage
Russia’s natural gas exports to Europe create strategic dependencies. Pipeline politics, especially through Ukraine and Belarus, influence European energy security. Energy diplomacy becomes a tool for exerting influence or negotiating sanctions relief.
5.3 U.S. Energy Policy
The U.S., a major oil and LNG producer, uses energy exports to strengthen geopolitical ties. Sanctions on Iran or Venezuela, or policies promoting shale oil, affect global energy flows.
5.4 Asia’s Growing Demand
China, India, and other Asian economies are increasingly shaping energy trade. The dependence on Middle Eastern oil and Southeast Asian LNG creates vulnerabilities and strategic interests in maritime security.
5.5 Geopolitical Risks and Chokepoints
Maritime chokepoints are vulnerable to blockades, piracy, or military confrontation. Countries dependent on these routes invest in naval capabilities and strategic partnerships to ensure uninterrupted energy flow.
6. Economic Impacts of Energy Trade Routes
The economic significance of energy trade routes extends beyond the direct cost of fuel. It affects global markets, inflation, and development.
Price Volatility: Disruptions in key routes can spike oil and gas prices, impacting transportation, manufacturing, and electricity costs globally.
Supply Security: Nations with diversified supply routes mitigate economic risks.
Investment in Infrastructure: Ports, pipelines, and LNG terminals require massive investment, influencing economic priorities.
Global Trade Patterns: Energy availability influences industrial location, trade balances, and regional development.
7. Environmental and Security Considerations
Energy trade routes are increasingly scrutinized for environmental and security concerns.
Oil Spills: Shipping routes like the Strait of Malacca and Suez Canal are at risk of spills affecting biodiversity.
Pipeline Sabotage: Political instability or terrorism can target pipelines, affecting supply security.
Climate Policies: Transition to renewables could alter trade routes and reduce dependency on fossil fuels, while critical minerals gain importance.
8. Future Trends in Global Energy Trade
8.1 Diversification and Redundancy
Countries are investing in alternative routes and suppliers to reduce dependency. LNG terminals, new pipelines, and renewable energy infrastructure increase resilience.
8.2 Renewable Energy and Critical Minerals
Trade in lithium, cobalt, and rare earths is becoming geopolitically significant. Battery production and renewable energy expansion will create new “energy trade routes” based on materials rather than fuel.
8.3 Digitalization and Smart Grids
Electricity trade across borders via smart grids could redefine energy flows. Countries may trade excess renewable energy in real time, reducing dependency on fossil fuels and traditional routes.
8.4 Geopolitical Realignment
Shifting alliances, energy sanctions, and regional conflicts will continue to shape trade. Asia’s growing energy demand, U.S. export policies, and Middle Eastern strategies will remain central to global energy geopolitics.
9. Case Studies
9.1 Russia-Ukraine Energy Conflict
The Russia-Ukraine conflict demonstrated how pipeline control and sanctions influence European energy security. Gas supply disruptions forced Europe to diversify LNG imports, highlighting vulnerability to geopolitical risk.
9.2 Strait of Hormuz Tensions
Repeated tensions in the Strait of Hormuz illustrate how a narrow chokepoint can impact global oil prices. Any military confrontation in this region could disrupt a significant portion of global oil trade.
9.3 U.S. LNG Exports to Europe
The U.S. rapidly expanded LNG exports to Europe after 2022, mitigating Russian energy leverage and reshaping global LNG trade dynamics.
10. Conclusion
Global energy and geopolitical trade routes are more than logistical pathways; they are instruments of power, security, and economic influence. The strategic positioning of oil, gas, coal, and renewable energy resources shapes alliances, conflicts, and global markets. Maritime chokepoints, pipelines, and infrastructure investments are central to energy security, while evolving technologies and renewables are gradually transforming trade patterns.
Understanding these routes is essential for policymakers, businesses, and investors. As the world transitions to low-carbon energy, the nature of these trade routes will evolve, but their geopolitical and economic significance will remain critical. Energy trade, in essence, is a mirror reflecting the broader patterns of global power, economics, and diplomacy.
Risk in International Market1. Understanding Risk in International Markets
Risk in international markets refers to the uncertainty of outcomes when engaging in cross-border transactions, investments, or trade. These risks can impact profitability, growth, and sustainability.
For example:
A company exporting goods to another country may face currency exchange fluctuations that erode profit margins.
A multinational corporation (MNC) investing in a politically unstable country may face expropriation or asset seizure.
A sudden tariff imposition or trade sanction could disrupt supply chains.
International risks are interconnected. An economic crisis in one country can trigger contagion effects worldwide. Thus, risk management in global markets requires a broad, multi-dimensional approach.
2. Categories of Risks in International Markets
International risks can be broadly classified into the following categories:
2.1 Political Risk
Political risk arises when government policies, political instability, or conflicts impact international trade and investment.
Examples: Nationalization of assets, sudden changes in trade regulations, wars, or regime changes.
Case Study: In 2014, many Western firms in Russia faced difficulties after sanctions and retaliatory measures disrupted business operations.
Subtypes:
Expropriation risk (government seizing foreign assets).
Political violence (civil war, terrorism, coups).
Regulatory changes (new trade barriers, taxes, or restrictions).
2.2 Economic and Financial Risk
Economic risk involves the uncertainty of operating in economies with unstable macroeconomic conditions.
Examples: Inflation, recession, unemployment, or sovereign debt crises.
Currency risk (Exchange Rate Volatility): A major component where fluctuating exchange rates can reduce profits.
Case Study: The Asian Financial Crisis (1997) saw many businesses collapse due to currency devaluation.
Subtypes:
Inflation risk
Interest rate risk
Liquidity risk
Balance of payments crisis
2.3 Currency and Exchange Rate Risk
Exchange rate fluctuations are one of the most common risks in global trade.
When a company exports goods, a sudden fall in the buyer’s currency reduces earnings when converted to the seller’s currency.
Importers face higher costs when their domestic currency depreciates.
Case Study: Indian IT companies billing in US dollars benefit from a stronger dollar, but importers of oil in India face higher costs when the rupee depreciates.
2.4 Legal and Regulatory Risk
International markets operate under diverse legal systems. A company must comply with multiple laws, including labor, taxation, intellectual property rights (IPR), and environmental regulations.
Examples:
A pharmaceutical company selling in Europe must comply with strict EU health and safety standards.
Data protection laws like GDPR affect global tech firms.
Failure to comply can lead to penalties, lawsuits, or bans.
2.5 Cultural and Social Risk
Culture impacts consumer behavior, workplace practices, and negotiations. Misunderstanding cultural norms can damage a company’s brand image.
Examples:
Marketing blunders due to mistranslation of slogans.
Fast-food chains adapting menus to local tastes (e.g., McDonald’s in India does not serve beef).
Cultural risks also affect labor relations, communication styles, and management practices.
2.6 Supply Chain and Operational Risk
In global trade, companies rely on complex supply chains. Disruptions at any point can impact operations worldwide.
Examples:
Natural disasters halting production.
Port strikes delaying shipments.
Shortages of raw materials.
Case Study: The COVID-19 pandemic disrupted global supply chains, causing shortages in semiconductors, medicines, and shipping delays.
2.7 Geopolitical and Security Risk
Tensions between countries can lead to sanctions, embargoes, or outright bans. Security risks such as terrorism, piracy, and cyber-attacks further complicate global trade.
Examples:
The US-China trade war caused tariffs and uncertainty in global supply chains.
Cyber-attacks on financial institutions threaten international capital flows.
2.8 Environmental and Sustainability Risk
Global businesses must consider environmental regulations, climate risks, and sustainability demands.
Examples:
Stricter carbon emission rules affecting manufacturing firms.
Climate change threatening agriculture and insurance industries.
Case Study: European Union’s Carbon Border Adjustment Mechanism (CBAM) impacts exporters from developing nations by imposing carbon tariffs.
2.9 Technological Risk
Technology drives global trade but also creates risks:
Cybersecurity threats.
Dependence on foreign technology providers.
Rapid technological obsolescence.
Example: Semiconductor shortages exposed the vulnerability of global industries dependent on a handful of suppliers.
2.10 Reputational Risk
A company’s reputation is global. A scandal in one country can affect its worldwide image.
Case Study: Volkswagen’s “Dieselgate” emissions scandal damaged its global reputation, leading to billions in losses.
3. Real-World Examples of International Market Risks
Brexit (2016–2020): Created uncertainty for businesses trading between the UK and EU, leading to tariffs, regulatory complications, and currency volatility.
COVID-19 Pandemic (2020–2022): A global supply chain crisis, demand shocks, and international border restrictions.
Russia-Ukraine War (2022 onwards): Caused oil price volatility, sanctions, and food supply disruptions.
US-China Trade War: Tariff escalations disrupted supply chains, affecting electronics, steel, and agriculture.
4. Impact of Risks on International Business
Profitability: Exchange rate swings and tariffs can reduce profit margins.
Market Entry Barriers: Political instability or protectionist policies deter investments.
Supply Chain Vulnerabilities: Disruptions increase operational costs.
Investor Confidence: Economic instability reduces foreign direct investment (FDI).
Strategic Shifts: Companies diversify operations to reduce overdependence on one country.
5. Strategies to Manage International Market Risks
5.1 Hedging and Financial Instruments
Use of derivatives like futures, options, and swaps to manage currency and interest rate risks.
Example: Exporters hedge against exchange rate volatility by locking in forward contracts.
5.2 Diversification
Geographic diversification reduces dependence on one market.
Supply chain diversification reduces risk from disruptions in one region.
5.3 Insurance
Political risk insurance protects companies against expropriation, terrorism, or war.
Trade credit insurance covers non-payment by foreign buyers.
5.4 Strong Legal Compliance
Understanding and complying with local laws reduces regulatory risk.
Companies often hire local legal experts.
5.5 Cultural Adaptation
Training employees in cross-cultural management.
Localizing products and marketing strategies.
5.6 Scenario Planning and Risk Assessment
Conducting “what-if” analyses to prepare for potential disruptions.
Example: Airlines hedge fuel costs against oil price fluctuations.
5.7 Building Resilient Supply Chains
Developing multiple suppliers.
Using digital technologies (AI, blockchain) for supply chain transparency.
5.8 Sustainability and ESG Practices
Adopting environmentally responsible strategies reduces reputational and regulatory risks.
Attracts socially conscious investors.
6. The Future of Risk in International Markets
Global risks are evolving rapidly:
Climate change will intensify natural disasters and regulatory pressures.
Technological risks will grow with AI, automation, and cybersecurity challenges.
Geopolitical rivalries (US-China, Russia-West) will increase uncertainty.
Global financial risks like debt crises and inflationary pressures may spread faster due to interconnected economies.
Companies of the future must adopt resilient, adaptive, and technology-driven risk management frameworks.
Conclusion
International markets present unparalleled opportunities, but they are inherently riskier than domestic markets. Risks in the international market stem from politics, economics, culture, law, technology, environment, and global interconnectedness.
Businesses that succeed in global markets are not those that avoid risks entirely but those that anticipate, assess, and strategically manage risks. From hedging financial exposures to diversifying supply chains, from complying with local laws to embracing sustainability, risk management is the backbone of international business success.
As the global economy grows more complex, the key will be resilience: the ability to withstand shocks, adapt to new realities, and continue to thrive despite uncertainty.

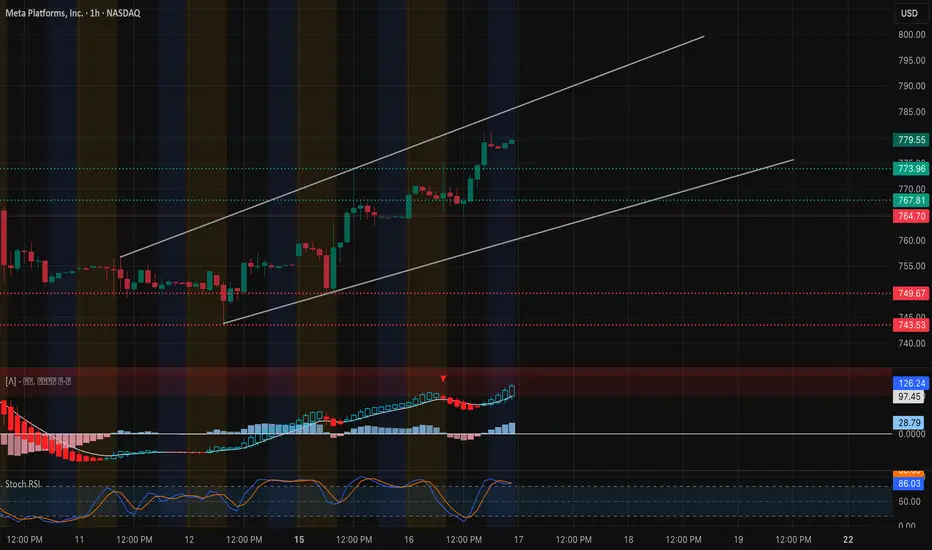
META Riding the Channel – Sept 18 Trade Plan 🚀 Here’s a professional desk-style update for Meta heading into Wednesday, using the 1-hour chart and GEX option data.
1️⃣ Price Action & Structure
* Up-channel intact: Meta continues to grind inside a rising channel, now around $779. The lower boundary near $768 held well, showing buyers still in control.
* Immediate resistance: A close above $782–783 could open the door toward $795–800 where heavier supply and gamma walls sit.
* Support zone: First cushion at $770, deeper pullback support near $755–748.
2️⃣ GEX (Options Flow) Check
* Upside gamma: Big call clusters stack at $782.5 and $800, creating natural magnets if momentum continues.
* Put side: Strongest put wall is around $745, giving a well-defined risk floor.
* Flow mix: Calls make up roughly 30% of current options flow, a balanced but still bullish lean with IVR near 9—options are relatively cheap.
3️⃣ Trading Thoughts
* Bullish bias: Hourly close above $783 is the breakout trigger. Short-term targets: $795 and $800. Stop idea: under $770.
* Cautious short scalp: Only if $770 fails on heavy volume. Next downside magnets are $755 and $748.
4️⃣ Option Angles
* Directional play: 780/800 call spreads give clean risk-reward for a channel continuation.
* Income strategy: Selling $745 puts fits if you see Meta holding the current uptrend.
5️⃣ My View
Meta is quietly respecting its channel while tech stays bid. A confirmed break over $783 could invite quick momentum into the $790s and possibly $800. Until then, buy dips near $770 with stops tight.
Disclaimer: This analysis is for educational discussion only and is not financial advice. Always do your own research and manage risk before trading.

META: Bulls Eye Key Level for Sept 17 – Swing & Scalp Setups1-Hour Chart Technical View
META is riding a clean ascending channel, holding a steady higher-high/higher-low pattern. Friday’s move left a bullish Change of Character (CHoCH) near $772 and confirmed strength with closes above $779. Current intraday trend is supported by the 9 EMA > 21 EMA alignment, and momentum oscillators (MACD, Stoch) continue to lean bullish with no major divergence yet.
* Immediate Support: $774 and $768 (mid-channel / intraday demand)
* Major Support: $764.7 (strong breakout retest zone)
* Upside Zone: $788–$795 is first key resistance; a break targets the $800 call wall and potentially $820 if momentum accelerates.
GEX & Options Flow
Options data shows stacked call gamma above spot:
* Call Walls: $795 (3rd call wall), $800 (highest positive NET GEX & key resistance), then $820.
* Put Defense: $747.5 HVL (09/19) with larger put walls around $720 and $710.
* GEX Bias: Net call gamma dominates, suggesting dealers hedge by buying dips, which often dampens downside volatility and supports gradual grind-ups.
IV Rank is modest (IVR ~8.6) with IVx ~33.9, implying option premiums are relatively low for directional plays.
Trade Thoughts & Suggestions
* Swing Idea: As long as $774 holds, risk-defined swing longs can target $795–$800 with room toward $820 if $800 breaks on volume.
* Scalp Idea: Watch 1-hour re-tests of $779/$774 for quick intraday longs, or fade a failed breakout above $795 if volume thins.
* Risk Zone: A sustained break below $764.7 would flip structure short-term and open $749.5 then $743.7.
Quick Take
META is technically strong with bullish gamma support. For Sept 17, price action favors controlled dip-buys until $800 is tested. Scalp traders can play the $779–$788 range; swing traders can look for $795–$820 extensions.
Disclaimer: This analysis is for educational purposes only and does not constitute financial advice. Always do your own research and manage risk before trading.
World Bank & Emerging Market DevelopmentUnderstanding Emerging Markets
1. Defining Emerging Markets
An “emerging market” is typically defined as an economy that is not yet fully developed but exhibits high growth potential. They are characterized by:
Rising GDP growth rates.
Rapid urbanization and industrialization.
Expanding financial markets.
Increasing foreign direct investment (FDI).
Growing importance in global trade.
Examples include India, Brazil, South Africa, Turkey, Mexico, Vietnam, and Indonesia, as well as frontier economies like Kenya, Bangladesh, and Ethiopia.
2. Characteristics of Emerging Markets
Demographics: Large young populations, creating both opportunities (labor force, consumption) and challenges (employment, education).
Infrastructure Needs: Roads, ports, electricity, and digital networks are often underdeveloped.
Governance Challenges: Issues of corruption, weak institutions, and political instability persist.
Vulnerability to Shocks: They depend on commodities, remittances, and global capital flows, making them exposed to volatility.
Dual Economies: Often a mix of modern urban centers with advanced industries and rural areas dependent on agriculture.
The World Bank: An Overview
1. Structure of the World Bank Group (WBG)
The World Bank is part of the World Bank Group, which includes:
IBRD (International Bank for Reconstruction and Development) – provides loans to middle-income and creditworthy low-income countries.
IDA (International Development Association) – provides concessional loans and grants to the poorest countries.
IFC (International Finance Corporation) – promotes private sector development.
MIGA (Multilateral Investment Guarantee Agency) – offers political risk insurance and credit enhancement.
ICSID (International Centre for Settlement of Investment Disputes) – provides arbitration facilities for investment disputes.
2. Objectives of the World Bank
Reducing extreme poverty.
Promoting sustainable economic development.
Facilitating investment in infrastructure, education, health, and governance.
Supporting private sector growth and job creation.
Strengthening resilience to climate change and global crises.
World Bank’s Role in Emerging Market Development
1. Financing Infrastructure
One of the World Bank’s biggest contributions is funding infrastructure projects: roads, ports, power plants, water systems, and digital networks. Infrastructure lays the foundation for industrialization, trade, and productivity growth.
In India, the World Bank has funded rural electrification and metro transport systems.
In Africa, it has supported the Africa Power Project to expand electricity access.
2. Poverty Reduction Programs
The World Bank invests heavily in programs aimed at reducing poverty and inequality. Examples include:
Conditional cash transfers in Latin America.
Rural development projects in South Asia.
Healthcare and vaccination programs in Sub-Saharan Africa.
3. Strengthening Institutions and Governance
Emerging markets often face weak institutional frameworks. The World Bank provides technical assistance to improve governance, transparency, tax collection, and public financial management.
4. Promoting Private Sector Development
Through the IFC, the World Bank fosters private enterprise, small and medium enterprises (SMEs), and access to finance. It mobilizes private investment in sectors such as energy, manufacturing, and digital technology.
5. Crisis Response and Resilience
Emerging markets are vulnerable to financial crises, pandemics, natural disasters, and climate shocks. The World Bank provides rapid financing and policy support in times of crisis. For example:
During COVID-19, the Bank committed billions for vaccines and health system strengthening.
In food crises, it has supported agricultural productivity and emergency aid.
Case Studies of World Bank in Emerging Markets
1. India
The World Bank has invested in education projects like Sarva Shiksha Abhiyan, enhancing literacy and enrollment rates.
It has supported clean energy projects, such as solar parks and wind farms.
World Bank loans have also been directed towards digital governance and financial inclusion (Aadhaar-linked systems).
2. Brazil
The World Bank has funded projects in Amazon rainforest conservation.
It has also supported urban infrastructure in cities like São Paulo and Rio de Janeiro.
Programs addressing inequality and slum rehabilitation have benefited from World Bank assistance.
3. Sub-Saharan Africa
In Kenya, the World Bank financed the Geothermal Energy Expansion project.
In Ethiopia, it has invested in agriculture modernization and irrigation.
Across Africa, the IDA is the largest source of concessional financing, focusing on health, infrastructure, and governance.
4. Vietnam
Transitioned from a centrally planned to a market economy with World Bank guidance.
Major infrastructure projects (roads, ports, and power grids) were co-financed.
Poverty rates fell dramatically from over 70% in the 1980s to under 6% today.
Successes of World Bank in Emerging Markets
Poverty Reduction – Countries like Vietnam, India, and Bangladesh have seen significant poverty reduction with World Bank support.
Infrastructure Development – Roads, ports, and energy systems financed by the Bank have fueled industrialization.
Human Capital – Investments in education and health have improved literacy, reduced infant mortality, and increased life expectancy.
Private Sector Growth – Through the IFC, the Bank has boosted SME development, job creation, and entrepreneurship.
Global Integration – World Bank programs helped countries integrate into global trade and attract FDI.
Emerging Challenges and Future Role
1. Climate Change and Sustainability
Emerging markets are among the most vulnerable to climate shocks. The World Bank is increasingly focusing on green financing, renewable energy, and climate resilience.
2. Digital Transformation
The future of development is digital. The Bank supports digital finance, e-governance, and broadband connectivity to bridge the digital divide.
3. Inequality and Inclusive Growth
Even as GDP grows, inequality remains high in emerging markets. World Bank programs are now emphasizing inclusive growth, targeting women, rural populations, and marginalized groups.
4. Geopolitical Tensions and Multipolarity
As China expands its influence through the Asian Infrastructure Investment Bank (AIIB) and Belt & Road Initiative (BRI), the World Bank faces competition in development finance. Collaborations and new models of financing will define the future.
5. Health and Pandemic Preparedness
The COVID-19 pandemic revealed the fragility of health systems. The Bank is likely to expand investments in universal health coverage, vaccine development, and pandemic resilience.
Conclusion
The relationship between the World Bank and emerging market development is a story of both achievement and controversy. On one hand, the Bank has helped lift millions out of poverty, build transformative infrastructure, and create opportunities for growth and integration into the world economy. On the other, it has been criticized for policies that sometimes exacerbated inequality, debt, or environmental harm.
As the global landscape shifts—with climate change, digital transformation, geopolitical rivalries, and health crises at the forefront—the World Bank’s role in emerging markets will evolve. Its challenge will be to balance financing with sustainability, growth with inclusivity, and global integration with local autonomy.
Ultimately, the World Bank remains a cornerstone of development finance, and for emerging markets, it will continue to be a vital partner in the pursuit of prosperity, stability, and resilience in the 21st century.
META | Buy & Sell Setup | 12 Sep 2025 – 10:48 EDTMETA | Buy & Sell Setup | 12 Sep 2025 – 10:48 EDT
Buy Zone: 766.66 – 757.95
Sell Zone: 752.01 – 743.77
Scenario : Buy
Entry: 758.00
Stop Loss: 746.20
Targets:
TP1 → 796.25
Analysis:
From Buy Zone (766.66 – 757.95) creates possibilities for a buy move.
Scenario 2 : Sell
Entry: 746.20
Stop Loss: 758.00
Targets:
TP1 → 721.91
TP2 → 691.30
Analysis:
From Sell Zone (752.01 – 743.77) creates possibilities for a sell move.
Stay alert on updates here.
⚠️ Disclaimer: This idea is shared for educational purposes only and should not be considered financial advice. Please do your own analysis before making trading decisions.

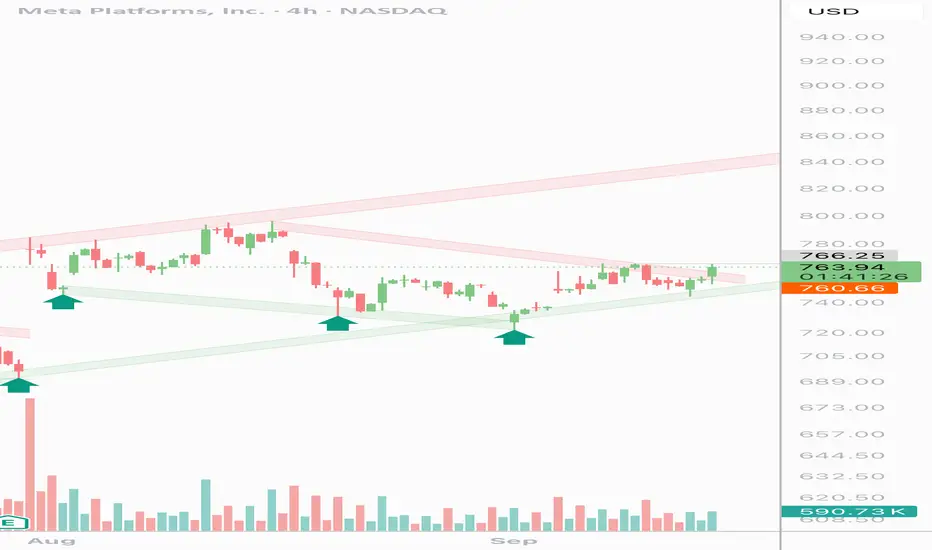
META Sep 2025 Monthly Support & Resistance LinesOverview:
These purple lines act as Support and resistance lines when the price moves into these lines from the bottom or the top direction. Based on the direction of the price movement, one can take long or short entries.
Trading Timeframes
I usually use 30min candlesticks to swing trade options by holding 2-3 days max. Anyone can also use 3hr or 4hrs to do 2 weeks max swing trades for massive up or down movements.
I post these 1st week of every month and they are valid till the end of the month.

META 45Minutes Time frameMETA 45-Minute Snapshot
Current Price: $765.70 USD
Change: +1.81% from the previous close
Market Cap: $1.86 Trillion
P/E Ratio: 25.95
EPS: $27.56
Intraday High: Not available
Intraday Low: Not available
🔎 Technical Indicators
RSI (14): Neutral
MACD: Neutral
Moving Averages:
5-period SMA: Not available
10-period SMA: Not available
20-period SMA: Not available
50-period SMA: Not available
📈 Market Sentiment
Pivot Points:
R1: Not available
R2: Not available
R3: Not available
S1: Not available
S2: Not available
S3: Not available
📅 Outlook
Bullish Scenario: A breakout above the current price could lead to further gains.
Bearish Scenario: A drop below the current price may test support levels.
Overall Bias: Neutral, with mixed signals from moving averages and momentum indicators.

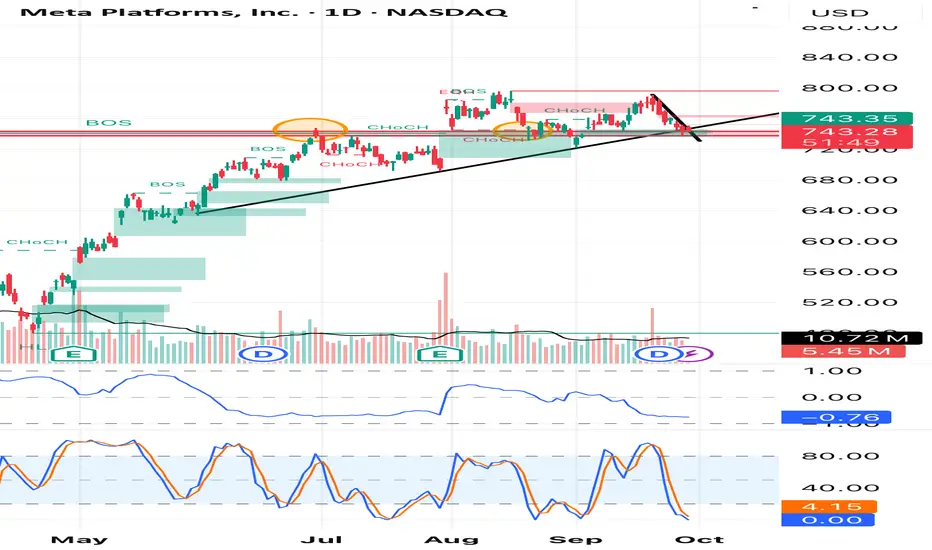
META 1D Time frame Meta Platforms (META) Daily Snapshot
Current Price: $765.70
Change: +1.78% from the previous close
Intraday Range: $753.43 – $766.30
Volume: 10,564,233 shares traded
Market Cap: $1.86 trillion
P/E Ratio: 25.95
EPS: $27.56
Beta: 1.42 → higher volatility than the market
🔎 Key Levels
Resistance:
R1: $764.73 (near-term)
R2: $771.51 (next zone)
Support:
S1: $745.67 (immediate)
S2: $738.89 (secondary)
S3: $732.75 (long-term)
📈 Technical Indicators
RSI (14): 52.41 → neutral, balanced buying and selling
MACD: 1.46 → positive, upward momentum
ADX (14): 14.16 → weak trend strength
Moving Averages:
5-day SMA: $745.11 → Buy
10-day EMA: $748.66 → Buy
50-day SMA: $739.04 → Buy
200-day SMA: $651.23 → Buy
📌 Market Sentiment
Catalysts: Positive momentum and analyst upgrades
Sector Strength: Tech sector strong, with Meta leading gains
AI Investment: Meta plans to invest heavily in AI over the coming years, expected to benefit the broader AI and data infrastructure ecosystem
📅 Outlook
Bullish Scenario: Break above $764.73 could push toward $771.51 and higher
Bearish Scenario: Drop below $745.67 may test support at $738.89
Overall Bias: Moderately bullish, with momentum positive but near-term resistance to watch

Shipping, Freight, and Logistics Trading (Baltic Index)1. Foundations of Global Shipping and Freight
1.1 The Role of Shipping in Global Trade
Shipping is the engine of globalization. Over 80% of international trade by volume is carried by sea. Ships transport crude oil, natural gas, coal, iron ore, grains, fertilizers, automobiles, and countless other goods.
Without shipping, modern trade would collapse. It provides:
Cost efficiency: Shipping is the cheapest way to transport large quantities over long distances.
Accessibility: Oceans cover 70% of the earth, linking producers and consumers across continents.
Flexibility: Different vessel types (tankers, bulk carriers, container ships, LNG carriers) handle specific cargo needs.
1.2 Freight: The Price of Shipping
In simple terms, freight is the cost of transporting cargo from one point to another. Freight rates vary depending on:
Type of cargo (dry bulk, liquid, containerized)
Distance and route (short haul vs. long haul)
Vessel size and availability
Market conditions (supply of ships vs. demand for goods)
Freight costs are crucial because they directly affect commodity prices, corporate profits, and inflation worldwide.
1.3 Logistics and Its Broader Scope
While shipping focuses on transport, logistics covers the entire chain: storage, warehousing, customs clearance, last-mile delivery, and supply chain management. Logistics companies such as Maersk, DHL, FedEx, and MSC coordinate multi-modal transport systems that integrate shipping, trucking, rail, and air.
2. The Baltic Exchange and Baltic Index
2.1 History of the Baltic Exchange
The Baltic Exchange is a London-based institution founded in the mid-18th century. Initially, it provided a marketplace for shipowners and merchants to negotiate contracts. Today, it is the world’s leading source of maritime market information, freight assessments, and shipping benchmarks.
2.2 What is the Baltic Dry Index (BDI)?
The BDI is a composite index that tracks the cost of transporting raw materials by sea, specifically dry bulk commodities such as:
Iron ore
Coal
Grains (wheat, corn, soybeans)
Bauxite, alumina, and other minerals
It is published daily by the Baltic Exchange and reflects the average of freight rates on major shipping routes worldwide.
2.3 How the BDI is Calculated
The index is derived from assessments of freight brokers who provide daily estimates of charter rates for different ship sizes. It combines data from four main dry bulk carrier classes:
Capesize (largest ships, mainly carrying iron ore & coal, 150,000+ DWT)
Panamax (medium size, often for coal & grain, 60,000–80,000 DWT)
Supramax (40,000–60,000 DWT, flexible routes & cargoes)
Handysize (smaller vessels, 10,000–40,000 DWT, short routes, regional trade)
The weighted average of these daily rates produces the BDI value.
2.4 Why is the BDI Important?
Economic Indicator: It is considered a leading indicator of global trade activity. Rising BDI suggests strong demand for raw materials and growth, while falling BDI indicates slowing trade.
Price Benchmark: Used by miners, steelmakers, traders, and shipping companies to negotiate contracts.
Financial Market Tool: Hedge funds, analysts, and investors watch the BDI to forecast commodity cycles and global GDP trends.
3. The Economics of Freight Markets
3.1 Supply Side: The Shipping Fleet
The supply of vessels is relatively inelastic in the short term. It takes 2–3 years to build new ships, so when demand spikes, freight rates can rise sharply. Conversely, during downturns, excess ships push rates lower.
3.2 Demand Side: Global Commodity Trade
Demand for shipping depends on global consumption of raw materials:
China’s steel production drives iron ore imports.
Power plants drive coal shipments.
Food security drives grain exports from the US, Brazil, and Ukraine.
3.3 Freight Rate Cycles
The shipping industry is notoriously cyclical:
Boom: High demand, limited supply → skyrocketing freight rates.
Bust: Overbuilding of ships, economic slowdown → rates collapse.
This volatility makes freight trading attractive but risky.
4. Trading and Investment Using the Baltic Index
4.1 Physical Shipping Contracts
Shipowners lease vessels to charterers (traders, miners, commodity houses) through:
Voyage Charter: Hire for a single trip.
Time Charter: Hire for a specific time period.
Bareboat Charter: Hire vessel without crew/equipment.
Freight rates are negotiated based on BDI benchmarks.
4.2 Freight Derivatives and Forward Freight Agreements (FFAs)
To manage volatility, traders use FFAs, financial contracts that lock in freight rates for future dates.
Example: A steelmaker importing iron ore may buy FFAs to hedge against rising shipping costs.
Speculators also trade FFAs purely for profit, betting on future freight movements.
4.3 ETFs and Shipping Stocks
Investors gain exposure to freight and shipping through:
Shipping company stocks (Maersk, Cosco, Hapag-Lloyd, Frontline)
Exchange-traded funds (ETFs) that track shipping indices
Commodities like iron ore, coal, and grains, which correlate with freight rates
4.4 Role of Banks and Hedge Funds
Financial institutions use the BDI for forecasting, asset allocation, and even as a proxy for inflation and GDP. Hedge funds trade freight derivatives to profit from global trade cycles.
5. Logistics and Supply Chain Dynamics
5.1 Container Shipping vs. Bulk Shipping
Container Shipping: Handles manufactured goods (electronics, clothing, cars). Measured in TEUs (Twenty-foot Equivalent Units). Freight benchmark = Shanghai Containerized Freight Index (SCFI).
Bulk Shipping: Handles raw commodities (ore, coal, grain). Benchmark = BDI.
5.2 Supply Chain Bottlenecks
Events like the COVID-19 pandemic and Suez Canal blockage (2021) highlighted vulnerabilities:
Congested ports delayed shipments.
Container shortages raised freight prices.
Geopolitical tensions (Russia-Ukraine war) disrupted grain and oil transport.
5.3 Role of Technology
Digital platforms, blockchain, and AI are transforming logistics:
Real-time cargo tracking
Smart contracts for freight payments
Automated port operations
6. Case Studies
6.1 The 2008 Shipping Boom and Bust
Pre-2008: China’s rapid industrial growth caused freight rates to skyrocket (BDI hit 11,793 points in May 2008).
Post-2008: Global financial crisis slashed demand; oversupply of ships led to a crash (BDI dropped below 700 points in late 2008).
6.2 COVID-19 Pandemic
Early 2020: Demand collapsed, ships idled, freight rates fell.
Mid-2020 onward: Recovery + container shortages led to record high container freight prices.
6.3 Russia-Ukraine War (2022)
Disrupted Black Sea grain exports.
Increased insurance costs for vessels in conflict zones.
Re-routed trade flows reshaped freight markets.
Conclusion
Shipping, freight, and logistics are the hidden arteries of global trade. The Baltic Dry Index (BDI) stands as a critical barometer of world economic health, linking shipping costs to broader market cycles. Traders, investors, and policymakers watch it closely to gauge demand for raw materials, predict inflation, and assess the global growth outlook.
While the industry faces volatility, geopolitical risks, and environmental pressures, it is also entering a period of transformation driven by decarbonization, digitalization, and new trade patterns.
For anyone interested in global markets—whether a trader, economist, or policy planner—the Baltic Index remains one of the most powerful yet underappreciated indicators of where the world economy is heading.