HRL: getting long spam!Weekly chart is compelling on the lower indicators, with Williams% and RSI ticking higher off oversold levels. MACD starting to curl and accumulation picking up. Also testing its downtrend from Aug. Really like this as a low beta play in what has been a fairly noisy month. This will not be a quick swing. Invalidates for me on a weekly close below 21.03 and looking for 25-30% upside. This will be a set and forget position but will keep an eye on earnings in a cpl weeks...
Trade ideas

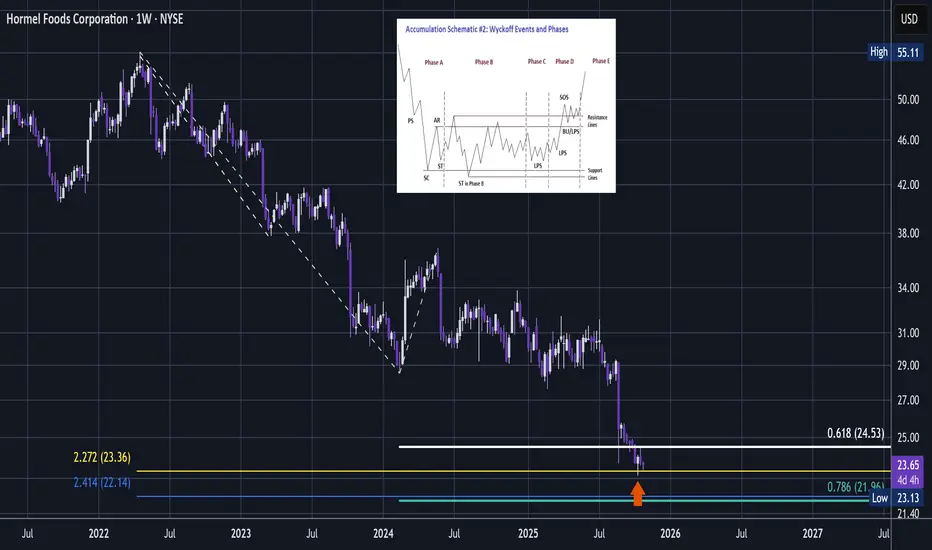
HRL - Deep Defensive Technical BuyHormel Foods is next for my deep buy system.
This one is a great defensive buy.
For TradingView, be aware that I am not specifically focused on defensive stocks. Rather it is certain defensive stocks that are arriving to deep technical opportunity.
In the pandemic crash it hardly blinked!
It has best dividend yield for this sector -4.85%
So if you're looking for a stock to buy in prime HTF technical position that can be resilient in a market crash then this might be a great choice.
Its not the highest volatility but it it has a very strong historical record.
Its hitting the distributive 2.272 GW and also a weak 1:0.618 GW - the weakness signals potential upside momentum if it bottoms here.
Nice LTF slightly lower low can be the Wyckoff SC > ST (arrow).
The only detail lacking is a strong support - so this setup is not 100% ideal, but its not too far off.
So, this is effectively a prime buy, but since there is no support - it must hold and will require some close monitoring until it moves up.
I bought a chunk here.
AI write up:
"Hormel Foods Corporation (NYSE: HRL) is best classified as a defensive stock, anchored in the consumer staples sector. Its portfolio includes enduring brands like SPAM, Jennie-O, and Skippy, which cater to consistent consumer demand regardless of economic cycles. This defensive positioning is reinforced by Hormel’s stable dividend history and relatively low beta, making it a common pick for income-focused and risk-averse investors.
📊 Core Financial Highlights – Q3 Fiscal 2025:
- Net Sales: $3.03 billion, with organic growth up 6% year-over-year, driven by strong retail volume increases, especially in turkey and shelf-stable meats like SPAM.
- Operating Income: $240 million, with adjusted operating income at $254 million. Operating margin stood at 7.9%, slightly below historical norms, reflecting cost pressures.
- EPS: Diluted earnings per share came in at $0.33, or $0.35 adjusted. The company projects Q4 EPS between $0.38–$0.40.
- Valuation: Trailing P/E ratio is 17.3, forward P/E is 16.01, and PEG ratio is elevated at 5.17, suggesting slower growth relative to valuation.
- Balance Sheet: Hormel maintains a solid financial foundation with a market cap of ~$13 billion and enterprise value of ~$15.3 billion. Institutional ownership is moderate at 43.45%, and insider ownership remains low.
⚠️ Lowlights and Risk Factors:
- Profitability Pressure: Rising commodity costs have compressed margins, despite volume growth. Hormel’s Transform and Modernize initiative (90+ projects) aims to offset inflationary headwinds, but execution risk remains.
- Growth Constraints: While organic sales are rising, the PEG ratio signals limited earnings acceleration, potentially capping upside for growth-oriented investors.
🛡 Bankruptcy Risk: Hormel’s risk of bankruptcy is extremely low. The company has no history of financial distress, maintains strong cash flows, and operates in a recession-resilient sector. Its conservative capital structure and consistent dividend payments further reinforce its financial stability.
"Hormel Foods (HRL) currently pays an annual dividend of $1.16 per share, distributed quarterly at $0.29 per share. The next payment is scheduled for November 17, 2025, to shareholders of record as of October 14.
📈 Dividend Yield & Payout:
- Dividend Yield: 4.81%–4.89%, significantly above the consumer defensive sector average of ~2.85%
- Payout Ratio: ~84.7%, indicating a high portion of earnings is returned to shareholders
- Dividend Growth: Hormel has increased its dividend for 59 consecutive years, maintaining its Dividend King status
This high yield and long growth streak make HRL attractive for income-focused investors, though the elevated payout ratio suggests limited room for aggressive increases without earnings growth."
This analysis is shared for educational purposes only and does not constitute financial advice. Please conduct your own research before making any trading decisions.
HRL Descending Triangle?Observing price action, it appears we might be forming a descending triangle here. If this pattern confirms, I'm looking at a strong likelihood of a move down to fill the gap below current price levels. Keep an eye on support for a potential breakdown!
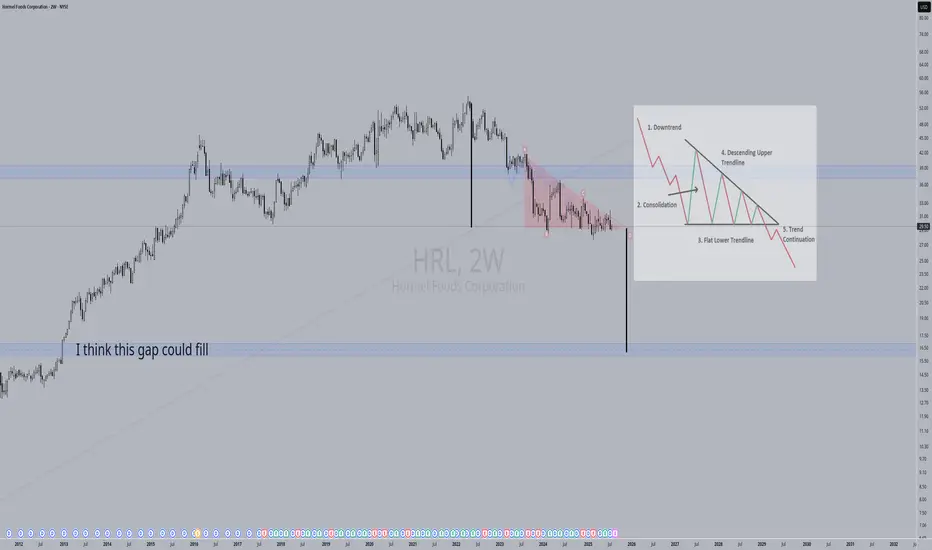
Bottoming outNYSE:HRL has formed a large descending triangle and a potential double bottom formation. Given the upside momentum, there is a strong chance of HRL trending higher after breaking above the descending triangle.
Long-term MACD is looking at a strong long-term bullish momentum after the MACD/signal line is rising and histogram is positive.
Stochastic has been rising and is in a steady state, indicating strong bullish momentum in the mid-term.
23-period ROC is rising and staying above the zero line. Directional movement index is strong bullish.
Prices just closed above the kumo of the ichimoku, making the signal a strong bullish signal.

Hormel Foods Co | HRL | Long at $28.98Food stocks are gaining momentum. I anticipate another round of inflation could boost them in the coming 1-2 years. Hormel NYSE:HRL is trading at a price-to-earnings of 20x and pays a dividend of 4.05%. Insiders have been awarded options and are buying shares below $30. Earnings are forecast to grow 9.16% per year and the company has a very low debt-to-equity ratio (0.36x). Thus, at $28.98, NYSE:HRL is in a personal buy zone.
Targets:
$34.00
$36.00
... $50.00 (very long-term, inflationary environment, etc)

$HRLfor a 20%+ profitRSI is in the buy zone. P/E and P/B are in a beautiful buy range too. Sell once it hits the red line.

HRL approaching Monthly 200MASince an ATH of $55.11 in April of 2022, HRL has declined -47%.
HRL has never been priced below its monthly 200MA.
If HRL produces positive ERs on Thursday 2/29, it could be set up for a solid technical bounce from its monthly 200MA.
Monthly oversold RSI... If monthly 200 support ultimately fails, I'll be watching the yearly S1 pivot area as next possible support.

#HRL#Hormel Foods Corporation (NYSE: HRL), a distinguished brand in the food processing sector, has been under the lens of investors and traders alike due to its recent price actions. A meticulous examination of the technical charts reveals a narrative of a stock at a critical juncture, hinting at a potential momentum shift in the near term.
Fundamental Analysis:
In Q3 2023, HRL reported a quarterly earnings of $0.40 per share, falling short of the consensus estimate of $0.41 per share. The stock faces challenges stemming from a volatile, complex, and high-cost operating environment, with specific weakness noted in the International segment. Despite Hormel Foods' steady market presence and dividend payout, the stock's performance is hampered by operational challenges and missed earnings estimates. The analysts' hold rating indicates a neutral outlook with potential upside if the company can address its highlighted challenges and achieve its strategic targets.
Technical Analysis:
Currently, HRL is stationed at a key support level on the weekly chart, with critical support price lingering around $30. The structure unveils a complete reverse impulse wave, indicating that the stock is at the tail end of the 5th wave. Should the stock find support at S1, a price retracement could be imminent, marking the initiation of a new wave cycle. The RSI indicator delineates that the price has entered a pronounced oversold phase, traditionally a precursor to a trend reversal. However, the extremities in the RSI readings necessitate a cautious approach, as a premature entry could lead to a drawdown if the price continues to plummet. The MACD, a trend-following momentum indicator, has yet to showcase a significant reversal pattern, suggesting that the bearish momentum is still intact. A prudent approach would be to await stabilization at S1, followed by a corrective wave B, before considering an entry. This strategy aims to mitigate the risk associated with catching a falling knife while capitalizing on the potential upside once the trend reversal is confirmed.
Entry Strategy:
A conservative tactic would be to await stabilization at S1, trailed by a corrective wave B, before contemplating an entry. This strategy is devised to lessen the risk associated with catching a falling knife while capitalizing on the potential upside once the trend reversal is substantiated.
This analysis seeks to provide a holistic insight into HRL's potential future price movement, grounded in both technical and fundamental analysis. The confluence of support levels, wave structure, and momentum indicators coupled with the company’s fundamental outlook paints a picture of cautious optimism, albeit with a recommendation of a well-thought-out entry strategy to navigate the inherent market risks.

$HRL Bear Flag Weekly ChartNYSE:HRL Bear Flag Weekly Chart The technical analysis of a bear flag pattern on the weekly chart of Hormel Foods Corporation (ticker symbol: NYSE:HRL ) reveals a potentially bearish trend continuation signal. A bear flag is a price pattern characterized by a sharp downward move (the flagpole) followed by a period of consolidation marked by parallel trendlines forming a flag shape. In this case, on the NYSE:HRL weekly chart, we observe a sharp decline in the stock price followed by a period of consolidation. This pattern suggests that sellers are still exerting pressure on the stock, and the subsequent breakout below the lower trendline of the flag may indicate a further downside move in the future. Traders and investors should closely monitor this pattern, as it could signal a potential opportunity for bearish positions or a cautious approach to the stock until more confirmatory signals emerge.

Hormel Foods LongHRL long position. It looks like it's ready to move and I got the signal for long position.
Market touched a lower Lin Reg and below MACD on H4.
Confirmation on H1 to take long position with 2 TP.
Tp1 at $40.40 and 2nd at $42.
SL at $38.63.
Warning!!!!
This content should not be interpreted as financial advice

HORMEL FOODS Stock Chart Fibonacci Analysis 070423 Trading Idea
1) Find a FIBO slingshot
2) Check FIBO 61.80% level
3) Entry Point > 40.4/61.80%
Chart time frame : B
A) 15 min(1W-3M)
B) 1 hr(3M-6M)
C) 4 hr(6M-1year)
D) 1 day(1-3years)
Stock progress : A
A) Keep rising over 61.80% resistance
B) 61.80% resistance
C) Hit the bottom
D) Hit the top
Stocks rise as they rise from support and fall from resistance. Our goal is to find a low support point and enter. It can be referred to as buying at the pullback point. The pullback point can be found with a Fibonacci extension of 61.80%. This is a step to find entry level. 1) Find a triangle (Fibonacci Speed Fan Line) that connects the high (resistance) and low (support) points of the stock in progress, where it is continuously expressed as a Slingshot, 2) and create a Fibonacci extension level for the first rising wave from the start point of slingshot pattern.
When the current price goes over 61.80% level , that can be a good entry point, especially if the SMA 100 and 200 curves are gathered together at 61.80%, it is a very good entry point.
As a great help, tradingview provide these Fibonacci speed fan lines and extension levels with ease. So if you use the Fibonacci fan line, the extension level, and the SMA 100/200 curve well, you can find an entry point for the stock market. At least you have to enter at this low point to avoid trading failure, and if you are skilled at entering this low point, with fibonacci6180 technique, your reading skill to chart will be greatly improved.
If you want to do day trading, please set the time frame to 5 minutes or 15 minutes, and you will see many of the low point of rising stocks.
If want to prefer long term range trading, you can set the time frame to 1 hr or 1 day.

📉 SELL HRL TREND CONTINUATION 🥫#HRL has created a Daily bearish flat with trend continuation setups on the lower degree at the presumed end of the C wave.
These are great entries for jumping in on the start of a large wave.

Hormel Foods: Bullish Deep Crab with Bullish DivergenceHormel Foods is trading within a Falling Wedge as it Bullishly Diverges at the PCZ and the Earningss Date approaches.
There is also a Bullish Piercing Line on the Daily right now.

HRL: LT Short OppHRL appears to be completing a three drives pattern on the monthly. It's hasn't seen its monthly 200 SMA in forever, literally. Insiders are happy to sell to you. It's consolidating tightly between the 20 and 50 EMAs. A break below 44 would be the signal. First target 39 then 36 and 30. After the break of 44, stop would be a weekly close above 46.


HORMEL FOODS PRICE FORECASTIn this forecast im sharing my short perspective of HRL while
i see all the prior packaged foods consumer defensive going long
I see resistance from the trendline as well as the level where it lies
as for the rest strategy secret
SENNA SEASON

$HRL with a Bearish outlook following its earnings #Stocks The PEAD projected a Bearish outlook for $HRL after a Negative Under reaction following its earnings release placing the stock in drift D with an expected accuracy of 80%.


$HRL with a Bearish outlook following its earnings #Stocks The PEAD projected a Bearish outlook for $HRL after a Negative Under reaction following its earnings release placing the stock in drift D with an expected accuracy of 77.78%.
$HRL with a Bearish outlook following its earnings #Stocks The PEAD projected a Bearish outlook for $HRL after a Negative Under reaction following its earnings release placing the stock in drift D with an expected accuracy of 75%.
Short scalp HRLShort scalp $HRL .Based on its downtrend, regress off resistance and a familiar chart pattern confirmed by my technical indicators, I expect at least half a percent in profits IF breaches today's low of $47.06 during tomorrow's session.

$HRL with a Bullish outlook following its earnings #Stocks The PEAD projected a Bullish outlook for $HRL after a Positive Under reaction following its earnings release placing the stock in drift A with an expected accuracy of 60%.
