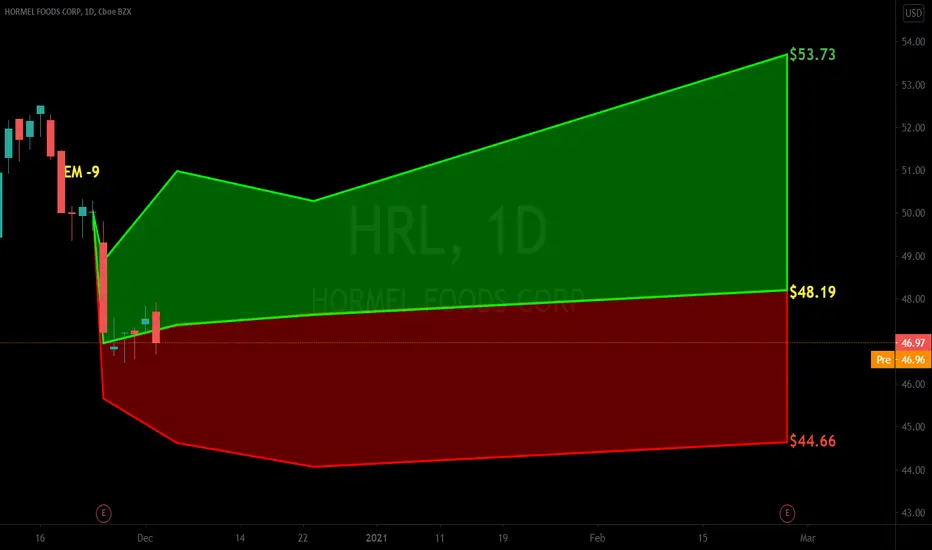
There's No 'Spam' In This ChartHormel Foods is on a tear. After being trapped under 43.54 for a few sessions it ripped higher blowing right through the most significant of the Aspen S/R Levels (Purple) and went right Red @ 48.84.
Use any consolidation or pull-backs to go long with an upside target at 51.07
FYI: all the lines on this chart have been here all year - no drawing in lines after the fact. Note how 45.93 had been pivotal all year.
---------------------
In Trading, Objectivity Trumps Subjectivity
“Every trader is a steaming hot bowl of bias stew and must maintain self-awareness and lucidity behind the screens as the trading day oscillates between boredom and terror.”
The above quote is from a good friend of mine and veteran FX trader Brent Donnelly. It completely nails the biggest challenge for new and even experienced traders: being as objective as possible when making trading decisions.
Yes, as you become more experienced, subjectivity, market feel and experience are part of one’s decision-making matrix, but early on you do not have that luxury.
If you start each day knowing that price action in the market is random it will remind you to think objectively. There are, however, repeatable patterns that occur again and again…..it’s your job to identify them.
That’s where Support & Resistance levels come in.
Definitions: “Support” and “Resistance” Levels
Many technical indicators and tools can be subjective and challenging to learn. This is not the case with support and resistance levels.
Support and resistance are terms for two price levels on a chart that appear to limit the security’s range of movement.
The “support level” is where the price regularly stops falling and bounces up.
The “resistance level” is where the price normally stops rising and dips back down.
The more frequently a price hits either level, the more reliable that level is likely to be in predicting future price movements.
Understanding Support and Resistance Levels
Remember, the more informed and objective we can be with numbers, the more confident we can be with our trades. That’s important because, although price action is random (a fact that has been proven time and time again), there are repeatable patterns we can use to get an edge.
Two of those objective data points we can use to gain an edge are support and resistance levels. These are two of the best tools we have when it comes to swing trading. Why? Because they give us strong data points that suggest where an instrument is likely (and unlikely) to go.
But this is really key: Arbitrarily cataloging each price level that appears to be relevant as a support or resistance level isn’t going to get you far. That’s why Aspen Trading takes a unique approach to support and resistance levels.
With Aspen’s Support & Resistance Levels, we measure where trades (prices) occur in terms of frequency. This gives us a sense of where market participants are wagering prices may go.
That’s about as raw and unfiltered as you can get in terms of displaying what has taken place. There’s no room for interpretation - this is raw data that can be used to get a sense of where prices may be heading.
Learning The “Four Sets” of Support and Resistance Levels
There are four sets of support and resistance levels that are part of Aspen Trading’s S/R framework.
Each set of support and resistance levels is unique to a specified period of time. We display each of them in different colors on our charts when we analyze trades to make it easy for us to understand the data as we get comfortable reading charts.
You’ll see each of these levels on display in the charts that follow below. The four sets of support and resistance levels are classified as follows:
There are four sets of support and resistance levels that are displayed by Aspen Trading’s S/R Analysis Tool. Each one is unique to a specified period of time that we then display directly on the chart. The levels are classified as follows
- Intra-day & short-term traders love the GREEN levels
- Swing traders gravitate towards the ORANGE levels
- Medium-term traders like to see RED
- And those longer-term folks dig PURPLE
IMPORTANT:
These lines will change/adjust until the end of the specified observation period is complete.
Once the observation period is complete, that range will then be displayed on the chart as a set of dotted lines that is shaded in to serve as a reference point for traders to know the key levels from the prior lookback period. This can often be very helpful.
What’s the distinction between the 4 color levels?
Essentially think of these levels on a rising scale of importance. While GREEN levels are certainly key, they do not hold the same level of significance as the PURPLE levels.
Twitter
Trade ideas

HRL Long Tis The SeasonHRL goes up every December! Hormel Foods Corp. engages in the production of meat and food products. It operates through the following segments: Grocery Products, Refrigerated Foods, Jennie-O Turkey Store, and International and Other.
The Chart speaks volumes!

HRL Cautious LongOversold on RSI dailies, retesting March 2020 lows (and really December 2018 correction). PT $41.50 / $42.30 / $43.50. SL $40.20. Entry $40.85.
Plenty of room for a wider stop, and if you're a time traveler (or already in a position) a better entry.
Hoping HRL turns around since I'm holding shares, but no real guestimate on timespan to do so. Fundamentals look okay, with solid EPS $1.687, regular dividend payments, and an OK P/E of 26.
Disclaimer: Not financial advice, and I'm not a chart guru either. Good luck with your plays.

Hormel up then downHormel is in a remarkably consistent long-term channel up, and broke through to the underside for the first time. If it's gonna fall, it'll fall, but I would be surprised if, before doing so, it didn't retest the bottom of the channel by EOY. I'll be watching for slowing downward momentum. Also, if there's a market crash, everyone'll go to walmart and stock up on canned chili.

Hormel...A Meat to stop loafing ??This may be a profitable long shot.
Hormel Foods (HRL) is at an interesting juncture.
Basically HRL has retraced 50% of the 4 year run-up from October 2017.
A Harmonic pattern would suggest a possible pause and reversal here.
Additionally CD is a 1.41 extension of the AB leg which is marked.
2 caveats:
1) This is a weekly chart and could take a while to to materialize and
2) Support is needed from general market which are currently in flux and need stable political and economic stability.
A would suggest that a high volume weekly close over $42,26 may be enough to reverse HRL's direction.
Please don't chase and keep an eye which direction the wind is blowing from.
As always not investment advice and do your own homework.
A sustained break of current levels probably targets the $38.50 region.
Targets etc. are marked.
S.

HRL touching weekly 200 period moving average.HRL fell below is 200 daily moving average which shows its in a downtrend. If we zoom out a little further to the weekly chart, we can see where its tested this support several times.
Its fallen outside of the lower Bollinger Band on both the daily and weekly chart. I am a mean reversion trader and I think we may find support here.
I am long leaps with leaps here.


Hormel Foods Corp. $HRL - investment idea 💡 This idea is based on my technical analysis only.
Do your research and trade on your own risk!

Hormel Foods Corp. $HRL - investment idea 💡 This idea is based on my technical analysis only.
Do your research and trade on your own risk!

(MID TERM) Hormel FoodsNOT FIANANCIAL ADVICE! Bounce off major support with CBD on the 4hr and Daily. Wanted conformation on the bounce and got it on a bad day in the market. Given conditions of the market manage your risk/tolerance.

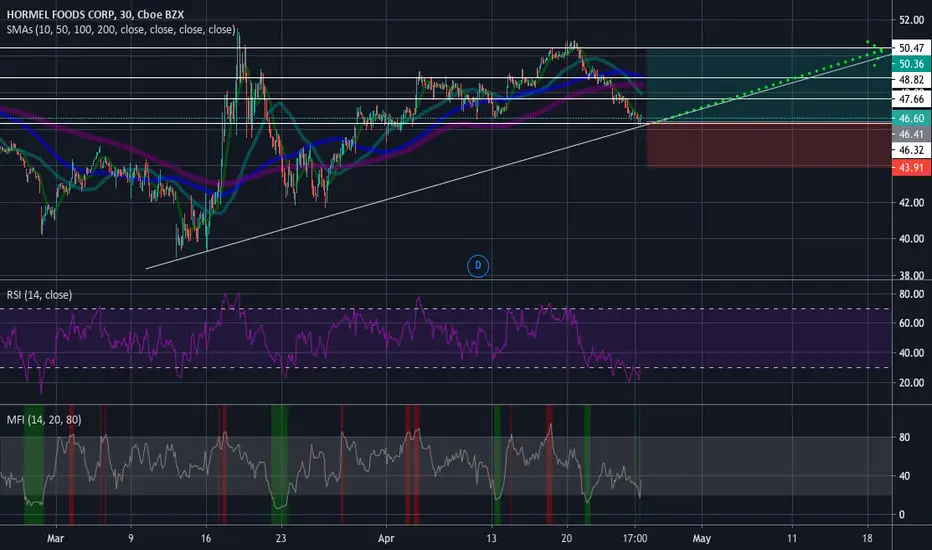
$HRL with a bearish projection after earning release$HRL posted its earnings with a negative under reaction following its release. The PEAD projected a bearish outlook for the stock placing it in Drift D
If you would like to see the Drift for another stock please message us. Also click on the Like Button if this was useful and follow us or join us.
HRLBased on my analysis:
1. HRL breakout from trendline with high volume.
2. MACD line entered below 0 level.
3. Thus, HRL will go down to 45.90-45.80 USD.
Syeikh Hafiz
Stock Market Analyst

Crazy (5150) about HRL$49 has been an important price level since mid-Feb when it provided resistance for an all time high.
The same $49 level provided strong resistance for the rising wedge , except for a couple of fakeouts marking $51.50 as the new all time high.
Both levels have remained important. $49 was retested shortly after the breakout of the rising wedge . $51.50 provided "long but weak" resistance, with a failed breakout in mid-Aug.
Now we're hanging around $49 again - are we going to keep falling or turn back around? I'm bullish for the following reasons:
- $49 was such a strong resistance that I believe it is just shaking traders out on its way to becoming a stronger support level .
- $49 held support with strong bullish hammers on Jul 22 and Sep 17.
- Even though Sep 18 broke below $49, the next trading day had a strong doji tug of war between buyers and sellers, followed by a green day. IMO this signals a fakeout and not an actual break of support.
- TTM and MACD are juuuuust starting to turn around. Not strong enough to be bullish signals on their own, but in context I would say these are encouraging.
I have the following price targets:
- $51.50 (previous resistance)
- $53.00 (approx previous ATH )
- $57.00 ( rising wedge breakout target, assuming we're still in a "retest" phase and not a "breakdown" phase...)
If we close any day this week below the doji body of $48.50 or so, then I will consider this pattern broken and would then expect more downside. If that happens I will look for another bullish reversal in the $45-$47 range.

Hormel Foods: additional argument for keeping in your portfolioShow Me the Money! 16 June, 2020, by Vladimir Rojankovski, Grand Capital Chief Analyst
Hormel Foods (HRL) performed well in the index correction episode of the end of last week, losing only 2.4% (two point four per cent) in its lowest point against the 6%+ (six percent plus) index correction. That said, HRL remains a defensive stock with a Beta coefficient of -0.02 (minus zero point zero two).
As meat processing plants across the U.S. continue to be the epicenters of local coronavirus outbreaks, Hormel Foods said on June 10 that the its preventive measures are very successful at its facilities. The initiative, called "Keep COVID Out," is said to have limited the number of infected people at the company's plant in Austin, Minnesota to 50, with a workforce of about 1,800 (eighteen hundred), which is about 2.7% (two point seven per cent).
This figure represents a huge difference from the reality of other US meat processing companies. In a recent example, the coronavirus infected 22%, or 555 (five hundred fifty five) people, of Tyson Foods (TSN) workers in Storm Lake, Iowa. This is positive news for HRL and provides additional arguments for keeping its stock in your portfolio.

Good growth and dividensBased on their median growth I am happy with their performance and trust they will grow slowly but strongly just like their dividends

The big potential for HORMEL FOODS CORPHello traders, for a few days the buyers have responded, it may be that the market returns ...
Please LIKE & FOLLOW, thank you !

Update: HORMEL IS THE SAFEST BET OUT THERE! With all the BS going on. The one thing I can be certain about is that this goes up. The only thing people are buying is food and I know how much Americans need their packaged meat. They shut down a couple factories due to covid, but they are on track to have a strong year and I would want to hold this stock thru earnings.

Momentum, Retracement, Support and Indicator Divergence for HRLHRL is a strong stock, and has made three pushes to the downside. It is at the third push to the downside, at a point of critical support. I have drawn a line from prior support from price action and volume profile where I believe buyers will step in. There is divergence between price action and the CCI (10) indicator and weak divergence between price action and the RSI (10) indicator, both on the hourly. I have set my stop loss at the low below the volume profile , and have set my take profit at the volume nearest 1 measured move from my entry.

Hormel Foods Corp [ NYSE: HRL ]Hormel Foods Corp
Pending Order Placement
Entry Placement 50.83
Take Profit Placement 57.77
Stop Loss Placement 46.20

HORMEL WILL SEE NEW HIGHSThis is set up beautifully. I didn't make any bets on the market but this seems like a safe bet. If it goes any lower I will exit.
Hormel Foods Corp Forms Cup w Handle - $HRLHRL is forming cup w handle. Detailed explanation in on the chart. If you like, please "like" :)

Hormel Foods Corp [ NYSE: HRL ]Hormel Foods Corp
Pending Order Placement
Entry Placement 49.00
Take Profit Placement 52.64
Stop Loss Placement 46.57

Hormel Foods versus Campbell's Hormel Foods is an industrial scale grocery supplier. Similar footprint to that of Campbell's $CPB but with a lower OpEx and higher revenues.
Notably, the company trades at nearly 3x P/S versus Campbell's which trades at 2x P/S.
Both seem like logical, undervalued, consumer staples, though I would see a convergence in this price differential as we come closer to earnings.
