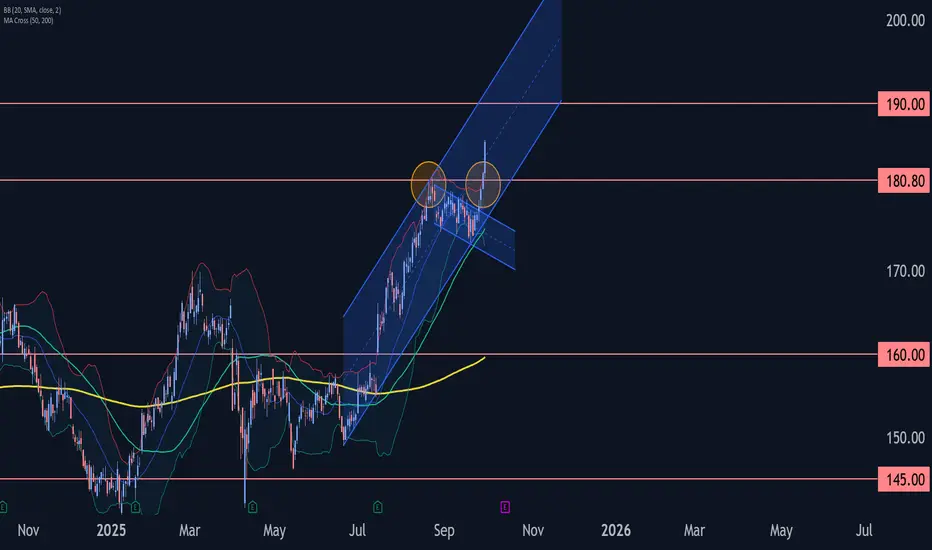
Johnson & Johnson Bulls Break the FlagJohnson & Johnson has been in a strong uptrend, with buyers consistently driving price higher. After the impulsive rally, price consolidated into a downward-sloping flag, where sellers tried to take control but failed to push lower. Buyers then stepped back in, breaking out of the flag with strength.
That’s our long entry signal, confirming buyers are firmly in control and positioning for continuation toward the next target around 190.
The fundamentals for J&J are mostly supportive: strong earnings, raised guidance, strategic acquisition add weight to bullish bias and the technical outlook. But stay alert to catalysts that could turn sentiment fast.
JNJ trade ideas

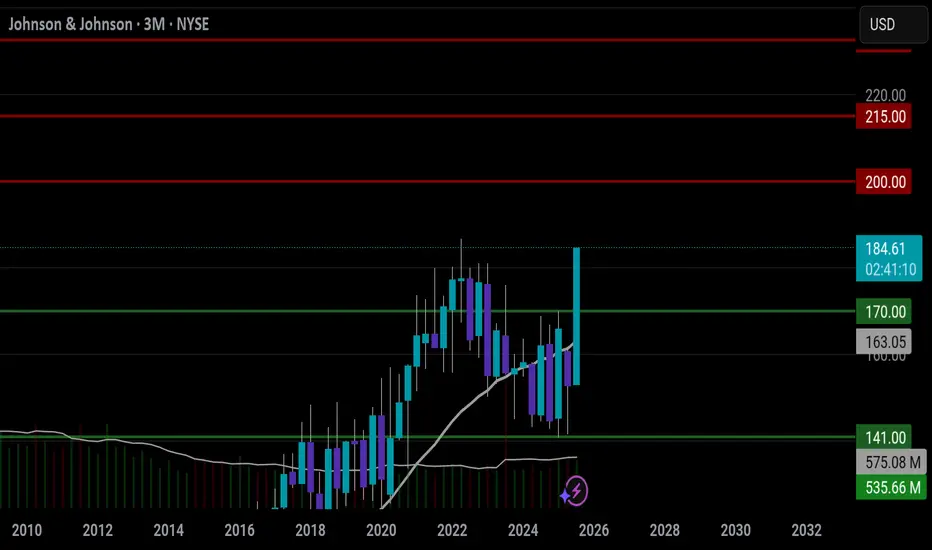
JNJ APPROVEDNYSE:JNJ has recently shown a bullish chart pattern on the 3-month timeframe, which in my view suggests the stock may be aiming for new all-time highs. That makes it, in my opinion, a good stock to hold in a portfolio over the next 2 to 3 months.
This is not financial advice.
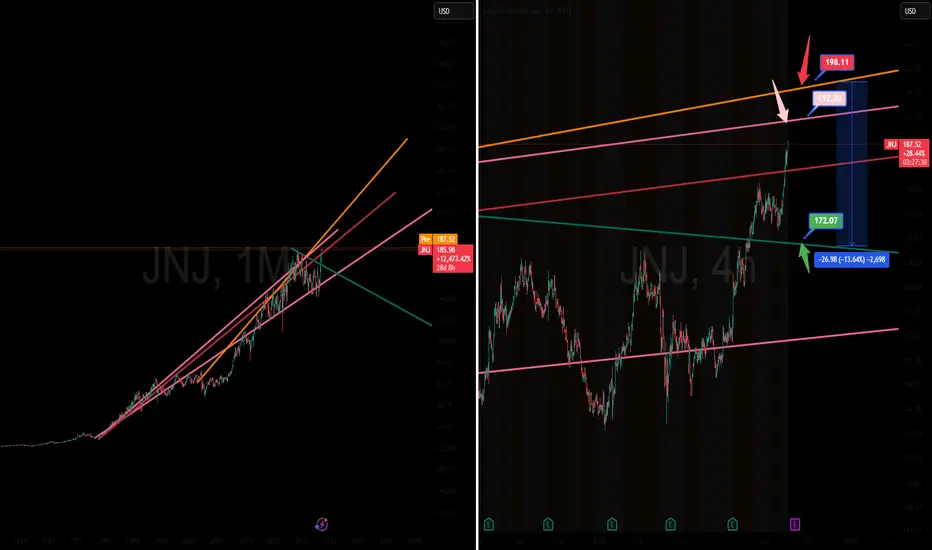
Band-Aids to Blowouts: Shorting J&J's This short trade is based on the idea that JNJ's stock price has extended beyond a long-term upward channel, suggesting a high-probability mean reversion or correction back toward the established trendline. The chart suggests a bearish divergence or a temporary blow-off top scenario. The price has accelerated sharply, poking above the main channel (orange line). The strategy capitalizes on the expectation that this extended move will fail, leading to a strong retracement to "reset" the stock back into its longer-term average trend.
Macro Thesis: The bearish case argues that JNJ's stock price, which has historically commanded a premium for its stability, is vulnerable to a correction as the market fully prices in the combined near-term negative catalysts: the immediate drag from Stelara's LOE, the ongoing financial uncertainty of the talc lawsuits, and the general sector pressure from US drug pricing reform. This confluence of factors makes the stock less of a "safe haven" and more susceptible to the technical correction suggested by your chart.
Trade Idea:
Initial Short Entry $192.20 (Light Red Arrow) This price sits right at the upper boundary of the short-term rising channel (pink line) and may represent the first sign of exhausted momentum following a sharp run-up. Initiating a light position here hedges against a potential immediate drop.
Add to Short $198.11 (Dark Red Arrow) This price is at or near the upper boundary of the long-term channel (orange line). This level is the key resistance for the entire price structure. If the price reaches here and fails to break out convincingly, it's a strong signal of a major rejection and provides a high-confidence level to increase the short position size.
Target Exit (Take Profit) $172.07 (Green Arrow) This target is set near the midpoint of the current rising channel (dark red line). This level represents a high-probability support zone and the natural point for the stock to revert to after correcting from an overbought or extended state. This offers a potential return of 10.5% to 13.4% from the two entry points.
Disclaimer: This analysis is based solely on the technical indicators and levels presented in the provided image and is not financial advice. The stock market is inherently unpredictable, and you should always conduct your own research before making investment decisions.
Johnson & Johnson Wave Analysis – 30 September 2025
- Johnson & Johnson broke key resistance level 180.00
- Likely to rise to resistance level 190.00
Johnson & Johnson recently broke sharply above the key resistance level 180.00 (which stopped the previous minor impulse wave 3 at the end of August).
The breakout of the resistance level 180.00 accelerated the active impulse wave 5 of the intermediate impulse wave (3) from April.
Given the predominant daily uptrend, Johnson & Johnson can be expected to rise to the next resistance level 190.00, target price for the completion of the active impulse wave 5.
Johnson & Johnson. Clean. Soft. Gentle. Growth.Johnson & Johnson (JNJ) stands out as a bellwether in the global healthcare sector, and its nearly 18% stock performance in 2025 reflects both robust fundamentals and compelling technical trends.
Fundamental Perspective
JNJ maintains a solid financial foundation, underpinned by consistently strong profitability, a diversified business model, and effective capital allocation. As of August 2025, JNJ reported trailing twelve-month (TTM) revenue of $90.6 billion and earnings of $22.7 billion, resulting in a net profit margin of 25% and a gross margin close to 68%. Key profitability metrics such as a Return on Assets (ROA) of 11.7%, Return on Equity (ROE) of 28.9%, and Return on Invested Capital (ROIC) of 13.6% underscore the company's operational efficiency relative to peers in the pharmaceutical industry.
From a financial health perspective, JNJ maintains moderate leverage, with a debt/equity ratio of 0.61 and an Altman-Z score of 4.17, signifying financial stability and a low risk of distress. The forward price/earnings (P/E) ratio is 14.9, suggesting that the stock is not particularly expensive for its sector, while the dividend yield remains attractive at 3.16%, appealing to income-oriented investors. The company’s free cash flow yield and high profit quality further enhance its fundamental appeal.
JNJ's growth narrative is fueled primarily by its Innovative Medicine and MedTech segments. Drugs like Darzalex and Tremfya continue to deliver high single- to double-digit year-over-year growth, and the MedTech segment is experiencing margin expansion due to scale and product mix improvements. Strategic acquisitions (notably Intra-Cellular Therapies), new regulatory approvals, and a deep late-stage pipeline (over 40 programs) provide resilience and new growth avenues, offsetting pressures from biosimilar competition, patent expirations, and legal settlements.
Technical Perspective
On the technical side, JNJ’s stock has demonstrated significant momentum. The price reached an all-time 52-week high above $170 per share in early August 2025, following Q2 earnings that exceeded expectations and prompted a nearly 6% surge in share price. Technical indicators are largely positive, with the stock trading above its 50-day and 200-day simple moving averages ($157.43 and $155.56, respectively), reflecting a prevailing bullish trend. The 14-day Relative Strength Index (RSI) stands at 55.85—neither overbought nor oversold—implying stable investor sentiment. Analyst price targets average $173, reflecting modest but continued upside.
A key technical resistance zone had developed around $167, which NYSE:JNJ has recently breached. The consensus among technical analysts is the potential for a substantial upward move towards $194 if the breakout holds, while support remains strong at around $140—historically a level where dip buyers emerge. Market sentiment remains bullish, with the Fear & Greed Index indicating broader market caution, while JNJ’s own technical indicators show "Strong Buy".
In long-term, JNJ has been supported earlier in 2025 by 10-year SMA, above which stocks are moving since 1980s, i.e. for the past 45 years (on end of year basis). In mid-term, the main technical graph indicates on major 5-year old bearish trend reversal.
Reasons for Recent Growth
JNJ’s recent growth is attributed to several convergent factors:
Strong Q2 2025 earnings performance, leading management to raise full-year revenue and EPS guidance above analysts’ expectations.
Continued strength in key growth drivers: new drug launches in oncology and immunology, robust MedTech expansion, and improved operating margins.
Favorable foreign exchange and a reduction in tariff costs, redirecting capital to R&D.
Positive pipeline developments and strategic acquisitions.
Successful navigation of legal risks and clarity regarding settlements (including talc litigation), which have reduced major uncertainties.
Broad overall market resilience and a rotation toward defensive healthcare shares.
In summary, Johnson & Johnson’s combination of strong and diversified fundamentals, attractive income profile, and bullish technical signals—amplified by improved guidance and innovation momentum—help explain the stock’s recent appreciation and continued investor confidence.
--
Best wishes,
@PandorraResearch Team
JNJ watch $180: Took profits at Serious Resistance that may DIP Caught a PERFECT long now closed (see Idea below)
Now at a serious resistance zone $179.49-180.05
Look for Dip-to-Fib or Break-n-Retest for next move.
.
Previous Analysis that caught the EXACT BREAKOUT:
Hit BOOST and FOLLOW for more such PRECISE and TIMELY charts.
========================================================
.

JNJ is unchainedJNJ is unchained
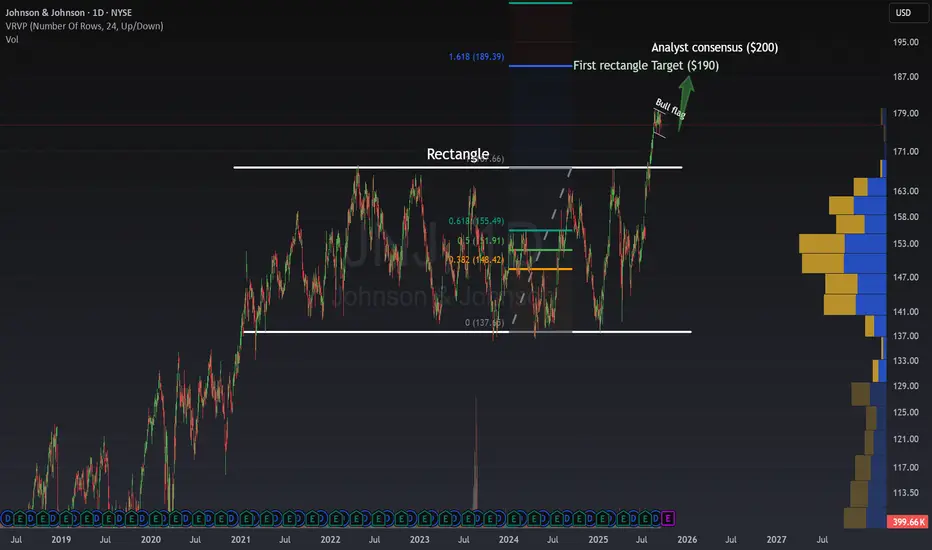
JNJ has spent 4 years moving sideways, which basically means the market agreed this was the fair price f or the stock.
But this August, we saw analysts like Joanne Wuensch from Citi start pointing to the $200 zone , and it looks like she might have been right. 🚀
If you missed the rectangle breakout, JNJ is now giving a second amazing opportunity . After a strong rally and a confirmed breakout ending the balance between bulls and bears, we’re now in a bull flag. Traders are taking profits, but it’s clear that sellers can’t take control.
Volume keeps dropping, and that usually sets up for an upside breakout soon.
This looks like a very attractive buy with potential toward $190–$200 in just a few days, with a tight stop-loss of around 1%.
🟢 For more ideas, follow or subscribe to the newsletter.
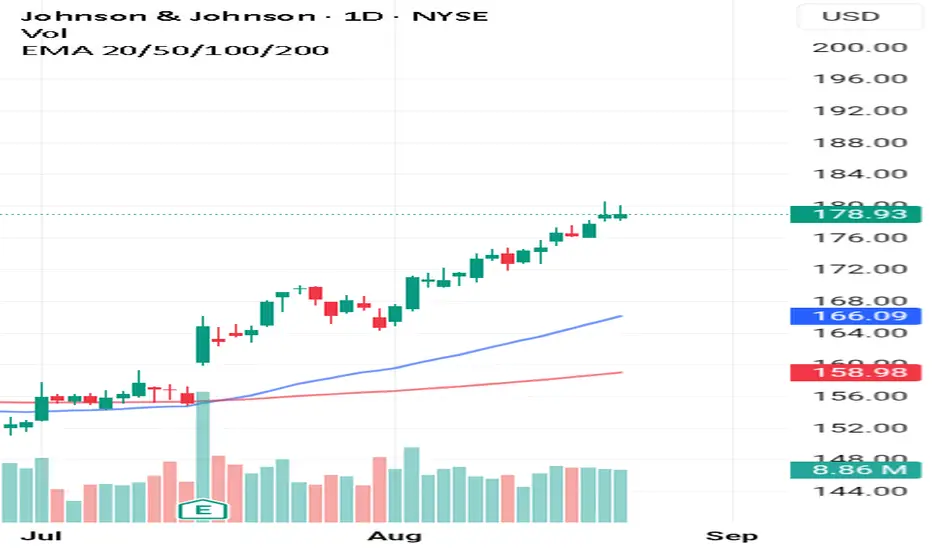
JNJ Pre-Market Write Up (Sept 12)JNJ sitting right under resistance with a fat wall of dark pool prints stacked in the 179–180 zone. CPI is gonna decide if this rips or rejects.
📈 Calls:
If price breaks 179.79 and holds, I’m looking long. First TP 180.08, stretch TP 181.10. That’s where the next dark pool cluster sits, so I’m scaling out there.
📉 Puts:
If we reject 179.78, then it’s puts. TP1 178.98, TP2 178.57. Heavy liquidity around those levels, so I’m taking profits as we test them.
The tape is loaded with dark pool activity around $175–$180, so expect chop. Don’t marry bias, let price show direction.

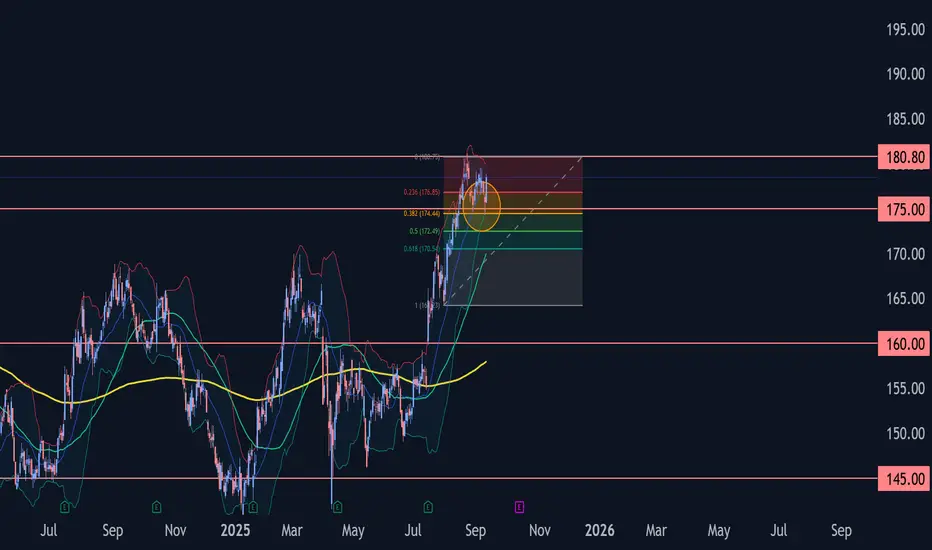
Johnson & Johnson Wave Analysis – 11 September 2025- Johnson & Johnson reversed from the support area
- Likely to rise to next resistance level 180.8
Johnson & Johnson recently reversed from the support area between the pivotal support level 175.00 (which stopped the earlier correction a) and the lower daily Bollinger Band.
The upward reversal from this support area created the daily Japanese candlesticks reversal pattern Morning Star Doji.
Given the clear daily uptrend, Johnson & Johnson can be expected to rise to the next resistance level 180.8 (former top of wave 3).
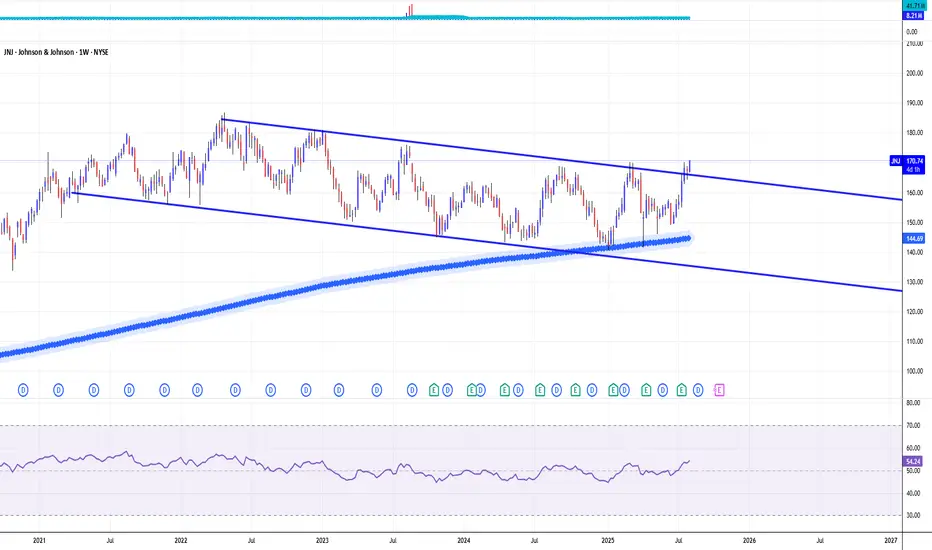
JNJ | Long Setup | Accumulation Breakout | Sep 2, 2025📌 JNJ | Long Setup | Accumulation Breakout + ROI Horizon Q4 2026 | Sep 2, 2025
🔹 Thesis Summary
Johnson & Johnson has broken out of a multi-year accumulation range with a confirmed retest. Despite flat analyst outlooks, the asymmetric reward profile, institutional interest, and macro hedge potential make this a compelling long-hold into late 2026.
🔹 Trade Setup
Bias: Long
Entry Zone: $173 – $178
Stop Loss: $159.14 (below prior range and hedge zone)
Take-Profits:
• TP1: $198.75 (70% out)
• TP2: $215.69 (85% out)
• Max Target: $246.79 (Q4 2026 projection)
Risk/Reward: ~1.8R | ROI expected by Oct 2026
🔹 Narrative & Context
This setup builds on a classic breakout-retest structure from a prolonged accumulation range (2022–2025), confirmed by price action and volume profile support. The zone from $148–$159 acts as a compound hedge area, while $138 remains historical demand.
Catalysts at play:
Q2 2025 earnings beat and guidance upgrade
Tariff burden halved ($400M → $200M)
$14.6B acquisition in neuropsychiatric biotech (Intra‑Cellular Therapies)
Politically-linked accumulation noted in April 2025
Although consensus targets show little upside (avg. $173–$178), price action and strategic accumulation suggest the market may be underpricing longer-term growth potential.
🔹 Macro Considerations
Seasonality: Sept–Nov tends to underperform across large caps, aligning with the expected ~7% correction back into the compound zone before trend continuation.
Valuation: Slightly overvalued, justifying phased entries and hedge levels below $159.
Flow Note: Capital rotating out of defensives. However, JNJ’s setup offers long-duration positioning for reentry on broader market risk-off.
Correlation Profile (5-Year Historical):
S&P 500: +54%
Oil (CL): +58%
Gold (XAU): +39%
This mixed correlation profile enhances its use as a portfolio balancer during macro uncertainty or rotation phases.
🔹 Forward Path
A weekly close above $198.75 unlocks upside invalidation of current analyst targets. Should this post gain traction, I’ll provide:
Weekly chart structure & dividend-compounding angles
Relative strength vs. XLV and peer group (MRK, PFE)
Litigation & pipeline risk monitor
🔻 Like & Follow for structured ideas, not signals. I post high-conviction setups here before broader narratives play out.
⚠️ Disclaimer: This is not financial advice. Always do your own research. Charts and visuals may include AI enhancements.

JNJ - Swing BuyG/G Trend
Volume and VScore support.
Aggro Entry
XLV up, but below 200sma.
Buy at 177.05
Sept 19 175 Option.
Profit: 178.80 Move to breakeven or 25%

Do These 4 Steps To Understand A Short Squeeze MindsetYou believe trading the new high is very hard.You have have heard of pump and dump.This is when someone promotes
A stock price and "wham!" The stock crashes on you.
Maybe you tried using the ADX or DMI indicator and you lost your marbles or mind trying to catch the trend.
Yesterday I felt like a total loser because my trading strategy was not working
"I understand the Rocket Booster strategy but why is the volatility kicking my butt?"
Just like you my indicators stopped working.
But there is a solution it's called the short squeeze mindset.
Let me tell you how I discovered it.
👉I started thinking using a research tool on trading.
👉I remembered that the best way to measure ranges of price action is using candlesticks patterns
So how do you master candlestick patterns?
You need to change time-frames
In this case I am using the daily time frame.
On this timeframe I found
a Green bar 🟩
Then I switched to the 4hour time frame and found a red bar 🟥
Thats the short squeeze mindset.
So let's list the steps I used so that you can learn to use them as well.
1️⃣The Rocket Booster Strategy
2️⃣The Momentum Trading Style
3️⃣The Short Squeeze Mindset
4️⃣The Stochastic Overbought Zone
Combining these 4 steps helped me find the breakout pattern in this stock.
Right now do the following:
1️⃣Check the daily chart
2️⃣Do you see the green bar 🟩?
3️⃣Check the 4 hour chart
4️⃣Do you see the red bar 🟥?
That's the short squeeze mindset.Its the key to price action entry.
You have no excuse if you did the steps above you now see that it is possible to understand the short squeeze mindset.
But you need to do this exercise on top
before the market opens today.. because this pattern will disappear after the market opens today.
So this is your chance to see it.
If you are reading this days in the future dont worry.
At least you have an idea of what it is.So stayed tuned to these articles for more practical examples.
Remember to 🚀 Rocket Boost This Content To Learn More.
Disclaimer ⚠️ Trading is risky please learn about risk management and profit taking strategies.Also use a simulation trading account before you use real money.
JNJ watch $156.72-158.17: Double Golden Fib zone about to break?JNJ struggling against Double Goldens at $156.72-158.17
After many tests from underside, it looks ready to break.
Above this zone are only scattered clouds for some ways.

JNJ AUG - 2025Johnson & Johnson ( NYSE:JNJ ) continues its bullish structure, holding above the 170 support zone with institutional absorption visible in recent candles. Price is approaching upper channel resistance, with momentum pointing toward 185 as the next target if trend strength holds.
Key supports remain at 170 and 160, with an open gap toward 155 that may act as a magnet if momentum fades.
Upside target: 185
Downside target: 160–155 gap
#JNJ #globaltrade #investment #investing #stockmarket #wealth #realestate #markets #economy #finance #money #forex #trading #price #business #currency #blockchain #crypto #cryptocurrency #airdrop #btc #ethereum #ico #altcoin #cryptonews #Bitcoin #ipo

Johnson & Johnson Wave Analysis – 11 August 2025- Johnson & Johnson broke the resistance level 168.15
- Likely to rise to level 175.95
Johnson & Johnson previously broke the resistance level 168.15 (upper border of the weekly sideways price range inside which the price has been trading from 2023).
The breakout of the resistance level 168.15 accelerated the active medium-term impulse wave (3) from July.
Johnson & Johnson can be expected to rise further to the next resistance level 175.95, a former multi-month high from 2023 and the target price for the completion of the active impulse wave (3).

Johnson & Johnson | JNJ | Long at $146.00Johnson & Johnson NYSE:JNJ is strong (but highly controversial) company with anticipated earnings growth on the horizon. With a P/E of 23x, steady dividend growth record, low debt, and expected increased cashflow, the future is optimistic for NYSE:JNJ if they can stay out of the shady spotlight...
While the historical simple moving average I've selected suggests the stock is entering a downtrend on the daily chart, I'm going to go against this given the current price/position it is in. If the price can hold in $140's and then move up, there could be an early cup formation here. However, if the price drops below $140, that idea is out, and the near-term downtrend may be on. But the company, overall, is a personal buy-and-hold for the long-term ups and downs (unless new news points the company in a different direction). Thus, at $146.00, NYSE:JNJ is in a personal buy-zone.
Target #1 = $157.00
Target #2 = $165.00
Target #3 = $170.00+

Johnson & Johnson Wave Analysis – 31 July 2025 Johnson & Johnson reversed from the resistance zone
- Likely to fall to support level 160.00
Johnson & Johnson recently reversed down from the strong resistance zone located between the long-term resistance level 168.15 (upper border of the weekly sideways price range from 2023) and the upper weekly Bollinger Band.
The downward reversal from this resistance zone stopped the earlier intermediate impulse wave (3).
Given the strength of the resistance level 168.15 and the overbought weekly Stochastic, Johnson & Johnson can be expected to fall to the next support level 160.00.

JOHNSON & JOHNSON Sell opportunity on a Double Resistance.It's been 9 months (October 11 2024, see chart below) since our last Johnson & Johnson (JNJ) analysis, where we gave a very timely sell signal that surgically hit our $141.00 Target:
The Channel Down has since broke to the upside and a new Higher Lows structure has emerged but with a clear Resistance Zone for the time being. At the same time, the price is also just below the Higher Highs trend-line that started on the September 04 2024 High.
With the 1D RSI overbought (same as on February 25 2025), we don't give the upside much room to go, so we turn bearish here, targeting the 0.382 Fibonacci extension and Higher Lows trend-line at $160.00.
-------------------------------------------------------------------------------
** Please LIKE 👍, FOLLOW ✅, SHARE 🙌 and COMMENT ✍ if you enjoy this idea! Also share your ideas and charts in the comments section below! This is best way to keep it relevant, support us, keep the content here free and allow the idea to reach as many people as possible. **
-------------------------------------------------------------------------------
💸💸💸💸💸💸
👇 👇 👇 👇 👇 👇

JNJ - Macro View 🌐Hello TradingView Family / Fellow Traders. This is Richard, also known as theSignalyst.
📈 JNJ has exhibited an overall bullish trend, trading within the ascending wedge pattern outlined in blue. It is presently nearing the lower boundary/blue trendline.
At present, JNJ is undergoing a correction phase and is trading within the descending red channel. It is currently approaching the lower limit and a highlighted demand zone in green.
🏹 Thus, the highlighted purple circle is a strong area to look for buy setups as it is the intersection of the green demand and lower blue and red trendlines acting as a non-horizontal support.
📚 As per my trading style:
As JNJ approaches the lower purple circle zone, I will be looking for bullish reversal setups (like a double bottom pattern, trendline break , and so on...)
📚 Always follow your trading plan regarding entry, risk management, and trade management.
Good luck!
All Strategies Are Good; If Managed Properly!
~Rich

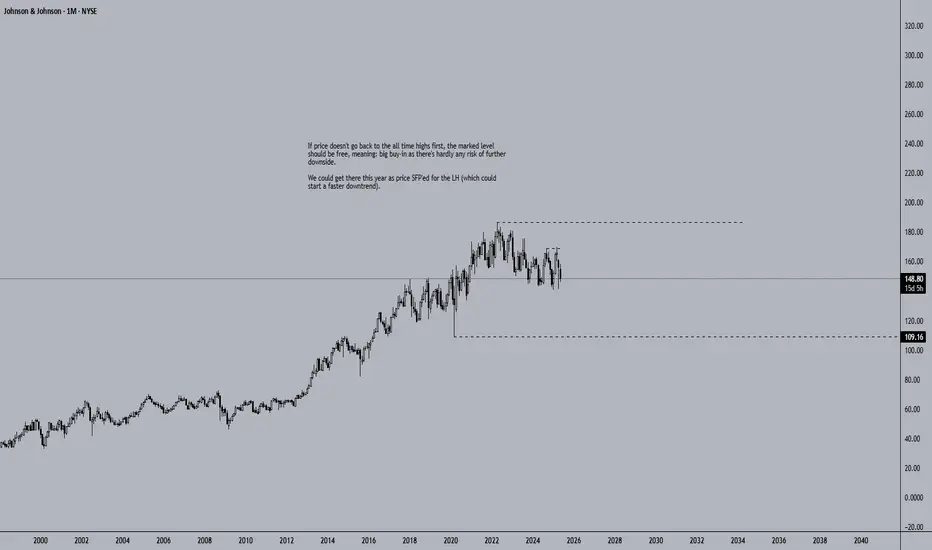
Johnson & Johnson Could Be FreeIf price doesn't go back to the all time highs first, the marked level should be free, meaning: big buy-in as there's hardly any risk of further downside.
We could get there this year as price SFP'ed for the LH (which could start a faster downtrend).
JNJ - Where are you heading Johnson?Good Morning,
Hope all is well. Chart explains it all. Still in a downtrend JNJ is fighting. Looks like we have some momentum forming, lets see how strong it is. Failure to break EMA/Resistance would be bearish, otherwise a break would be bullish.
Enjoy!

JNJ - 2 scenariosHi traders,
JNJ is currently consolidating inside a symmetrical triangle.
We can expect two scenarios:
Bullish scenario:
Open a long position if the price breaks the downsloping resistance line.
SL: below $153.50
Potential TP: $164
Bearish scenario:
Open a short position if the price breaks down and closes below the upsloping support
SL: above $158.00
Potential TP: $149
