NVDA Long Setup: Retest of Former Resistance as SupportHello TradingView Community,
This post outlines a potential long trade setup for NVIDIA Corporation (NVDA) on the 15-minute chart.
Technical Analysis:
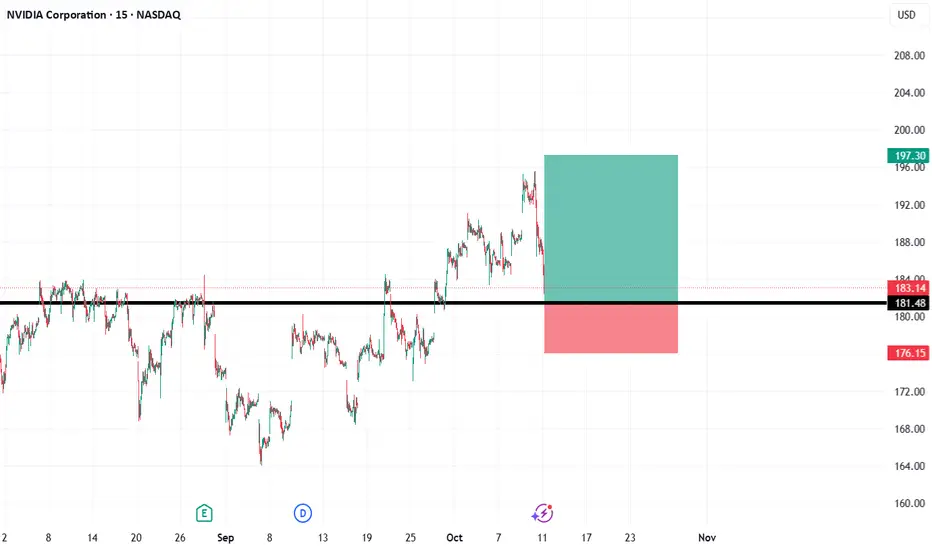
The chart highlights a key horizontal price level at approximately $181.48. This level previously acted as a significant resistance, capping the price on multiple occasions and creating a ceiling for the stock.
We have recently seen a strong breakout above this resistance, indicating a shift in momentum to the bullish side. The trading idea is based on a classic "resistance-turned-support" pattern. We are looking for the price to pull back to this broken level, hold it as new support, and then continue its upward trajectory. The current price action shows this retest may be in progress.
Trade Setup:
The long position tool on the chart visualizes the specific plan for this bullish scenario:
Entry: Approximately $181.48 (at the retest of the new support).
Stop Loss: $176.15 (placed below the support structure to invalidate the idea if the level fails).
Take Profit: $197.30 (targeting a new higher high).
This setup provides a structured plan with a favorable risk-to-reward ratio for a potential continuation of the bullish move.
Disclaimer: This analysis is for educational and discussion purposes only and should not be considered as financial advice. Trading stocks involves significant risk. Please conduct your own research and manage your risk appropriately before making any trading decisions.
Trade ideas
NVDA: Pullback Before the Next AI Move🧠 Technical Overview
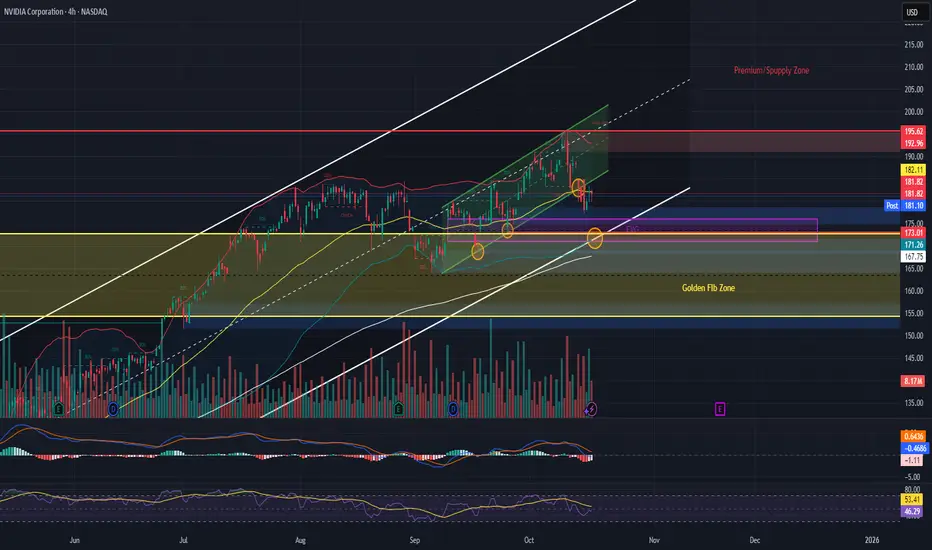
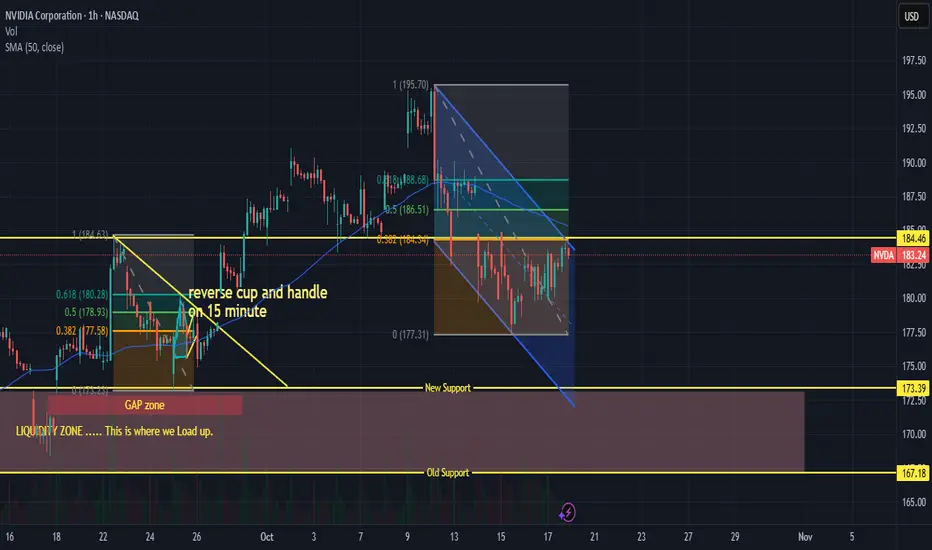
NVIDIA is currently testing the integrity of a larger ascending channel after breaking out of a smaller uptrend structure. The setup reflects a potential pullback to the Fair-Value Gap (FVG) zone around $171–$175, where confluence from multiple structural levels may support a continuation of the long-term uptrend.
Structural Context:
- NVDA broke below a smaller, local uptrend channel, indicating short-term weakness or a deeper retracement phase.
- The larger white trend channel remains intact, suggesting the broader bullish structure is still valid unless price decisively breaks below $168.
- The FVG and trendline confluence around $171–$175 forms a critical decision zone — potential accumulation area before continuation.
Indicators & Momentum:
- MACD: Bearish crossover active but showing signs of flattening → potential slowdown in downward momentum.
- RSI: Near 45, approaching oversold territory, aligning with potential bounce region.
- Volume: Moderate with slight increase during recent sell pressure — suggests controlled pullback rather than full reversal.
Scenario Expectation:
Base case favors a retest of $171–$175 before continuation upward.
If NVDA fails to hold above $168, expect a shift in structure — likely continuation of the larger channel downtrend toward $164–$160 before stabilization.
🌍 Macro & Catalyst Overview
1. AI Demand & Infrastructure Growth
NVIDIA continues to dominate AI chip supply, benefiting directly from global GPU infrastructure expansion. Microsoft’s and Nscale’s recent deployment of 200,000 Nvidia GB300 GPUs reinforces NVDA’s market moat and ensures extended demand through 2029.
→ Bullish Long-Term Catalyst
2. Market wide Valuation Concerns
Despite strong fundamentals, AI sector valuations remain stretched. This creates short-term corrective risk — investors rotating between overextended AI names and value sectors.
→ Neutral / Slightly Bearish Short-Term Catalyst
3. Macro Environment (Q4 2025)
Stable U.S. inflation and Fed holding rates steady maintain a neutral-to-positive tech environment.
Bond yields leveling off supports risk-on sentiment for semiconductors.
4. Global Supply Chain Notes
GPU production remains tight but improving. NVDA’s ongoing partnerships across Europe and Asia mitigate supply bottlenecks, enhancing delivery reliability and forward guidance confidence.
Macro Takeaway:
While NVDA may experience near-term pullbacks amid valuation cooling and technical corrections, its AI infrastructure dominance and GPU supply deals provide a solid long-term bullish foundation. Any retracement into the $171–$175 range could be viewed as a high-probability re-entry opportunity for continuation traders.
📊 Trading Plan Example
Bullish Scenario: Long entries near $171–$175 zone with confirmation of support. Targets: $183 → $192 → $220
Bearish Scenario: Break below $168 confirms structural weakness. Downside target: $164 → $160.
Invalidation: 4H close above $183 with strong volume invalidates short-term bear thesis.
NVDA QuantSignals V3 Weekly 2025-10-11Trade Recommendation for NVidia (NVDA)
Direction: BUY PUTS Confidence: 40% (Below Minimum Threshold) Conviction: HIGHLY SPECULATIVE
Analysis Summary:
Katy AI Signal: Neutral with low confidence (50%). Weekly Momentum: Bearish (negative performance in the past week). Other Factors: Slightly more puts being bought (Put/Call Ratio of 0.93), negative gap, and VWAP indicating potential selling pressure.
While Katy AI’s signal is neutral, weekly momentum leans bearish, suggesting a speculative approach to buying puts. However, this recommendation comes with significant uncertainty due to low confidence and mixed signals.
Trade Setup:
Expiry Date: 2025-10-17 (6 days) Strike Price: $175 Put Delta: ~0.4 (Balanced exposure for speculative positions)
Risks & Considerations:
Highly speculative due to low confidence and mixed signals. Market volatility is elevated, with a VIX of 21.66 compared to the 17.60 five-day average. Close monitoring of market data is essential given the speculative nature of this trade.
Important Notes: This recommendation carries high risk and should be approached cautiously. Only allocate capital that you can afford to lose.
Final Decision: Proceed with a highly speculative BUY PUTS strategy on NVidia with caution. 📊 TRADE DETAILS 📊 🎯 Instrument: NVDA 🔀 Direction: 💵 Entry Price: None 🎯 Profit Target: None 🛑 Stop Loss: None 📏 Size: N/A 📈 Confidence: 50% ⏰ Entry Timing: N/A 🕒 Signal Time: 2025-10-11 14:53:59 EDT
🔴 HIGH RISK WARNING: Use only small position size due to lower confidence and high uncertainty.
📊 Full Technical Analysis Chart (Paid Subscribers Only)
Below is the complete unblurred chart with all technical indicators and analysis details:
Disclaimer: This newsletter is not trading or investment advice but for general informational purposes only. This newsletter represents my personal opinions based on proprietary research which I am sharing publicly as my personal blog. Futures, stocks, and options trading of any kind involves a lot of risk. No guarantee of any profit whatsoever is made. In fact, you may lose everything you have. So be very careful. I guarantee no profit whatsoever, You assume the entire cost and risk of any trading or investing activities you choose to undertake. You are solely responsible for making your own investment decisions. Owners/authors of this newsletter, its representatives, its principals, its moderators, and its members, are NOT registered as securities broker-dealers or investment advisors either with the U.S. Securities and Exchange Commission, CFTC, or with any other securities/regulatory authority. Consult with a registered investment advisor, broker-dealer, and/or financial advisor. By reading and using this newsletter or any of my publications, you are agreeing to these terms. Any screenshots used here are courtesy of TradingView. I am just an end user with no affiliations with them. Information and quotes shared in this blog can be 100% wrong. Markets are risky and can go to 0 at any time. Furthermore, you will not share or copy any content in this blog as it is the authors' IP. By reading this blog, you accept these terms of conditions and acknowledge I am sharing this blog as my personal trading journal, nothing more.
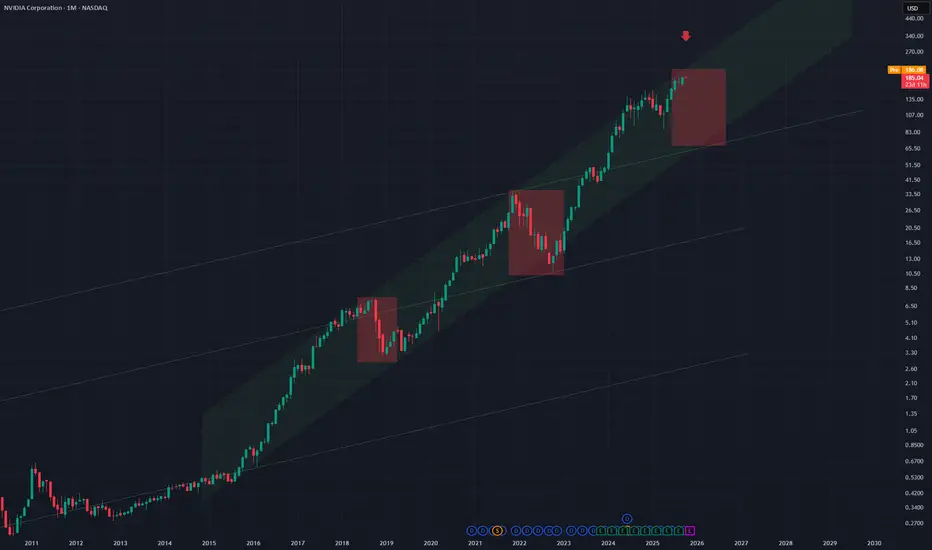
NVDA - Zoom outTopped?
Not financial advice
This market is confusing and out of sync as INTC is looking to shoot off

NVIDIA bearish crabBig red candle on the bearish crab reversal zone signals further downside move. did you buy the dip?

Nvidia - Starting a clear +20% rally!🧲Nvidia ( NASDAQ:NVDA ) rallies higher now:
🔎Analysis summary:
About one decade ago, Nvidia broke out of a major bullish triangle pattern. Following this remarkable breakout, Nvidia continued with a rally of about +35.000%. But looking at all these previous cycles, Nvidia remains bullish with another potential +20% move towards the upside.
📝Levels to watch:
$200, $250
SwingTraderPhil
SwingTrading.Simplified. | Investing.Simplified. | #LONGTERMVISION

Looks like it was a temporary breakout.Being that it was under a previous breakout might test former support and trade sideways between the former support and resistance without significant news. Potentially restoring relations with China I don't see this going higher anytime soon. Especially since they have attached themselves to the hype train that is ORACLE. I guess we shall see what happens.
Bullish Pullback Attack – NVIDIA Heist Plan for Escape Loot!🚨💻 NVIDIA (NVDA) Stock Heist Plan 🎭 | Swing & Day Trade Robbery 💰⚡
🌟 Hey Money Makers & Market Robbers! 🌟
Welcome back to the Thief Trading Den where we don’t trade… we steal from the market vaults! 🏦💸
🔥 Asset: NVIDIA (NVDA)
🎭 Heist Type: Swing / Day Trade
🔑 Plan: Bullish Pullback Robbery
🗝️ Entry (Breaking into the Vault)
First lockpick entry above 167.00+ 🔓
Retest & pullback = perfect robbery spot
Thief layering strategy: stack multiple buy limit orders (layered entry like robbers tunneling from multiple sides 🛠️).
Any price level? Yes, thieves adapt—grab loot wherever the window cracks open! 🏃♂️💨
🛑 Stop Loss (Escape Route 🚪)
Official Thief SL: @ 161.00 ⚠️
But dear Thief OG’s, adjust based on your risk appetite, loot bag size & startergy 🎭
Remember, no thief survives without an escape route! 🚁
🎯 Target (The Electric Fence Escape ⚡)
The High Voltage Electric Shock Fence is guarding the treasure @ 196.00 ⚡⚡
Snatch your profits before the fence fries the loot 🔥
Escape fast, spend faster, rob smarter 💸🍾
⚠️ Thief Alert 🚨
The market guards (short sellers) are patrolling heavy—don’t get caught in their traps 🕵️♂️
Use layered limit orders, scale out profits, and keep your SL tight!
A true thief never overstays at the crime scene 👀
💥 Boost this Robbery Plan 💥
Every like & comment powers the Thief Trading Family 🏆
Stay sharp, stay sneaky & let’s rob NVIDIA together! 🤑🎭

NVDA : The Engine of Robotic Intelligence More BUYSNvidia's chips and AI platforms power the nervous system of modern robotics, enabling real-time processing, deep learning, and autonomous decision-making for next-gen machines.
NVDA – Tariff Shock📰 Context: Tariff Shock Factor
Trump has recently announced that starting November 1, the U.S. will impose an additional 100% tariff on Chinese imports, along with stricter export controls on critical software. The escalation in trade tensions puts semiconductor names like NVDA directly in the crosshairs — greater risk of export restrictions, supply chain stress, and demand cutbacks in China.
So while the long-term AI narrative remains powerful, the short-to-medium term is more volatile than usual.
🧠 My Take
Entry Points (Long):
Entry A: $168 (near resistance break or pullback bounce)
Entry B: $153 (deeper pullback, still within bullish structure)
Entry C: $130 (if severe correction occurs)
Targets:
Target 1: +7% → ~ $180
Target 2: +15% → ~ $193
Target 3: +18% → ~ $198–200
📌 Disclaimer:
This is my personal trading idea, not financial advice. Use your own research, match your risk tolerance, and always manage your position size and stops.

Nvidia Stock Nears the $200 MarkNvidia’s stock has gained more than 4% over the last three trading sessions. The price currently hovers slightly above $190 per share, marking new record highs and moving closer to the psychological level of $200.
Buying pressure has intensified after the U.S. government authorized a series of agreements allowing the export of advanced artificial intelligence chips to the United Arab Emirates, opening a strategic trade channel with the Middle East. This development has strengthened investor confidence, fueled by higher long-term revenue expectations for the company. As a result, buying momentum may continue to dominate in the short term.
Relevant Uptrend
Since early April, the stock has maintained a steady upward trend, consistently posting new highs that confirm a dominant bullish bias on the broader chart. So far, there have been no significant corrections threatening this structure, leaving the uptrend line as the key reference for short-term movements.
However, as the price approaches the $200 level, a phase of indecision could emerge due to signs of buyer exhaustion, reflected in the formation of weakening candles. This behavior could lead to technical pullbacks within the broader bullish trend.
RSI
The RSI line remains above the 50 level, indicating that buying momentum remains dominant over the past 14 trading sessions. However, the indicator is gradually approaching the overbought zone (70). If it reaches this level, it could signal an imbalance in market forces, opening the door to short-term downward corrections.
MACD
The MACD histogram remains close to the neutral line (0), suggesting a lack of clear directional strength in the short-term moving averages.
Both indicators point to a potential phase of indecision in short-term movements, allowing for a possible period of consolidation within the current bullish bias, especially if no new major catalysts emerge to drive aggressive buying pressure in the coming sessions.
Key Levels to Watch:
$200 – Psychological Resistance: In the absence of historical references, this level stands out as the most relevant short-term price point. It could act as a technical barrier, triggering temporary pullbacks.
$184 – Near-Term Support: Corresponds to the recent retracement area. A drop below this level could neutralize bullish momentum and lead to a sideways consolidation phase.
$170 – Key Support: Associated with recent lows, located below the 100-period moving average. A sustained move under this level could shift the market structure and pave the way for a dominant bearish bias.
Written by Julian Pineda, CFA – Market Analyst

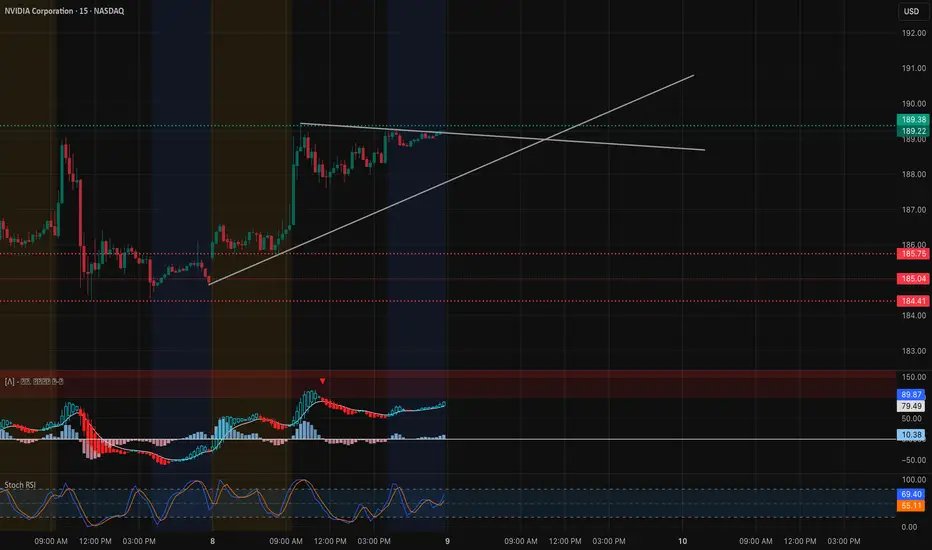
NVDA Holding Strong. Break $190 Before the Next Wave. Oct 9NVIDIA continues to trade with strong bullish momentum, consolidating just under the $190 level — a critical resistance area backed by prior liquidity grabs and gamma resistance. Today’s price action shows tight coiling between $188 and $189.50, indicating a potential breakout setup for the next session.
Market Structure:
* On the 15-minute chart, NVDA is respecting an ascending trendline from yesterday’s low, suggesting sustained intraday bullish control.
* The 1-hour structure reveals a clean range between $185.75 (support) and $189.50 (resistance) — a breakout from this range could trigger a measured move toward $192–$195.
* MACD on the 15-minute is crossing bullish with rising histogram momentum, and the Stoch RSI remains elevated but not yet overextended — signaling possible continuation before cooling off.
Support and Resistance Levels:
* Immediate Resistance: $189.41 → $190.36 (short-term breakout zone)
* Major Resistance (Gamma Wall): $192.5 → $195
* Immediate Support: $186.89 → $185.75
* Key Support Zone: $184.4 → $182.8
GEX & Options Sentiment (1H GEX Chart):
* Highest positive Call Gamma concentration sits between $192.5 and $195, aligning with visible overhead resistance.
* Put support remains dense at $182–$180, forming a sturdy gamma floor.
* IVR remains low at 12.2, and call positioning slightly outweighs puts (13.5% call bias), showing traders are positioning bullish but cautiously.
* The GEX trend favors upside momentum while $185 holds, giving NVDA room to climb toward the $190–$192.5 zone if SPY continues to strengthen.
Trade Scenarios:
Bullish Setup:
* Entry: Above $189.50 breakout confirmation
* Target 1: $192.5
* Target 2: $195
* Stop-Loss: Below $186.8
* Rationale: Trendline support, bullish MACD, and strong GEX alignment support a breakout continuation.
Bearish Setup:
* Entry: Below $185.75 (breakdown retest)
* Target 1: $184.4
* Target 2: $182
* Stop-Loss: Above $187
* Rationale: A rejection at $189–$190 with MACD divergence could trigger a short-term pullback to fill lower liquidity pockets.
NVDA’s price action shows controlled consolidation under a key resistance, suggesting a potential breakout continuation toward $192–$195 if momentum holds. Watch SPY’s direction for confirmation — any weakness there could cause NVDA to retest $185 before resuming upward. For now, bulls are in charge.
Disclaimer:
This analysis is for educational purposes only and does not constitute financial advice. Always do your own research and manage your risk before trading.
Master Correlation StrategiesUnlocking the Power of Inter-Market Relationships in Trading.
1. Understanding Correlation in Trading
Correlation refers to the statistical relationship between two or more financial instruments — how their prices move relative to each other. It is expressed through a correlation coefficient ranging from -1 to +1.
Positive Correlation (+1): When two assets move in the same direction. For example, crude oil and energy sector stocks often rise and fall together.
Negative Correlation (-1): When two assets move in opposite directions. For instance, the U.S. dollar and gold often have an inverse relationship — when one rises, the other tends to fall.
Zero Correlation (0): Indicates no consistent relationship between two assets.
Understanding these relationships helps traders predict how one market might respond based on the movement of another, enhancing decision-making and portfolio design.
2. Why Correlation Matters
In modern financial markets, where globalization links commodities, equities, currencies, and bonds, no asset class operates in isolation. Correlation strategies allow traders to see the “bigger picture” — understanding how shifts in one area of the market ripple across others.
Some key reasons why correlation is vital include:
Risk Management: Diversification is only effective when assets are uncorrelated. If all your holdings move together, your portfolio is not truly diversified.
Predictive Analysis: Monitoring correlated assets helps anticipate price moves. For example, a rally in crude oil might foreshadow gains in oil-dependent currencies like the Canadian Dollar (CAD).
Hedging Opportunities: Traders can offset risks by holding negatively correlated assets. For instance, pairing long stock positions with short positions in an inverse ETF.
Market Confirmation: Correlations can validate or contradict signals. If gold rises while the dollar weakens, the move is more credible than when both rise together, which is rare.
3. Core Types of Correlations in Markets
a. Intermarket Correlation
This examines how different asset classes relate — such as the link between commodities, bonds, currencies, and equities. For example:
Rising interest rates typically strengthen the domestic currency but pressure stock prices.
Falling bond yields often boost equity markets.
b. Intra-market Correlation
This focuses on assets within the same category. For example:
Technology sector stocks often move together based on broader industry trends.
Gold and silver tend to share similar price patterns.
c. Cross-Asset Correlation
This involves analyzing relationships between assets of different types, such as:
Gold vs. U.S. Dollar
Crude Oil vs. Inflation Expectations
Bitcoin vs. NASDAQ Index
d. Temporal Correlation
Certain correlations shift over time. For instance, the correlation between equities and bonds may be positive during economic growth and negative during recessions.
4. Tools and Techniques to Measure Correlation
Correlation is not merely an observation—it’s a quantifiable concept. Several statistical tools help traders measure and monitor it accurately.
a. Pearson Correlation Coefficient
This is the most widely used formula to calculate linear correlation between two data sets. A reading close to +1 or -1 shows a strong relationship, while values near 0 indicate weak correlation.
b. Rolling Correlation
Markets evolve constantly, so rolling correlation (using moving windows) helps identify how relationships shift over time. For example, a 30-day rolling correlation between gold and the USD can show whether their inverse relationship is strengthening or weakening.
c. Correlation Matrices
These are tables showing the correlation coefficients between multiple assets at once. Portfolio managers use them to construct diversified portfolios and reduce overlapping exposures.
d. Software Tools
Platforms like Bloomberg Terminal, TradingView, MetaTrader, and Python-based tools (like pandas and NumPy libraries) allow traders to calculate and visualize correlation efficiently.
5. Applying Correlation Strategies in Trading
a. Pair Trading
Pair trading is a market-neutral strategy that exploits temporary deviations between two historically correlated assets.
Example:
If Coca-Cola and Pepsi usually move together, but Pepsi lags temporarily, traders may go long Pepsi and short Coca-Cola, betting the relationship will revert.
b. Hedging with Negative Correlations
Traders can use negatively correlated instruments to offset risk. For instance:
Long positions in the stock market can be hedged by taking positions in safe-haven assets like gold or the Japanese Yen.
c. Sector Rotation and ETF Strategies
Investors track sector correlations with broader indices to identify leading and lagging sectors.
For example:
If financial stocks start outperforming the S&P 500, this could signal a shift in the economic cycle.
d. Currency and Commodity Correlations
Currencies are deeply linked to commodities:
The Canadian Dollar (CAD) often correlates positively with crude oil prices.
The Australian Dollar (AUD) correlates with gold and iron ore prices.
The Swiss Franc (CHF) is often inversely correlated with global risk sentiment, acting as a safe haven.
Traders can exploit these relationships for cross-market opportunities.
6. Case Studies of Correlation in Action
a. Gold and the U.S. Dollar
Gold is priced in dollars; therefore, when the USD strengthens, gold usually weakens as it becomes more expensive for other currency holders.
During 2020’s pandemic uncertainty, both assets briefly rose together — a rare situation showing correlation can shift temporarily under stress.
b. Oil Prices and Inflation
Oil serves as a barometer for inflation expectations. When crude prices rise, inflation fears grow, prompting central banks to tighten policies.
Traders who monitor this relationship can anticipate policy shifts and market reactions.
c. Bitcoin and Tech Stocks
In recent years, Bitcoin has shown increasing correlation with high-growth technology stocks. This suggests that cryptocurrency markets are influenced by risk sentiment similar to the equity market.
7. Benefits of Mastering Correlation Strategies
Enhanced Market Insight: Understanding inter-market dynamics reveals the underlying forces driving price movements.
Stronger Portfolio Construction: Diversify effectively by choosing assets that truly offset one another.
Smarter Risk Control: Correlation analysis highlights hidden exposures across asset classes.
Improved Trade Timing: Correlation signals help confirm or challenge technical and fundamental setups.
Global Perspective: By studying correlations, traders gain insight into how global events ripple through interconnected markets.
8. Challenges and Limitations
Despite its power, correlation analysis is not foolproof. Traders must be aware of its limitations:
Changing Relationships: Correlations evolve over time due to policy changes, crises, or shifting investor sentiment.
False Correlation: Sometimes two assets appear correlated by coincidence without a fundamental link.
Lag Effect: Correlation may not capture time delays between cause and effect across markets.
Overreliance: Correlation is one tool among many; combining it with technical, fundamental, and sentiment analysis produces more reliable outcomes.
9. Advanced Correlation Techniques
a. Cointegration
While correlation measures relationships at a moment in time, cointegration identifies long-term equilibrium relationships between two non-stationary price series.
For example, even if short-term correlation fluctuates, two assets can remain cointegrated over the long run — useful in statistical arbitrage.
b. Partial Correlation
This method isolates the relationship between two variables while controlling for others. It’s particularly helpful in complex portfolios involving multiple correlated instruments.
c. Dynamic Conditional Correlation (DCC) Models
These advanced econometric models (used in quantitative finance) measure time-varying correlations — essential for modern algorithmic trading systems.
10. Building a Correlation-Based Trading System
A professional correlation strategy can be structured as follows:
Data Collection: Gather historical price data for multiple assets.
Statistical Analysis: Calculate correlations and rolling relationships using software tools.
Strategy Design: Develop pair trades, hedges, or intermarket signals based on correlation thresholds.
Backtesting: Validate the system across different market phases to ensure robustness.
Execution and Monitoring: Continuously update correlation data and adjust positions as relationships evolve.
Risk Control: Implement stop-loss rules and diversification limits to prevent overexposure to correlated positions.
11. The Future of Correlation Strategies
In an era of high-frequency trading, AI-driven analytics, and global macro interconnectedness, correlation strategies are evolving rapidly. Machine learning models now identify non-linear and hidden correlations that traditional statistics might miss.
Furthermore, as markets integrate further — with crypto, ESG assets, and alternative data sources entering the scene — understanding these new correlations will be crucial for maintaining an edge in trading.
12. Final Thoughts
Mastering correlation strategies isn’t just about mathematics — it’s about understanding the language of global markets. Every movement in commodities, currencies, and indices tells a story about how capital flows across the world.
A trader who comprehends these relationships gains not only analytical power but also strategic foresight. By mastering correlation analysis, you move beyond isolated price charts and see the interconnected web that drives the global financial ecosystem.
In essence, correlation strategies are the bridge between micro-level technical trades and macro-level economic understanding. Those who can navigate this bridge with confidence stand at the forefront of modern trading excellence — armed with knowledge, precision, and an unshakable sense of market direction.
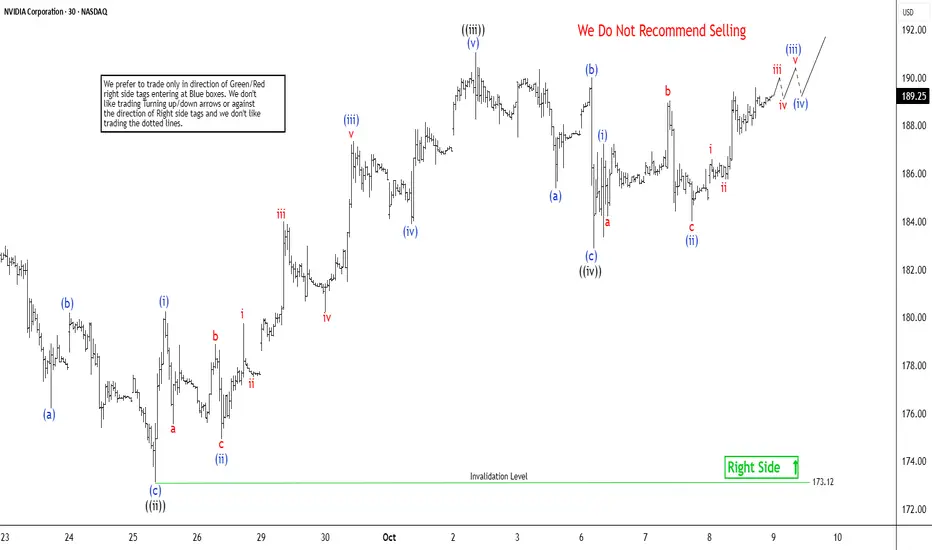
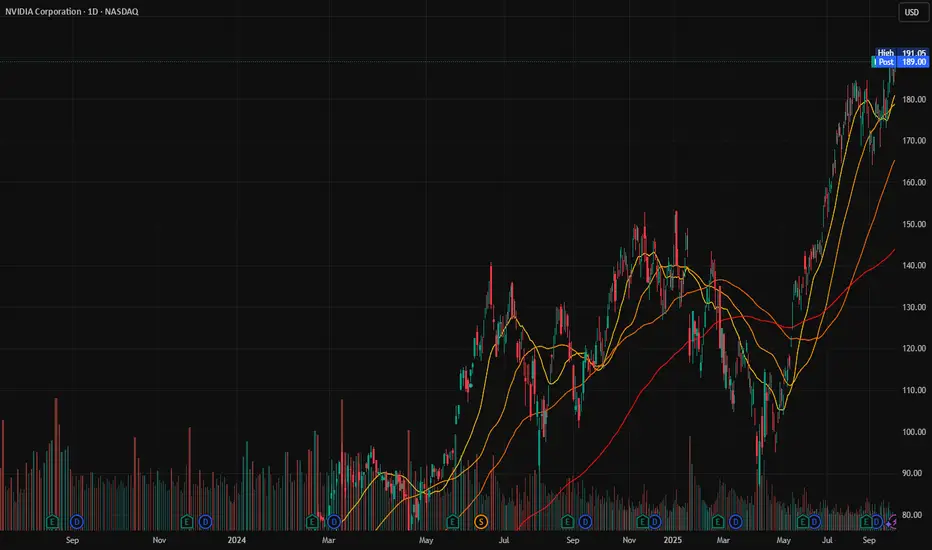
NVDA (Nvidia’s) Leading Diagonal Pattern Targets $193The short-term Elliott Wave analysis for Nvidia (NVDA) indicates that the cycle from the September 18 low is unfolding as a leading diagonal. Starting from that low, wave ((i)) concluded at $184.55, followed by a pullback in wave ((ii)) that ended at $173.12, as depicted in the 30-minute chart. The stock then surged in wave ((iii)), displaying an internal impulse structure. From wave ((ii)), wave (i) peaked at $180.26, with wave (ii) dipping to $174.93. Wave (iii) climbed to $187.35, followed by a wave (iv) pullback to $183.90. The final leg, wave (v), reached $191.05, completing wave ((iii)) in a higher degree.
The subsequent wave ((iv)) pullback formed a zigzag Elliott Wave pattern. From wave ((iii)), wave (a) declined to $185.38, wave (b) rose to $190, and wave (c) dropped to $182.88, finalizing wave ((iv)). The stock has since resumed its ascent in wave ((v)), with wave (i) ending at $187.23 and wave (ii) dips concluding at $184. The stock is poised to climb further, likely completing wave (iii) soon. A wave (iv) pullback should follow to correct the cycle from the October 8, 2025 low before resuming higher. As long as the $173.12 pivot holds, any pullback should find support in a 3, 7, or 11 swing, setting the stage for additional upside.
Full moon energy - $NVDA🟩 190 — resistance zone
🟪 194 — potential breakout
🟥 153 — mid-range support
🟨 127 / 112 — deep demand zones
Momentum still strong but slowing near highs… like energy you can still feel, even when it’s pulling back that “missing you” I do mean you! phase before momentum returns.

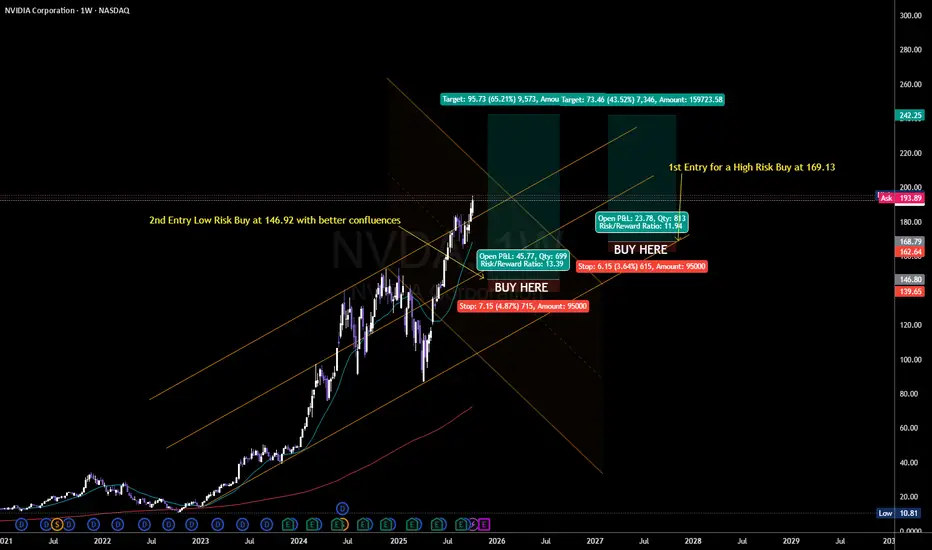
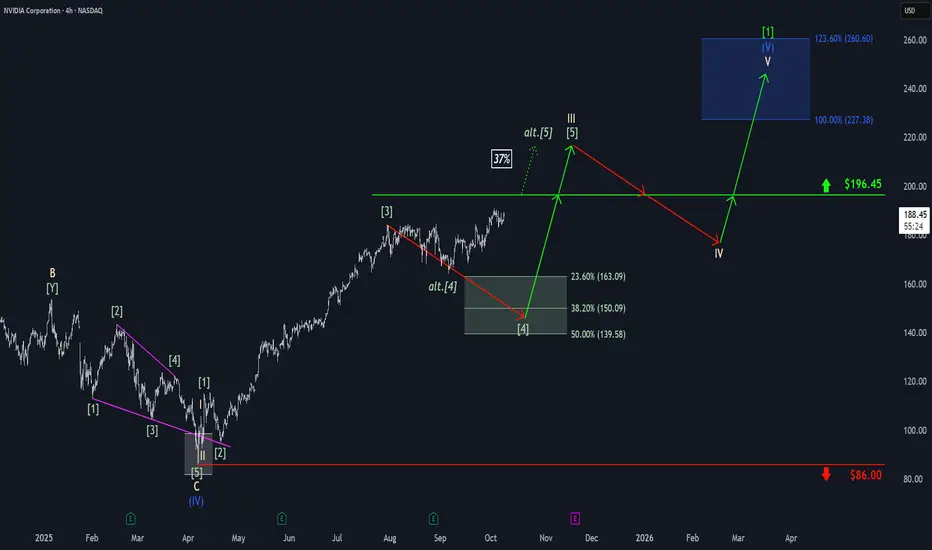
Nvidia: Bullish DistractionAmid bullish momentum, Nvidia edged closer to resistance at $196.45 before settling into sideways action late last week. As a result, there remains a 37% probability that the stock will bypass a new low and instead break directly above the $196.45 level. However, our primary expectation is for the stock to turn lower, targeting our green Target Zone between $163.09 and $139.58 to complete green wave . Only after this move do we anticipate a sustained advance above $196.45, which would mark the completion of beige wave III. Following a wave IV pullback below this threshold, we ultimately expect gains into the blue Target Zone between $227.38 and $260.60, where beige wave V should complete not only blue wave (V), but also the larger neon green wave .
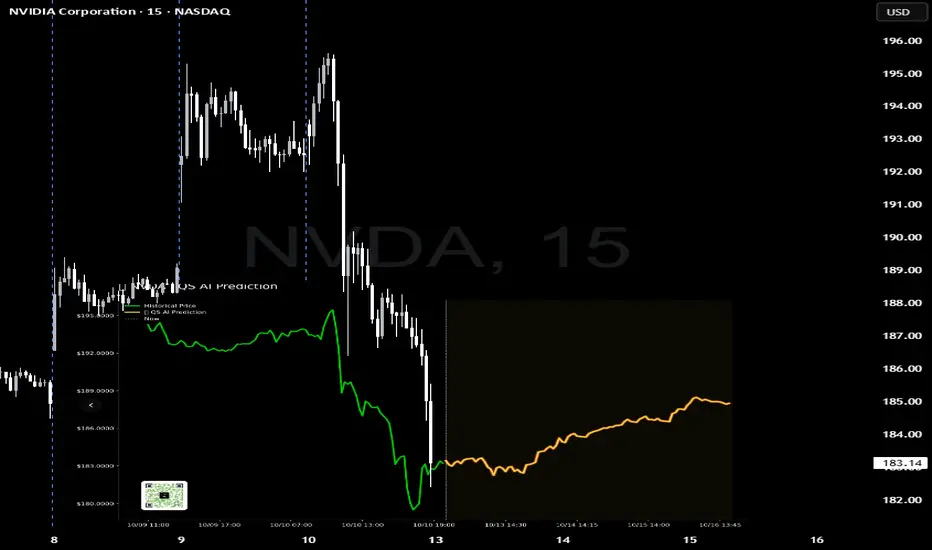
NVDA at the Edge: Can Bulls Hold the Line on Oct. 13?NVIDIA had one of the toughest weeks in months — the stock dropped nearly 5% on Friday as traders rushed to safety during the volatility spike. What we’re looking at now is not just a dip — it’s a real battle between smart money reloading for the next wave and panic sellers trying to exit before another flush.
Let’s break down both the 15-minute intraday structure and the 1-hour GEX setup to see what’s next.
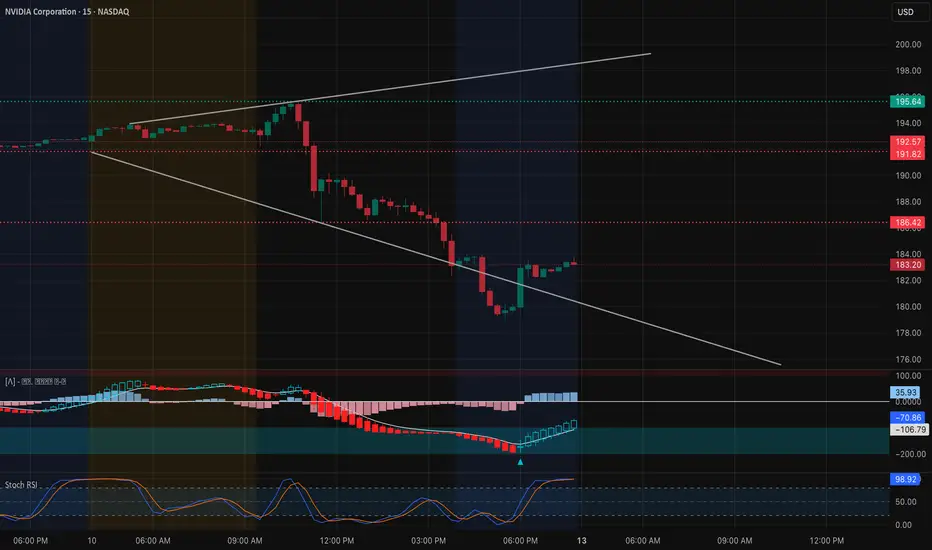
NVDA 15-Minute — Intraday Structure
Friday’s session was brutal. NVDA fell sharply from around 192.5 and closed near 183, creating a steep descending channel that’s still active.
* Trendline & Structure:
The price is still trading below the descending trendline, but we’re starting to see the first signs of stabilization. The last few candles show a short-term bullish divergence forming on MACD, and Stoch RSI is recovering from oversold levels around 25.
That tells us the selling momentum is cooling — at least for now.
* Immediate Resistance Zone: 186.4 – 188.0.
This is the first area bears will defend. A clean breakout above 188 could trigger a quick move toward 192.5, where Friday’s breakdown began.
* Support Zone: 177 – 180.
This is the current intraday demand area. If we see another pullback here at the open, I expect buyers to step in — but if this level breaks, the door opens toward 172, the next strong support below.
* Intraday Plan:
I’d watch how NVDA behaves at 185 – 186 early in the morning. If it rejects this zone and VIX spikes again, short scalps back to 180 make sense.
But if SPY shows strength and VIX cools under 20, NVDA could run a relief move toward 190–192 for a day trade.
NVDA 1-Hour GEX Chart — Options Sentiment
Now this is where things get really interesting.
From the Options GEX and Options Oscillator, we’re seeing how the option market is currently positioned around NVDA:
* Highest Positive Net GEX / Call Resistance: ~188–192.5
That’s the wall where call sellers sit — heavy resistance for now.
* HVL & Short-Term Gamma Level: ~177.5
This level marks the highest volatility line (HVL). Below that, gamma flips negative, meaning dealers will start shorting to hedge, which amplifies downside moves.
* Put Support: ~170–172 zone, where negative GEX peaks (-61%).
That’s the line in the sand for deeper correction.
* IVR / IVX: 22.4 / 51.4 → Volatility is elevated but not extreme. There’s still room for expansion if fear continues.
What this tells me: NVDA is caught right between strong call resistance and heavy put support. Whichever side breaks first will dictate the next big move.
My Thoughts & Trade Ideas
From a technical perspective, NVDA is in a short-term bearish trend, but it’s also sitting at a potential bounce zone. The risk/reward for bulls improves here if volatility doesn’t expand further.
For Intraday Traders:
* I’d wait for confirmation at the open.
* A push above 186–188 could trigger quick long scalps to 191–192.5.
* Failure there? Short setups back to 180 with tight stops above 188.
For Options Traders:
* Calls near the 180 strike for quick rebounds are fine if VIX fades early — but keep expirations tight (1DTE or 2DTE).
* If volatility remains high and NVDA fails 180, puts around 177–175 may gain traction into midweek.
The Bigger Picture
Friday’s move wasn’t just about NVDA — it was all fear-driven. VIX broke 21, SPY collapsed, and traders de-risked across the board. If volatility holds above 20.6 into Monday, NVDA will likely stay under pressure.
But if the market calms, this could be the level where smart money quietly reloads for the next move up.
So going into Oct. 13, I’m cautious but watching for a reversal attempt. The moment NVDA breaks its 15-minute trendline and clears 188 with volume, the sentiment flips bullish short-term.
Key Takeaway:
NVDA is sitting right in the middle of a gamma battlefield. 180 is the must-hold level, 192 is the breakout gate. Volatility will decide the winner.
Disclaimer: This analysis is for educational purposes only and not financial advice. Always do your own research and manage risk carefully.
NVDA - AI Dominance + Strong Technical Structure | Long Entry📈 Ticker: NVDA (NVIDIA Corporation)
📍 Recommendation: LONG
⏰ Timeframe: Position Trade (4-8 weeks)
🎯 Trade Idea Summary
Entry: $189.00 (on pullback to support)
Stop Loss: $173.00 (-8.5%)
Take Profit: $221.00 (+16.9%)
Risk/Reward Ratio: 1:2.0
📊 Fundamental Justification - AI LEADER 🚀
Revenue Growth: STRONG (+114% YoY) - $60.9B to $130.5B 💰
Net Income Growth: STRONG (+145% YoY) - $29.8B to $72.9B 📈
Debt Health: EXCELLENT (Score 10/10) - Low debt, high coverage ✅
Market Position: Dominant AI/GPU market share
Growth Catalyst: AI infrastructure spending cycle
📈 Technical Analysis
Trend: Daily ↗️ Alcista, 4H ↗️ Alcista, 1H ↗️ Alcista (ALL BULLISH)
RSI: 65.8 - Healthy momentum, not overbought
MACD: Bullish and positive across timeframes
Price Action: Above all key SMAs, holding higher lows
Key Support: $185 (recent swing), $178 (SMA20), $173 (critical)
Key Resistance: $195 (psychological), $205 (recent high), $221 (target)
🔍 Catalyst & Market Context
AI Revolution: Sustained data center demand
Earnings Momentum: Consistently beating expectations
Product Cycle: Blackwell GPU platform rollout
Institutional Support: Heavy fund ownership
🎮 Trade Management
Ideal Entry Zone: $188 - $190
Stop Below: $173.00 (below SMA20 and key support)
Target 1: $205.00 (+8.5%) - Consider partial profit
Target 2: $221.00 (+16.9%) - Full position target
Timeframe: 4-8 weeks for full target
⚠️ Risk Factors
Valuation Premium: P/E 53.9 (high but growth-justified)
Market Dependency: Tech sector correlation
Competition: AMD/Other AI chip competitors
Economic Sensitivity: Capex spending cycles
✅ Why This Trade Works
Earnings Powerhouse - Explosive growth in AI era 📊
Technical Strength - Clean uptrend across timeframes 🟢
Structural Tailwinds - Multi-year AI investment cycle 🔄
Risk Management - Defined levels with 1:2 R/R 🛡️
📅 Key Levels to Watch
Immediate Support: $185 - $188
Breakout Level: $195 - $197
Acceleration Zone: Above $205
Invalidation: Below $173 (stop loss)
#NVDA #NVIDIA #AI #PositionTrade #TechStocks #Breakout
#ArtificialIntelligence #Semiconductors #GrowthInvesting #RiskManagement
Disclaimer: This post is for educational and informational purposes only and does not constitute financial advice or investment recommendation. Trading involves substantial risk of loss and is not suitable for all investors. Past performance is not indicative of future results. Conduct your own research and consult with a qualified financial advisor before making any investment decisions.
NVDA: Riding the AI Hype Wave to $250!NASDAQ:NVDA just hit its all-time high last friday, reaching my swing trade target. While I took profits as part of my routine discipline, I still believe there's plenty of upside left, with $250 in sight.
Here's why:
Strong Fundamentals: Nvidia consistently beats earnings expectations, with EPS climbing from $0.11 to $0.68 over recent six quarters. This growth trajectory shows no signs of slowing down, reinforcing the stock's upward momentum.
Analyst Confidence: Out of 65 analysts, 51 rate Nvidia as a "Strong Buy," with none suggesting a sell. While the average price target is $149.81, the highest target of $202.79 shows strong backing from the financial community.
Bullish Technicals: Weekly and daily moving averages, from the 10-day to the 200-day, are flashing "Buy" across the board. Add to that a myriad of other indicators in different time frames (basically, you name it), and it’s signaling "Buy." In short, everything is pointing towards continued bullish momentum and potential for further gains.
Market Leadership: Nvidia's dominance in AI and high-performance computing continues to grow. Its cutting-edge AI chips, as well as its strong presence in data centers and gaming, put the company in a prime position to capitalize on key growth sectors.
And finally, why am I more bullish than even the highest analyst target? Well, it’s simple: the hype. Nvidia is at the forefront of the most exciting and disruptive technologies today—AI, data centers, gaming—you name it. The market's enthusiasm surrounding these sectors is growing exponentially, and Nvidia is perfectly positioned to ride that wave. Sometimes, fundamentals and technicals align with pure market excitement, and that’s where I see Nvidia pushing past those conservative estimates toward $250.
Disclaimer: This content is for informational and educational purposes only. It should not be considered as financial or investment advice. Trading stocks involves risk, and you should perform your own research or consult with a professional before making any investment decisions. Past performance is not indicative of future results.

$NVDA : The Rally’s Writing Its Own Headline! 10/9/2025NASDAQ:NVDA is making steady strides toward its wave C target of $235, following a challenging 13-month correction that found its bottom at $95 in April.
The bullish momentum could push prices even higher, eyeing a potential $321.
Sit tight and enjoy the ride! 🚀👌

NVDA broke the resistanceNASDAQ:NVDA has just broken a resistance, slowly slowly targets 250$.
Currently no sign for downwards.

$NVDA Call Alert – Oct 31 ’25 $190 Calls | 71% ROI PotentialEnter: NASDAQ:NVDA OCT 31 2025 $190 CALLS
Buy in Price: $6.80 - $6.85
Take Profit: $11.63
Stop Bleeding: $5.98
ROI Potential: 71%
Exit Within: 302 Minutes
NVDA - Bear Move Within Up ChannelNVDA is at the top of an up channel on the Monthly chart
This is a very steep up channel
Two prior moves down from the top of this channel can be seen (red rectangles)
Suggesting a third drop happens on this timeframe.