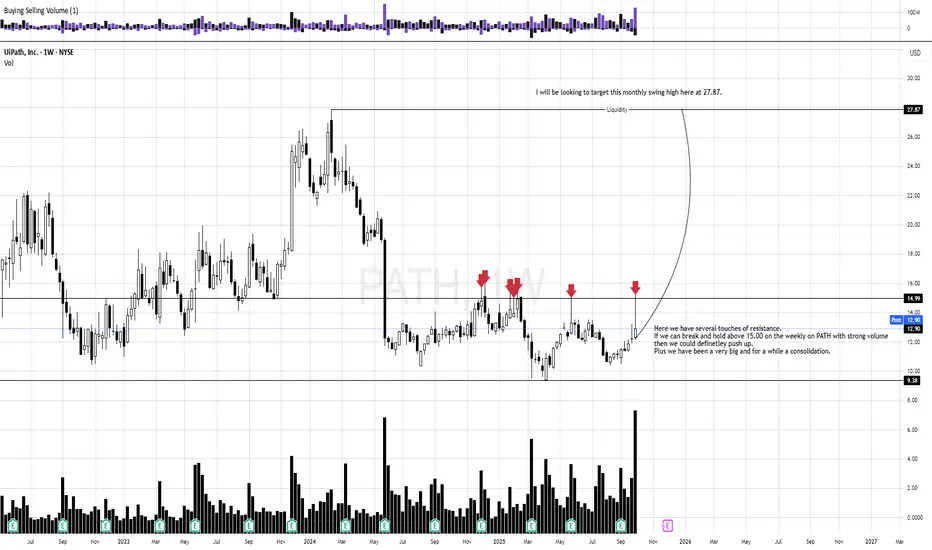
PATH breakout potential?Please reference to the photo why I am looking for a breakout, what my criteria's are and where I will be looking to target. Thank you as always for checking out my post!
PATH trade ideas
[PATH] Investment PositionFollowing the AI evolution, this stock start to be interesting and not only fundamentally but also technically now.
Looking for a reversal of the down trend for a long term upside move.
Great Trade !

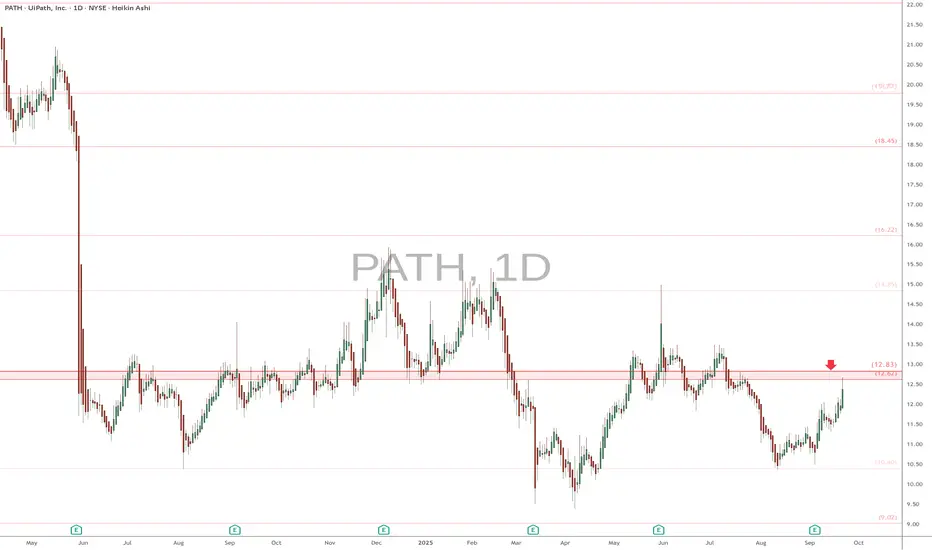
PATH eyes on $12.62-12.81: Key Resistance break to mark BOTTOM PATH trying to paint a bottom after much dumping.
Testing a proven resistance zone at $12.62-12.83
Look for a Break-n-Retest to hopefully mark BOTTOM.
UiPath BuyFits wyckoff accumulation perfectly and think this will run up until earnings are a heavy sell off. Targets are on the chart provided using volume profile.

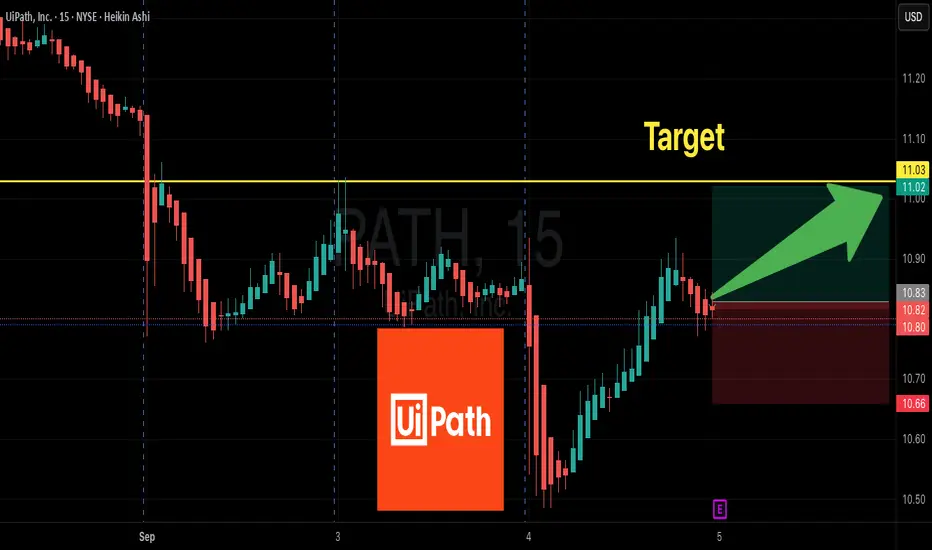
UiPath ($PATH) Earnings: Call the $11 Spike!
# 🚀 PATH Earnings Trade Setup — 09/04/2025
**Directional Bias:** **Moderate Bullish** (63% confidence)
**Event:** PATH FQ2 2026 Earnings (AMC 09/04/25)
**Strategy:** Short-dated, asymmetric **single-leg call**
---
## 🎯 Trade Details
| Item | Details |
| ----------------- | --------------------------------- |
| **Instrument** | PATH |
| **Direction** | CALL (LONG) |
| **Strike** | \$11.00 |
| **Expiry** | 09/05/2025 |
| **Entry Price** | \$0.58 |
| **Profit Target** | \$1.16 (+100%) |
| **Stop Loss** | \$0.29 (-50%) |
| **Size** | 1 contract (adjust per portfolio) |
| **Entry Timing** | Pre-earnings close |
| **Expected Move** | \~6% |
| **Confidence** | 63% (Moderate Bullish) |
---
## 🔍 Why This Trade
* **Guidance History:** 100% beat streak last 8 quarters → asymmetric upside.
* **Options Flow:** Heavy **call buying at \$11**, elevated OI & volume → potential **gamma squeeze**.
* **Technical:** Slightly bearish (below 50/200 MA) but neutral RSI — event-driven trade overrides weak technicals.
* **Fundamentals:** Strong cash & FCF; decelerating revenue & negative GAAP margins.
* **Macro/Sector:** Enterprise RPA tailwinds; cautious market sentiment.
---
## ⚡ Risk / Reward
* **Max Loss:** \$0.58 → \$58 per contract
* **Stop Loss:** \$0.29 → \$29 per contract
* **Target:** \$1.16 → \$116 per contract
* **R\:R (Stop / Target):** 1:2 (\~+200% upside vs -50% downside)
---
## 📈 Execution Tips
1. **Enter pre-close** on 09/04 at or near ask \$0.58.
2. **Scale out:** 50% at +100% (\$1.16), 50% at +200% (\$1.74).
3. **Hard stop:** 50% loss (\$0.29) or gap below \$10.00 → exit.
4. **Intraday exit:** Close within 2 hours post-market open if targets not hit.
5. **Size safely:** Risk ≤2–3% of portfolio.
---
## ⚠️ Key Risks
* Missed earnings / negative guidance → sharp drop, IV crush.
* High put OI below \$11 → downside hedges could exaggerate dips.
* Limited liquidity at open → use limit or mental price orders.
* Event-driven binary risk → only hold intraday; avoid overnight.
PATH --- Pop?PATH — Setting Up for a Pop?
UiPath (PATH) is showing signs of strength as it builds a base just above key Fibonacci support and prepares for a potential breakout in the broader AI + Robotics narrative.
Technical Setup:
Price holding above the 38.2% Fib retracement from the May rally.
Volume shelf + value area support at ~$12.30–$12.50 creating a launchpad.
21/50/200 SMAs converging — this type of compression often precedes expansion.
TTM Squeeze building pressure — prior squeezes on this name have led to fast directional moves.
Fundamental Tailwinds:
PATH is an automation leader riding the AI + enterprise software wave.
Sector rotation into Robotics and AI names (SYM, ROK, RR) lifting sentiment.
Recent dark pool activity shows accumulation—large 8M+ share blocks suggest institutional interest.
Thesis:
A close above $12.70 could trigger a move into the $13.40–$14.60 resistance zone, with a possible gap fill toward $18 on strong momentum.
Risk:
Invalidation below $11.80 (50% retracement / SMA cluster). Tight risk-reward if using LEAPs or long shares.

PATH ready to advance to 14.9-15$ this summer!Order flow indicating strong buy sequence to 14.9-15$ range is imminent. Still expecting additional volatility this summer before price advances to 18$ primary buy-side target later this yr.
Holding call options for Aug and Sept expiration

Next Move Decides the Trend: PATH’s $13 Level is Make or BreakYou're looking at UiPath Inc. (PATH), and it's a clean textbook setup "moment of truth".
PATH has rallied sharply off $11 and just tagged major overhead supply ($13), a former long-term support-turned-resistance zone. The reaction here matters a lot — it’s the line between a failed breakout and the start of a new bullish leg.
Technical Breakdown
1. Price Action – Retesting a Broken Base
Price slammed into the $12.90–$13.00 resistance, which was a clear prior demand zone that broke down in March. This is a classic bearish retest setup — price often rallies into this zone, exhausts, and rolls over.
However, if bulls absorb selling here, it flips the narrative to accumulation breakout.
2. Volume – No Conviction Yet
Volume on the way up was relatively weak, and there’s no high-volume breakout to confirm a structural shift. That favors a fade or stall, unless we see sudden buying pressure soon. Compare that to the heavy volume on the breakdown in March — sellers have muscle here.
3. MACD – Bearish Crossover
MACD just crossed bearish with declining histogram.
This suggests momentum is fading, and could be rolling over for a downside move.
The last time this happened (early April), it preceded a ~10% drop.
4. RSI – Bearish Divergence Setup
RSI made a lower high, while price made a higher high — a textbook bearish divergence.
RSI is now back to ~53, so momentum has already cooled off significantly.
This adds fuel to the argument that momentum peaked into resistance.
5. Structure + Fibonacci
The rally off the lows retraced ~61.8% of the previous selloff — a key Fib level.
If price fails to close above this Fib + structure zone, it becomes a high-probability reversal area.
$11.35 becomes the key support target if it rolls over.
The bull case hinges on:
Break above $13.30 with volume
MACD re-cross bullish with RSI > 60
Target would then be $14.25+, possibly back toward Jan highs

PATH // The yellow line is our support point. Let's wait for the 22 exponential average to cut upwards to the 50 exponential average.


$PATH short term $19.50 long term gap fill @ $60*DISCLAIMER* For best results view on PC
This chart includes a high volume shelf and POC at $10 and a secondary shelf at $19.50 with the potential for a long term gap fill to $60 based on gap theory as well as Fib retracements
NOTICE this is not financial advice
Editors note pls put the right chart up for the tenth time
NYSE:PATH www.tradingview.com

3/13/25 - $path - meh. tough call... pass?3/13/25 :: VROCKSTAR :: NYSE:PATH
meh. tough call... pass?
- snagged a meager position of this AH -16 or so %
- read the transcript. i'm just not impressed. all this "cash generation" is just going to buying back shares of so much stock comp. and honestly, blaming "macro economic" situation for budget decisions being kicked (which that may be true) is just nothing i want to get involved in.
- god bless if their agentic stuff is catching wind, but it sounds like it's not a needle mover and TBH the tools are getting so good that might be tough to compete so they better speed this TF up
- hoping it opens in the same range i bought it... cathie can keep holding it, it's so tough to own any sofware in this tape that's not scale/ network effect stuff (e.g. FB - social or BTC - money... etc.)
anyone actually use this and think it's worth a deeper look?
V

$PATH PATH Possible double bottom on the HTFPATH is possibly forming a double bottom, visible on the High Timeframes such as weekly and monthly, possible target $25

ON THE RIGHT $PATH - 100% UpsideNYSE:PATH - About to clear a path higher!
- Green H5 Indicator
- Bullish H5 Cross
- Wr% is up trending into the WCB
- All indicators are firmly pointed upwards
- Massive volume shelf with GAP
- 25 MA is curling up and supporting this stock
- Great fundamental play that is a leader in RPA Ai bots
- Tech Services/ SaaS sector is about to get HOT!
Measure move is $18
PT's are 19.81/28
Not financial advice

$PATH should test upper end of the range @ $21- NYSE:PATH is uniquely positioned for robotics automation which could benefit from advances in Generative AI and with launch of smarter Machine Learning & AI models.
- NYSE:PATH sits in the application layer which will provide companies to automate things with least friction while leveraging powerful models.
- NYSE:PATH is badly beaten down. However, with advancement of AI, this company could leapfrog its offering to customer
- NYSE:PATH could easily be potential acquisition by NYSE:NOW or NYSE:CRM

Don't miss the Next AI Gold Rush! WATCH NOW!In this video, we delve into the next phase of artificial intelligence and explore the companies set to benefit the most. From giants like Microsoft and Salesforce to rising stars like Snowflake and CrowdStrike, we break down how each company is harnessing AI to revolutionize their industries. Don't miss out on this deep dive into the tech titans leading the AI charge and shaping the future. Subscribe and hit the bell icon to stay updated on the latest in AI advancements! NASDAQ:CRWD NYSE:CRM NYSE:SNOW NASDAQ:MSFT NASDAQ:TEAM NYSE:PATH NYSE:SHOP NASDAQ:DDOG NYSE:NET NASDAQ:MDB
What companies are you positioned in or ready to start a position in?
Let me know in the comments below!

PATH | InformativeNYSE:PATH
Scenarios:
Bullish Scenario:
IA breakout above $14.06 can lead to $14.59, $15.19, and eventually $15.93.
Bearish Scenario:
A drop below $12.62 would target $12.34, then $11.92, and possibly $11.49.
Strong bearish confirmation below $10.98.
Strategy Recommendations:
Long Position: Only if the price sustains above $14.06 with strong volume.
Short Position: If the price closes below $12.62, targeting lower support levels.
Wait-and-See: Until a clear breakout or breakdown occurs.
*Personally I' m bearish.

Bollinger Bands Contracting. Could Explode In Either DirectionWhile it can explode in either direction (as signaled by Bollinger Bands contraction), given that it has already corrected significantly and that we have a double bottom, it more likely to move up towards the golden pocket. Expectation is $19 by next earnings.


Bullish earnings outlookBoth charts have shortterm similarities. The PATH Chart-Structure indicates the earnings to bring a positive effet tomorrow.
But this is very speculative, a move to the downside is also possible.
I established a very small position on these price lvls.

UiPath: Gap Fill to the Upside?UiPath fell sharply in the spring after its CEO stepped down, but now some traders may look for a rebound.
The first pattern on today’s chart is the bearish gap on May 30. The AI and automation stock ended yesterday inside that zone. Could prices fill the gap to the upside?
Second, PATH is above its 50- and 100-day simple moving averages. That may suggest its longer-term trend is trying to reverse upward.
Third, this year’s low of $10.37 near the trough in 2022 may confirm that support is in place.
Next, prices have cleared a falling trendline along the peaks of September and October. The lower study with our 2 MA Ratio also shows the 8-day exponential moving average (EMA) has crossed above the 21-day EMA. Those points may suggest that its short-term trend has gotten more bullish.
TradeStation has, for decades, advanced the trading industry, providing access to stocks, options and futures. If you're born to trade, we could be for you. See our Overview for more.
Past performance, whether actual or indicated by historical tests of strategies, is no guarantee of future performance or success. There is a possibility that you may sustain a loss equal to or greater than your entire investment regardless of which asset class you trade (equities, options or futures); therefore, you should not invest or risk money that you cannot afford to lose. Online trading is not suitable for all investors. View the document titled Characteristics and Risks of Standardized Options at www.TradeStation.com . Before trading any asset class, customers must read the relevant risk disclosure statements on www.TradeStation.com . System access and trade placement and execution may be delayed or fail due to market volatility and volume, quote delays, system and software errors, Internet traffic, outages and other factors.
Securities and futures trading is offered to self-directed customers by TradeStation Securities, Inc., a broker-dealer registered with the Securities and Exchange Commission and a futures commission merchant licensed with the Commodity Futures Trading Commission). TradeStation Securities is a member of the Financial Industry Regulatory Authority, the National Futures Association, and a number of exchanges.
TradeStation Securities, Inc. and TradeStation Technologies, Inc. are each wholly owned subsidiaries of TradeStation Group, Inc., both operating, and providing products and services, under the TradeStation brand and trademark. When applying for, or purchasing, accounts, subscriptions, products and services, it is important that you know which company you will be dealing with. Visit www.TradeStation.com for further important information explaining what this means.

Fundamental analysis on UI Path: medium-long term.Hello everyone,
It's a fundamental analysis, all the way I used some technical analysis tools (see, fibionacci retracement, channels, trend-lines and resistances) because, since not having enough history (the IPO having been in 2021) technical analysis has to give precedence to the fundamental analysis, especially when it's not crypto assets but companies really operating in the markets, and especially among all, the technology one (automation/AI sectors)!
Let's start with fundamental analysis:
UI Path: An explosive growth opportunity?
UI Path (NYSE: PATH), a leader in the robotic automation industry (RPA), may be poised for significant upside. With a market set to grow from $10 billion in 2023 to over $23 billion by 2028 (CAGR of 19%), UI Path is perfectly positioned to ride this wave. Currently, the share price has fallen to $13.06 (as of Oct. 19, 2024), making it a potentially undervalued opportunity.
Strengths:
Continued revenue growth: In 2023, UI Path reported revenues of $1.06 billion, up 19 percent from the previous year. Forecasts indicate revenues of 1.25 billion by 2024, with the possibility of exceeding 1.7 billion by 2026, for an annual growth rate of 15%.
Loyal and expanding customers: With a 130% retention rate, customers not only remain loyal, but also increase their investment in UI Path's platform, signaling trust and steady growth.
Profitability in sight: The company is rapidly improving its operating margins, and is expected to become profitable in the second half of 2025. Gross margins are already at 80 percent, providing a solid foundation for future growth.
Strong liquidity: UI Path has $1.8 billion in cash and minimal debt exposure. This position of strength allows it to invest in innovation and weather any economic shocks.
Propelled by artificial intelligence: UI Path is integrating new capabilities based on artificial intelligence, making its solutions even more powerful and sought-after, especially as digitization increases in every industry.
Potential valuation and upside:
Current price: Currently, the stock trades at $13.06.
Price target: Analysts predict an average target of $22, with an optimistic estimate as high as $27. This represents a potential upside of 68 percent to over 100 percent.
Valuation Multiples: With a current Price/Revenue ratio of about 6.8x, the stock is undervalued relative to the historical average for growth technology stocks. A return to a 10x ratio could bring the stock price to $22-23.
Why get in now?
on the continued expansion of the automation market and UI Path's solid positioning, the current price of $13.06 seems to offer an attractive entry opportunity. If the market recognizes the expected growth and impending profitability of the company, we could see a significant upside of 70-100% in the next 12-18 months.
For UI Path, I would personally tend to be bullish, but with some caution. Here's why:
Bearish aspects (to consider):
Stock valuation: Although currently trading at lower levels than peaks, UI Path remains relatively expensive compared to other tech companies. If it fails to demonstrate profitability on schedule (by the second half of 2025), there could be bearish pressure.
Growing competition: The automation and AI industry is becoming very competitive, with large and small players entering the space. This could put pressure on margins and UI Path's ability to maintain its leadership.
Dependence on macroeconomic environment: A global economic slowdown or reduced technology spending by businesses could negatively affect UI Path's growth, as many companies may postpone implementation of automation solutions.
Technically:
If one wants to trade , one would have to wait for a break of the red channel for bullish confirmation. However, in the past few sessions, we are bouncing off the mm50 daily, which could act as support. However, one has to be careful as nothing prohibits that before going to make the targets indicated by the resistances (orange horizontal lines) it could make further bottoms. If one wants to hold , this entry level is also perfect. I expect in the next 5 years a boom in this stock. Yes, I calling for a pump :D
I would like to remind you that this is not intended to be an incentive to invest, disinvest or stay flat but is only the result of fundamental and technical studies and analysis.
Thanks for your attention and remember this analysis in a few years.
Omar
