9/26/25 - $rgti - Getting fried on the stock's supply9/26/25 :: VROCKSTAR :: NASDAQ:RGTI
Getting fried on the stock's supply
- i've been trading this around a LOT
- perhaps i'm breakeven at this pt, but i'm treading water well and haven't lost sight of my elephant
- buyers of this issue are the definition of getting high on their own stock supply
- i have yet to read or be sent a single convincing reason this company is worth a lick above zero
- biggest short position i've had now at this pt seeing it fail at the open
- at this pt i'm locked in
- oklo was a big win (short this week/ out now)
- qure a big win (long this week/ out now)
- added some run for good measure we'll see
- but we are hunting elephants
- and this one has never looked like so much meat on the bones
- we'll see who has the last laugh
- so far the bulls have been winning
- but idk many who have pulled profits. careful here ;0
V
Trade ideas

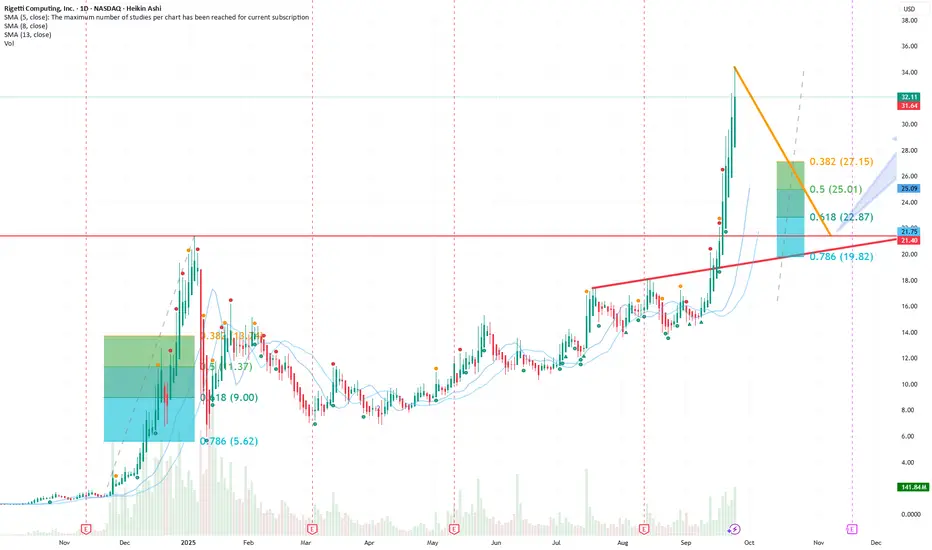
Slowing momentum, Correction phase?OK, so i am the typical bull guy. However i try an estimate for a correction after a parabolic phase, as i see slowing down of the upwards movement.
Correction after the surge end of last year 24 stopped before the 78,6 fib.
--> correction to the last ATH around 21,5
9/22/25 - $rgti - What's this pattern called?9/22/25 :: VROCKSTAR :: NASDAQ:RGTI
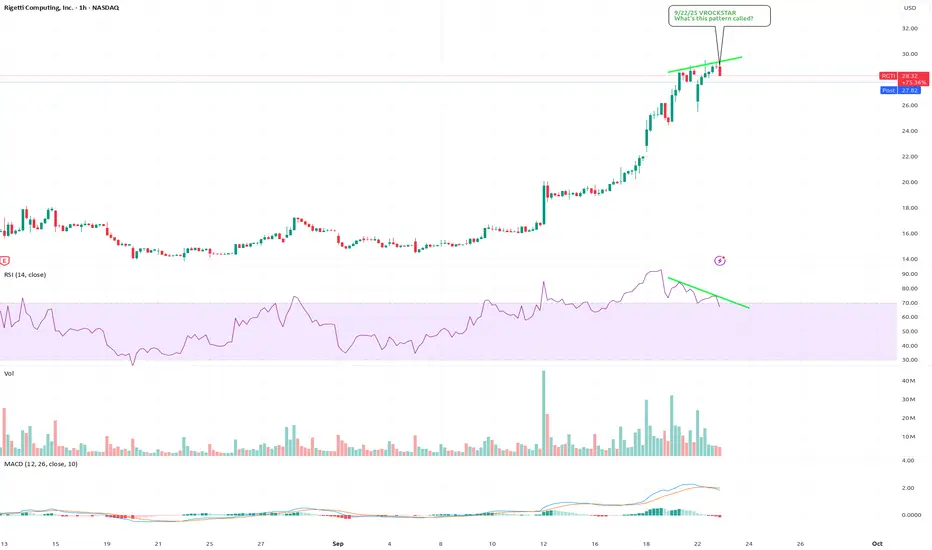
What's this pattern called?
- while admittedly TA is not my game
- and it's dangerous to use the "F" word around here (Fundamentals)
- the reality is, there really aren't any fundamentals to speak of
- so when valuation becomes $10B...
- and you get a move like the chart above
- and you start to see bearish kramering
- the support here friends, isn't tough to spot it's $20-$22
- does this thing boot/ rally to new highs? perhaps
- thankfully i was out of the WHOLE position on the dump this AM
- but then i got back to full size short too soon... and ended the day slightly up on the short. not fun.
- that being said, the hourly bar is really hoping mr. gym kramer speaks positively about NYSE:IONQ tn
- otherwise we'll go to $22. i'll cover, again. and we'll see.
- but seeing this name boot from -10% to +3% was wild. congrats to the bulls. the red finish and this pattern, though. ugly.
- you'll need to find more pumpers to sustain this rally, or else px action needs to cool off.
V
RGTI - Hey Quantum make me rich please :))Hello Everyone ,
This is the update analysis for Rigetti Computing , ticket symbol RGTI.
I was shared some analysis on RGTI and last one was at 24 August , you can access it below:
Price was 14.82 and on Friday closed price is 28.52 almost doubled less than a Month , waht a big gain.
All quantum computing stocks are still so volatile but i say everytime , i invest for future and i would like to be part of this success story. Long term i trust Quantum computing.
My expectation for next week is depends on News and other economic indicators:
It could try to pull back to 24.70 - 25.00 and if you are a new investor then you could try to get RGTI from this level.
Other possibility is , it could reach to 33.50 which is again approx %17 up from today's level.
My middle term expectation , it could pricing inside to 2 yellow levels that i marked in chart.
24.70 - 25.00 / 33.50 - 34.00
My long term expectation is much more over from these levels :))
I shared this analysis, because dear @interestingcnu asked me to share up to date anaylsis.
Hope you have bought RGTI on time as me ;)))
This is just my thinking and it is not invesment suggestion , please do not make any decision with my anaylsis.
Have a lovely Weekend to all.

9/18/25 - $rgti - I'm degen short this thing9/18/25 :: VROCKSTAR :: NASDAQ:RGTI
I'm degen short this thing
- when a $6M (wink, nod) contract gets "announced" and we ape $600M in market cap is the time to pull the degen short out of my box.
- i have exactly 2 positions in this make-no-sense-market
- i'm long OTC:OSOL at 35% discount to solana spot w/ etfs being announced maybe within 30-60 days
- and i'm short like an ape on $rgti.
- book is effectively net short bc of how big NASDAQ:RGTI short is
- you really don't think they'll do an offering here?
- well hope the party keeps going for u guys
- i like the oct expires that let me ratchet up and down
V

Rigetti broke ATH to $22Rigetti Computing Incorporated had a positive push up of 10% today, and that pushed the stock to an all-time high of $21.88. It broke its previous high of $21.50 to reach this all-time high.
If you look at the chart, you'll see a blue ascending trend line and a horizontal green line, with a confluence around the $21.54 zone.

Rigetti broke ATH to $21.88Rigetti broke previous ATH to $21.88
Rigetti Computing Incorporated had a positive push up of 10% today, and that pushed the stock to an all-time high of $21.88. It broke its previous high of $21.50 to reach this all-time high.
If you look at the chart, you'll see a blue ascending trend line and a horizontal green line, with a confluence around the $21.54 zone.
So, looking at this stock, if this breakout of this zone is sustainable, we might see it push further upward. However, this zone is critical, and the sustainability of this push depends on it staying above this level. If it falls below, we might see it retest the $20 zone.
For me, I'll remain patient to see a clear price action for the direction I'll follow. Remain positive, and let's see how this plays out. Thanks!

RGTI at ATH LevelsRGTI is retesting the old ATH zone near 21.4, which previously collapsed into a brutal selloff. This level carries strong psychological weight, as many bagholders look to exit on breakeven. No fundamentals justify the current move – it is purely momentum flow.
The setup: treat the ATH as technical resistance. Expect at least a short-term rejection, potentially a 2-point pullback, offering scalp opportunities.
Macro note: FOMC is ahead with the expected 0.25 cut. That creates volatility but not structural risk for option positions. Stops on directional options are not triggered by noise.

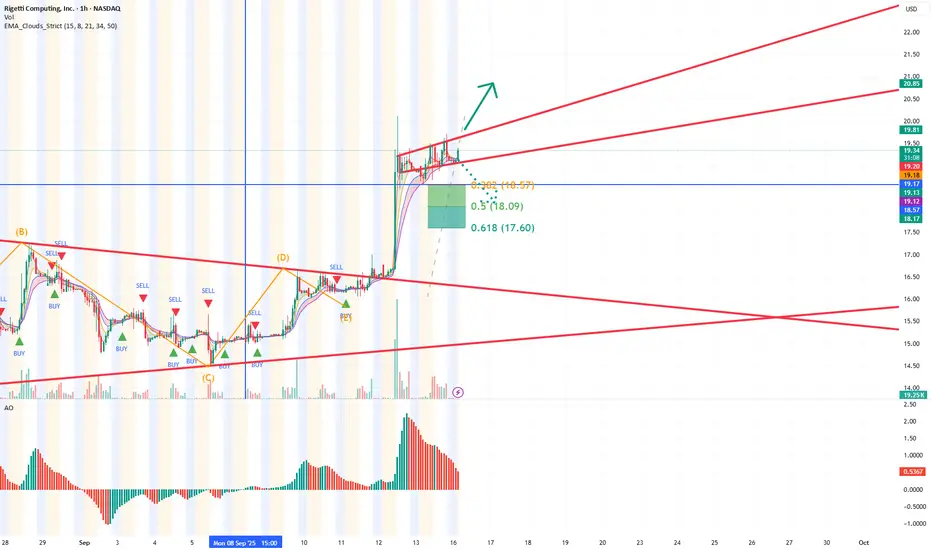
Widening Wedge, Continuation patternAfter the perfect breakout of the ABCDE-Formation we touched the fibonacci-zone and are now seeing a broadening rising gap, which is a continuation pattern.
The upper and lower barriers have already been touched 3 times, which means that a breakout is imminent
The low drop to just the 32,8 fib shows the strength of the upward trend.
9/12/25 - $rgti - Shorting w/ size9/12/25 :: VROCKSTAR :: NASDAQ:RGTI
Shorting w/ size
- as i prepare for the (inevitable?) pullback in the coming weeks
- i look for vapor that's riding on the horse of hope and dreams where we're all apparently going to candy mountain
- and look no further than a stock that management doesn't even want to hold
- ionq can't produce it's own revenues, so it just acquires stuff at your expense. then the "industry" (can we call it that if it doesn't produce anything?) rides on the leader's beta
- enjoy the ride, whichever way you're rolling
- but just know. you're rolling. actually rolling. and eventually the machine elves will show up and collect the toll under the bridge where you shouldn't be collecting coins.
V

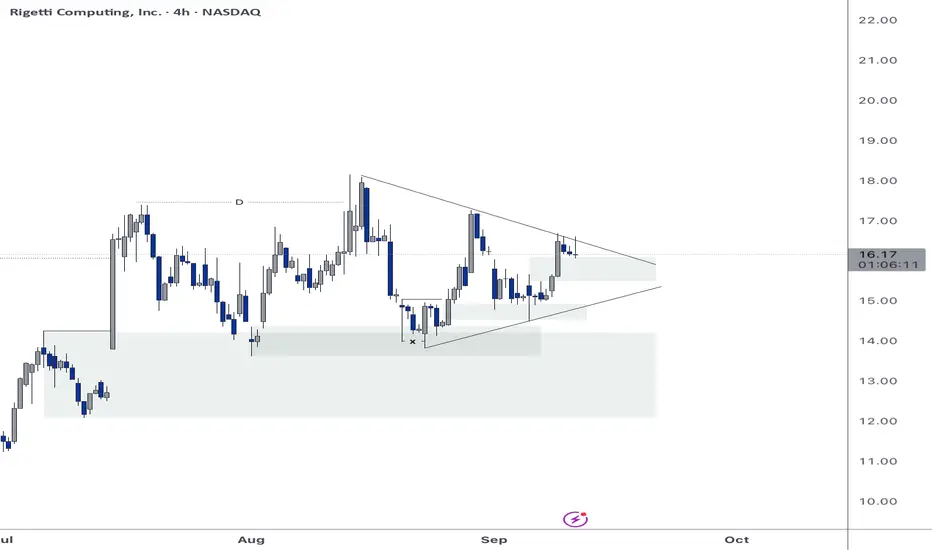
RGTI | Triangle Setup Looks ExplosiveQuick Thesis: RGTI is tightening inside a clean triangle — looks like it’s setting up for a decisive move.
Chart Context: Price has been squeezing between ~$15 support and ~$17 resistance, with higher lows building pressure against that upper trendline.
Big Picture / Catalyst Watch: Quantum computing names have been catching speculative interest lately, and RGTI’s setup looks ripe for a volatility event. A breakout could align with any sector news, earnings, or tech headlines.
Triangle ABCDE FormationAbout to finish the ABCDE Correction phase with probable outbreak upwards of the triangle. First target around 18,5
second target AH ~ 21
third target Moon
beware: speculative
RGTI - let's gambleHigh risk RGTI gamble with good 4:1 ratio. Not sure why TW is forcing me to write more to publish this degen gamble.

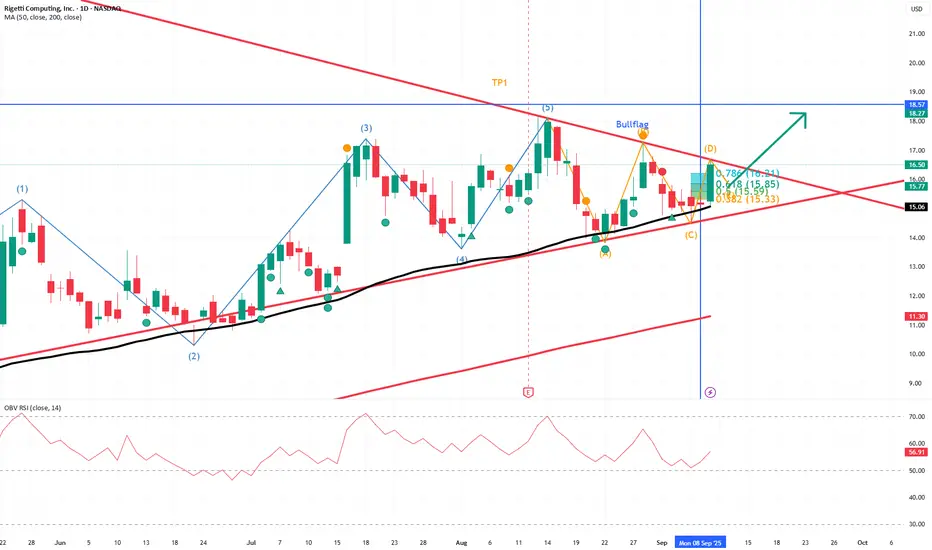
ABC Correction done?Looks like we completed 5 waves and a ABC bullflag correction phase.
This might result in a wave 1 breakout out of the bullflag soon.
If wave 1 is as strong as the last impulsive move, we might see 24 usd+

9/2/25 - $rgti - Here's where u short it... again9/2/25 :: VROCKSTAR :: NASDAQ:RGTI
Here's where u short it... again
- co says they are giving some of their warez to a uni for research
- market says "cool let's send this up $500 mm mcap"
- guys, this chart is breaking down and i'm not even a technician
- when the liquidity toilet bowl gets flushed
- this stinky one is going to the bowels of the waste treatment plant
- i think i'm supposed to provide some "fundamental" analysis here.
- how about this - over 100x sales on "analyst" estimates for monster growth in 2026 and where ebitda margins are still negative until... 2028? 2029? sure, go ahead. first time. careful, tho
- yeah i'm short again and also all these other qwandum bags of urs
V

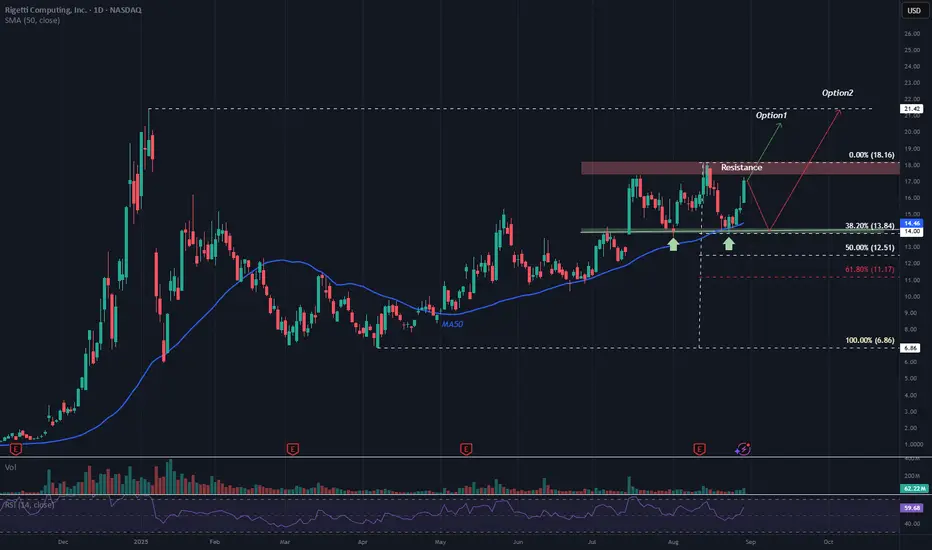
$RGTI Trading Range with Potential Breakout or PullbackThe stock is currently trading within a healthy horizontal range, with support around the $13.80 area (considered a buy zone) and resistance between $17.50 and $18.00 (potential sell zone).
From this point, two scenarios are possible:
Pullback Scenario: A reversal toward the support zone, potentially aligning with the rising 50-day moving average.
Breakout Scenario: A continuation of the upward move, breaking through resistance and heading toward the previous peak at $21.00.
This is a technical perspective and not a recommendation to buy or sell.
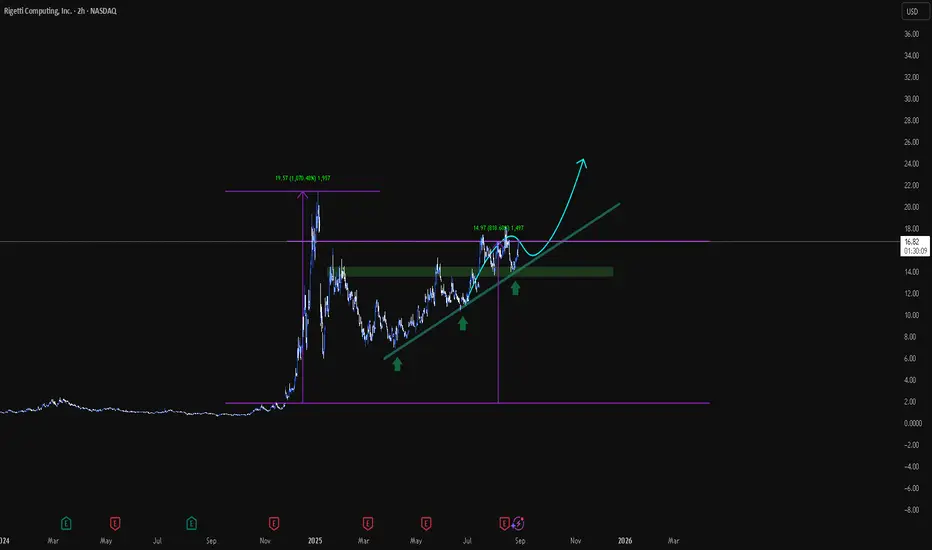
Rigetti | Technical analysis. 2H.This stock price performance is so crazy...
The price still looks like it's going to reach the previous highest mark first.
Rgti High potentialSomehow, I keep hanging up here for the highest potential in this field, especially the zone it in will start accumulating under 20 fingers crossed y’all

RGTI Swings Thesis
Quantum sector trades on hype. Companies like Rigetti (still pre-commercial, burning cash) and D-Wave (more advanced) move in the same patterns. Market treats all projects alike at this stage, similar to early crypto. Sorting by real business models comes later. For now, price action is driven by sector sentiment.
Market Context
Overlapping trend legs, repeated retests of highs/lows → typical of uncertain macro (war, AI bubble risk, Fed rates, tariffs).
Price often consolidates in triangle ranges before new legs start.
This environment favors short swing plays at range bottoms and tops.
Current Setup
Broad market sell-off pushed RGTI down, no direct negative news.
Current leg bottom tested around 14.25.
Targeting rebound toward 15.50–16.00, stretch goal 17.00.
Highly speculative short-term trade, holding just a few days.
Positioning
Long calls opened:
Strike 14 @ 1.38 (exp. Sept 19)
Strike 13 @ 1.55 (exp. Aug 29)
Plan
Entry near 14.25.
Profit-taking levels: 15.50 / 16.00 / 17.00 depending on risk appetite.
Clear stop if breakdown below recent support.

RGTI - Rigetti Computing - Where are we? 20.00 Soon?Hello Everyone,
This is the last one for Today.
You can see my previous analysis here:
So where are we now?
It got support from 50 SMA this level is also our first support level and if this level is broken we can unfortunately see the 11.xx price levels.
My expectations is that it will stay in Trend channel and our direction is Up for next week.
Resistance levels : 16.30 - 16.40
Support level : 14.15
As i mentioned in my FLS analysis , RGTI is also making higher Lowers and Higher Highers , this confirms that we are in UP trend, and i beleive that it is a good opportunity for next week.
And as i said in IONQ analysis too, i am inveting for Future in Quantum computing stocks therefore i am not interesting fluctuations but of course i try to increase my positions in a good price levels.
This is just my thinking and it is not invesment suggestion , please do not make any decision with my anaylsis.
Have a lovely Sunday to all.

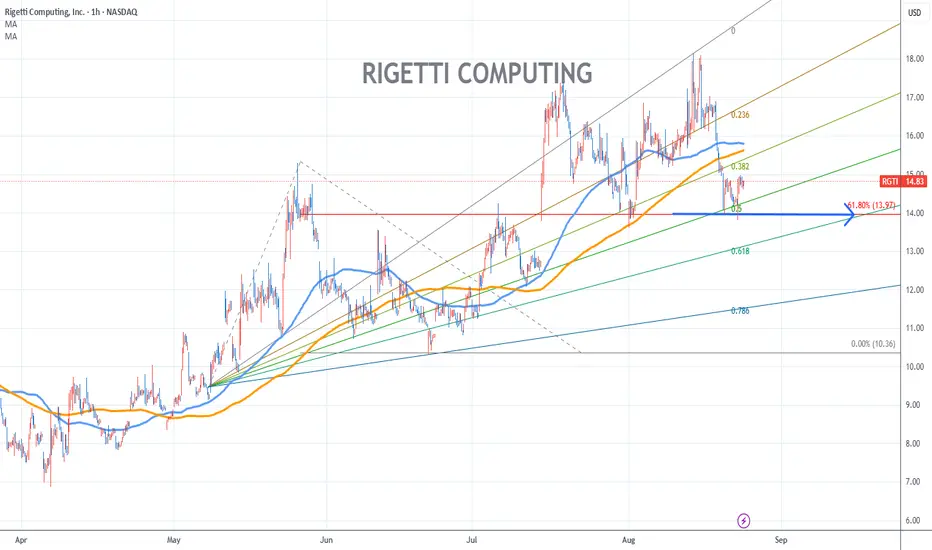
Riggeti Computing Stock Chart Fibonacci Analysis 082225Trading Idea
1) Find a FIBO slingshot
2) Check FIBO 61.80% level
3) Entry Point > 14/61.80%
Chart time frame:B
A) 15 min(1W-3M)
B) 1 hr(3M-6M)
C) 4 hr(6M-1year)
D) 1 day(1-3years)
Stock progress:A
A) Keep rising over 61.80% resistance
B) 61.80% resistance
C) 61.80% support
D) Hit the bottom
E) Hit the top
Stocks rise as they rise from support and fall from resistance. Our goal is to find a low support point and enter. It can be referred to as buying at the pullback point. The pullback point can be found with a Fibonacci extension of 61.80%. This is a step to find entry level. 1) Find a triangle (Fibonacci Speed Fan Line) that connects the high (resistance) and low (support) points of the stock in progress, where it is continuously expressed as a Slingshot, 2) and create a Fibonacci extension level for the first rising wave from the start point of slingshot pattern.
When the current price goes over 61.80% level , that can be a good entry point, especially if the SMA 100 and 200 curves are gathered together at 61.80%, it is a very good entry point.
As a great help, tradingview provides these Fibonacci speed fan lines and extension levels with ease. So if you use the Fibonacci fan line, the extension level, and the SMA 100/200 curve well, you can find an entry point for the stock market. At least you have to enter at this low point to avoid trading failure, and if you are skilled at entering this low point, with fibonacci6180 technique, your reading skill to chart will be greatly improved.
If you want to do day trading, please set the time frame to 5 minutes or 15 minutes, and you will see many of the low point of rising stocks.
If you want to prefer long term range trading, you can set the time frame to 1 hr or 1 day
The Next Jump?The chart of an asset with two strong support levels suggests we are in an ideal position for further upward movement.
Technical characteristics:
✅ MA50 Support: The price is consistently trading above the 50-period moving average, acting as dynamic support
✅ Bollinger Band Bottom Test: Having touched the lower band, a technical bounce is likely
🎯 Target Zone: The $19 level as the next significant resistance
This combination creates a strong technical foundation for a potential new upward wave.

My Bookie Doesn’t Offer Qubit Parlays My Bookie Doesn’t Offer Qubit Parlays. So I went to my interactive broker.
Rigetti Computing (RGTI) reports earnings today after market close. While fundamentals may be stretched, quantum computing remains one of the hottest tech narratives right now.
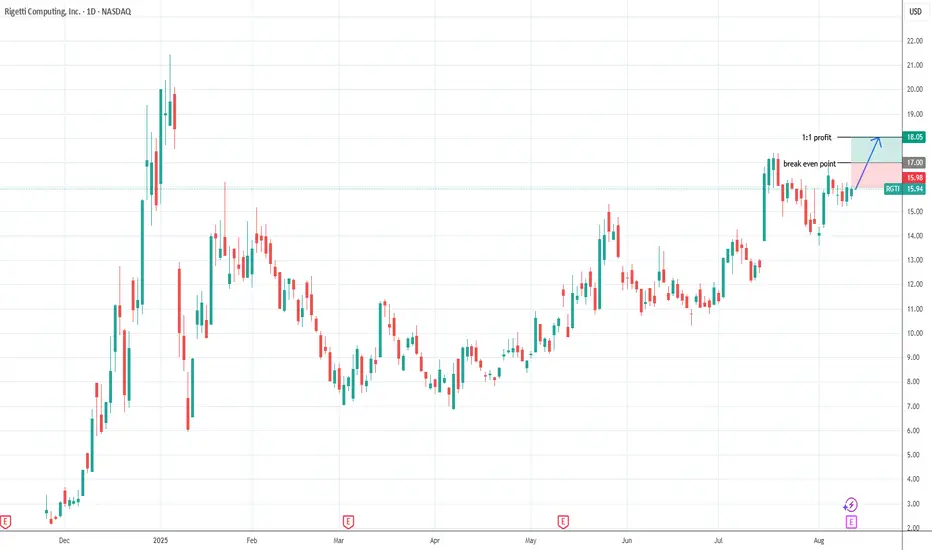
Trade Setup:
Option Type: Call
Strike Price: $16
Expiry: Aug 15, 2025
Reasoning: If earnings come in at least neutral, momentum + sector hype could push the stock to $18+ within 3 days, delivering ~100 USD profit per option.
Catalyst: Earnings report + strong sentiment in quantum computing space.
Risk:
If earnings disappoint or sentiment fades, price could drop quickly; options are highly leveraged and expire soon.