REL Inds : Buy Triggered on Friday REL Inds: Buy triggered on Friday 17th Oct 2025.
Be mindful of a major Red Band Resistance Level as displayed on the chart.
( Not a Buy / Sell Recommendation
Do your own due diligence ,Market is subject to risks, This is my own view and for learning only .)
Trade ideas

Reliance Industries Ltd for 16th Oct #RELIANCEReliance Industries Ltd for 16th Oct #RELIANCE
Resistance 1390 Watching above 1393 for upside momentum.
Support area 1365 Below 1380 gnoring upside momentum for intraday
Watching below 1364 for downside movement...
Above 1380 ignoring downside move for intraday
Charts for Educational purposes only.
Please follow strict stop loss and risk reward if you follow the level.
Thanks,
V Trade Point

Reliance Industries Ltd for 17th Oct #RELIANCEReliance Industries Ltd for 17th Oct #RELIANCE
Resistance 1400 Watching above 1404 for upside momentum.
Support area 1380 Below 1380 gnoring upside momentum for intraday
Watching below 1377 for downside movement...
Above 1400 ignoring downside move for intraday
Charts for Educational purposes only.
Please follow strict stop loss and risk reward if you follow the level.
Thanks,
V Trade Point

Reliance Industries Ltd for 15th Oct #RELIANCEReliance Industries Ltd for 15th Oct #RELIANCE
Resistance 1390 Watching above 1393 for upside momentum.
Support area 1365 Below 1380 gnoring upside momentum for intraday
Watching below 1364 for downside movement...
Above 1380 ignoring downside move for intraday
Charts for Educational purposes only.
Please follow strict stop loss and risk reward if you follow the level.
Thanks,
V Trade Point

Reliance !! Breaking out !!Reliance, a fresh Breakout can be seen in next trading days. Let's see how it works.

Reliance Industries Ltd for 14th Oct #RELIANCEReliance Industries Ltd for 14th Oct #RELIANCE
Resistance 1390 Watching above 1393 for upside momentum.
Support area 1365 Below 1380 gnoring upside momentum for intraday
Watching below 1364 for downside movement...
Above 1380 ignoring downside move for intraday
Charts for Educational purposes only.
Please follow strict stop loss and risk reward if you follow the level.
Thanks,
V Trade Point

Reliance Industries Ltd for 13th Oct #RELIANCE Reliance Industries Ltd for 13th Oct #RELIANCE
Resistance 1390 Watching above 1393 for upside momentum.
Support area 1365 Below 1380 gnoring upside momentum for intraday
Watching below 1364 for downside movement...
Above 1380 ignoring downside move for intraday
Charts for Educational purposes only.
Please follow strict stop loss and risk reward if you follow the level.
Thanks,
V Trade Point

Reliance Industries Ltd for 7th Oct #RELIANCE Reliance Industries Ltd for 7th Oct #RELIANCE
Resistance 1380-1383 Watching above 1384 for upside momentum.
Support area 1365 Below 1365 gnoring upside momentum for intraday
Watching below 1364 for downside movement...
Above 1380 ignoring downside move for intraday
Charts for Educational purposes only.
Please follow strict stop loss and risk reward if you follow the level.
Thanks,
V Trade Point

Will Ril help Nifty upmove - we shall see Reliance Industries Limited (RIL) – Technical Editorial Note
Reliance Industries Limited (RIL), India’s largest company by market capitalization, remains a heavyweight on the NSE, shaping investor sentiment with its diversified businesses across petrochemicals, telecom, retail, and energy transition plans.
🔹 Technical Outlook
Chart Structure: The weekly chart indicates the formation of a 5-wave Elliott structure, with Wave 2 retracement finding support near the 200-week EMA. This signals a potential Wave 3 advance, typically the strongest leg in Elliott theory.
Key Levels:
Immediate Support: ₹1,370–1,380 zone (aligned with 50 & 200 EMA cluster).
Breakout Zone: ₹1,500 – a sustained close above this could trigger bullish momentum.
Upside Targets: ₹1,650–1,700 (Wave 3), extending to ₹1,900–2,000 (Wave 5 projection).
Downside Risk: A breakdown below ₹1,350 may delay the bullish structure, opening retests toward ₹1,250.
Indicators:
Moving Averages: Price is consolidating above the 200 EMA, a long-term bullish sign.
Volume Profile: Accumulation seen in the ₹1,350–1,400 zone, suggesting strong institutional support.
Momentum: RSI is stabilizing near the mid-50s, leaving ample room for an upside breakout.

Central Bank Policies and Inflation1. Introduction
Inflation—commonly defined as the sustained rise in the general price level of goods and services in an economy—remains one of the most pressing economic challenges across the world. A moderate level of inflation is often associated with healthy economic activity, signaling demand growth and investment. However, when inflation accelerates beyond control, it erodes purchasing power, destabilizes savings, and threatens long-term economic stability. Conversely, excessively low inflation or deflation can discourage spending, stall investment, and push economies into stagnation.
The primary institution responsible for managing inflation in most economies is the central bank. Whether it is the U.S. Federal Reserve (Fed), the European Central Bank (ECB), the Reserve Bank of India (RBI), or the Bank of Japan (BoJ), central banks employ a range of monetary policies to influence inflation levels. By adjusting interest rates, regulating money supply, and using innovative tools such as quantitative easing (QE), central banks attempt to strike a delicate balance between promoting growth and maintaining price stability.
This essay explores the intricate relationship between central bank policies and inflation, providing a comprehensive understanding of how monetary tools shape inflation dynamics, supported by real-world examples and critical perspectives.
2. Understanding Inflation
Before analyzing central bank policies, it is essential to grasp the different dimensions of inflation.
2.1 Definition and Measurement
Inflation is typically measured through price indices such as:
Consumer Price Index (CPI): Reflects the average change in prices of a basket of goods and services consumed by households.
Wholesale Price Index (WPI): Captures price changes at the wholesale/trading level.
GDP Deflator: Measures inflation across the entire economy by comparing nominal and real GDP.
2.2 Types of Inflation
Demand-Pull Inflation: Arises when aggregate demand surpasses aggregate supply. For example, during economic booms, rising consumer spending and investment can push prices upward.
Cost-Push Inflation: Occurs when production costs (wages, raw materials, energy prices) increase, compelling firms to raise prices.
Built-In Inflation: Also known as wage-price spiral, where rising wages push prices higher, leading to further wage demands.
2.3 Desired vs. Undesired Inflation
Most central banks target a moderate inflation rate (around 2% annually in developed economies, and 4–6% in developing economies). Controlled inflation encourages spending and investment, but hyperinflation (e.g., Zimbabwe in the 2000s, Venezuela recently) or deflation (e.g., Japan in the 1990s) can destabilize the economy.
3. Central Banks: Role and Objectives
Central banks are independent monetary authorities tasked with ensuring macroeconomic stability. Their primary objectives often include:
Price Stability: Maintaining inflation within a target range.
Economic Growth: Supporting sustainable GDP growth.
Employment: Striving toward full employment levels.
Financial Stability: Preventing banking crises and asset bubbles.
Exchange Rate Stability: Particularly in emerging economies with volatile currencies.
The degree of emphasis on each goal varies. For example, the Fed follows a “dual mandate” (inflation and employment), whereas the ECB’s top priority is inflation control.
4. Key Central Bank Policies Against Inflation
4.1 Monetary Policy Frameworks
Central banks use two broad categories of monetary policy:
Contractionary Policy (Tightening): Aimed at reducing inflation by restricting money supply and raising borrowing costs.
Expansionary Policy (Easing): Aimed at combating deflation or recession by lowering interest rates and expanding liquidity.
4.2 Tools of Monetary Policy
Policy Interest Rates
Repo Rate / Federal Funds Rate: Central banks increase benchmark interest rates to discourage borrowing and cool demand, thereby reducing inflationary pressures.
Example: RBI raised the repo rate several times in 2022–23 to counter high inflation caused by supply shocks and global commodity prices.
Open Market Operations (OMO)
Central banks buy or sell government securities to adjust liquidity. Selling securities withdraws money from the system, curbing inflation.
Reserve Requirements
Cash Reserve Ratio (CRR) / Reserve Requirement Ratio (RRR): Higher reserve requirements reduce the lending capacity of banks, lowering money supply and inflation.
Quantitative Tightening (QT) and Quantitative Easing (QE)
QE involves purchasing financial assets to inject liquidity (used in 2008 global crisis), whereas QT withdraws liquidity. Both influence inflation indirectly through credit conditions.
Forward Guidance
By signaling future policy intentions, central banks influence expectations, which are crucial in inflation dynamics. For instance, the Fed’s consistent communication about rate hikes shapes investor and consumer behavior.
Currency Intervention
Central banks may intervene in foreign exchange markets to stabilize the currency, as depreciation often fuels imported inflation.
4.3 Inflation Targeting
Many modern central banks adopt an explicit inflation-targeting framework. For example:
The Fed: 2% average inflation target.
RBI: 4% ± 2% flexible target under its Monetary Policy Committee (MPC).
Bank of England: 2% CPI target.
This approach enhances transparency, credibility, and accountability.
5. Case Studies: Global Perspectives
5.1 The U.S. Federal Reserve
During the 1970s stagflation, the Fed under Paul Volcker raised interest rates dramatically (up to 20%) to curb double-digit inflation. Though painful, it restored long-term price stability.
More recently, in response to pandemic-induced inflation (2021–2023), the Fed adopted aggressive tightening, lifting rates from near zero to above 5%.
5.2 European Central Bank (ECB)
The ECB has struggled with low inflation and deflation risks, especially after the 2008 crisis and Eurozone debt crisis. However, in 2022–2023, it raised rates aggressively to counter record inflation driven by energy shocks.
5.3 Reserve Bank of India (RBI)
India’s inflation has often been driven by food and fuel prices. The RBI balances inflation control with growth, raising repo rates during inflationary periods while providing liquidity support during downturns (e.g., COVID-19 pandemic).
5.4 Bank of Japan (BoJ)
Japan’s unique struggle has been deflation, not inflation. For decades, the BoJ pursued ultra-loose policies, including negative interest rates and large-scale asset purchases, to generate moderate inflation.
5.5 Emerging Markets
Countries like Turkey illustrate challenges when central banks fail to maintain independence. Political interference led to excessively low interest rates despite high inflation, resulting in currency collapse and runaway prices.
6. Challenges and Criticisms
Time Lags
Monetary policy takes time (6–18 months) to affect inflation, complicating decision-making.
Supply-Side Shocks
Central banks have limited power over supply-driven inflation (e.g., oil price spikes, war, climate disruptions).
Globalization and External Factors
Inflation is increasingly influenced by global supply chains, making domestic monetary tools less effective.
Financial Stability Risks
Aggressive tightening can trigger recessions, credit crunches, or market crashes.
Credibility and Independence
Political pressures undermine central bank autonomy, reducing the effectiveness of inflation control.
Inequality Concerns
High interest rates disproportionately affect borrowers and small businesses, raising debates on fairness.
7. Future Outlook
The landscape of central banking is evolving:
Digital Currencies: Central Bank Digital Currencies (CBDCs) may alter money supply management.
Climate Risks: Rising energy and food inflation linked to climate change could challenge traditional policies.
Artificial Intelligence & Data Analytics: Advanced forecasting models may improve inflation targeting.
Coordination with Fiscal Policy: Joint efforts with governments will be necessary for structural inflationary issues.
8. Conclusion
Inflation control remains one of the most delicate balancing acts in economics. Central banks, through a wide array of policies—ranging from interest rate adjustments to open market operations and forward guidance—play a pivotal role in shaping inflation trajectories. Success stories, like the Fed’s victory over 1970s stagflation, highlight the effectiveness of decisive action, while failures, like Turkey’s recent crisis, underscore the dangers of compromised independence.
Yet, the complexity of modern economies means central banks face growing challenges: globalization, technological disruption, climate risks, and political pressures. While monetary policy will remain the primary defense against inflation, its effectiveness will increasingly depend on coordination with fiscal measures, structural reforms, and global cooperation.
Ultimately, central bank policies are not about eliminating inflation entirely but ensuring it remains within a stable, predictable range that fosters investment, employment, and long-term prosperity.

Reliance Industries Ltd for 18th Sept #RELIANCE Reliance Industries Ltd for 18th Sept #RELIANCE
Resistance 1420 Watching above 1422 for upside momentum.
Support area 1400 Below 1400 gnoring upside momentum for intraday
Watching below 1397 for downside movement...
Above 1420 ignoring downside move for intraday
Charts for Educational purposes only.
Please follow strict stop loss and risk reward if you follow the level.
Thanks,
V Trade Point

RELIANCE 1D Time frame Reliance Industries (RELIANCE)
Current Price: ₹1,380.10
Change: +0.28% from the previous close
Intraday Range: ₹1,375.50 – ₹1,381.20
Volume: 9,753,126 shares traded
Market Cap: ₹18.67 trillion
P/E Ratio: 25.10
EPS (TTM): ₹60.23
Dividend Yield: 0.40%
Beta: 0.88 (indicating lower volatility relative to the market)
🔎 Key Levels
Resistance:
R1: ₹1,385.00 (recent high)
R2: ₹1,400.00 (psychological level)
R3: ₹1,420.00 (next resistance zone)
Support:
S1: ₹1,375.50 (immediate support)
S2: ₹1,360.00 (next support level)
S3: ₹1,350.00 (longer-term support)
📈 Technical Indicators
RSI (14): 58.21 — Neutral to slightly bullish
MACD: 2.15 — Positive momentum
Moving Averages:
5-day SMA: ₹1,373.00 — Buy signal
50-day SMA: ₹1,350.00 — Buy signal
200-day SMA: ₹1,300.00 — Buy signal
Stochastic Oscillator: 75.00 — Overbought, indicating potential for a pullback
📌 Market Sentiment
Catalysts: Positive momentum following recent gains and analyst upgrades.
Sector Performance: Oil & Gas sector showing strength, with Reliance leading gains among peers.
Options Activity: Significant trading in call options at ₹1,400 strike price, indicating bullish sentiment.
📅 Outlook
Bullish Scenario: A breakout above ₹1,385.00 could lead to a push toward ₹1,400.00 and higher.
Bearish Scenario: A drop below ₹1,375.50 may test support around ₹1,360.00.
Overall Bias: Moderately bullish, with positive momentum but facing near-term resistance.

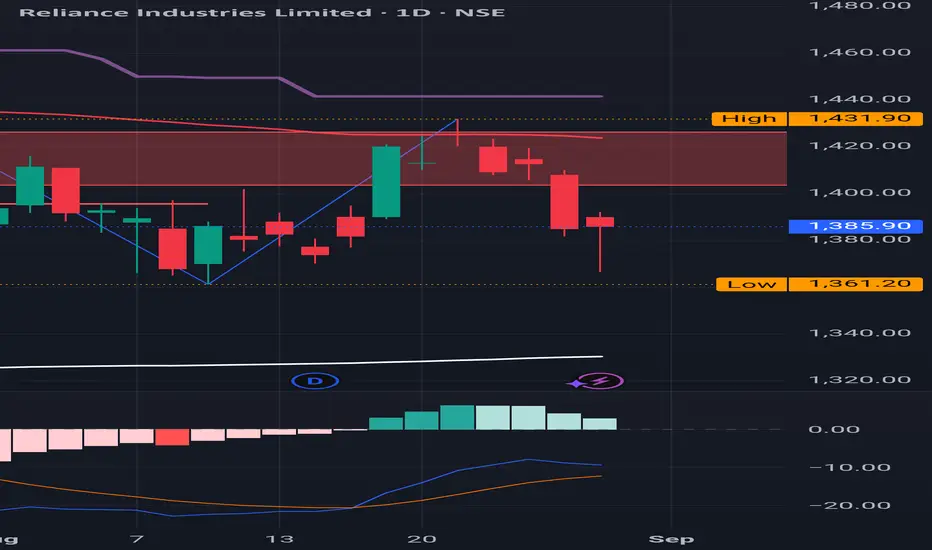
Reliance short term viewReliance has recently taken support at the lower edge of its falling wedge formation and is now trading close to the upper boundary of this pattern. Over the last 5 sessions, the price action has been compressed within an inside candle formation, signaling contraction in volatility and a possible breakout setup.
Support Zone: ₹1350 (key wedge support and near-term demand zone)
Trigger Level: A sustained move above ₹1385 will confirm strength and indicate breakout potential.
Upside Targets: On confirmation, the stock can head towards ₹1430 initially, followed by ₹1470 in the short term.
Risk Level: A close below ₹1350 would negate the bullish setup and can lead to further weakness.
Technical View:
The combination of a wedge support bounce + multiple inside candles suggests a volatility squeeze. Break above 1385 with volume could accelerate momentum


Reliance bullish rsi divergence Motabhai after beautiful up rally gave healthy correction ..now its time to conquer the recent high .. typical w pattern formation der . First Target 1420 ..day close above 1420 new journey start ..

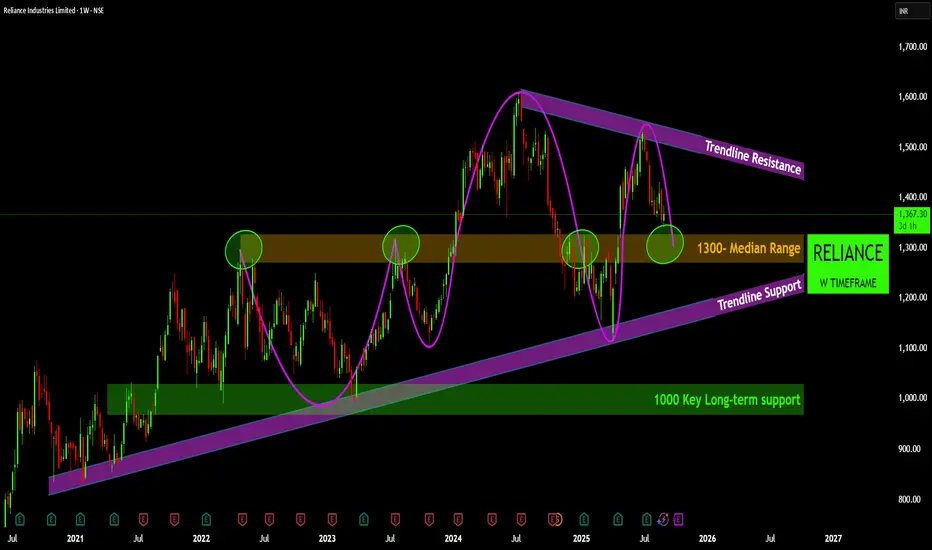
RELIANCE: 1300 Median – A Weekly Pivot PointRELIANCE: 1300 Median – A Weekly Pivot Point
Reliance is exhibiting price action within a broad ascending channel, bordered by a clear Trendline Resistance and Trendline Support on the weekly chart.
The 1300- Median Range acts as a significant pivot point, with the stock repeatedly finding support or resistance at this level.
The price has recently bounced from the ascending Trendline Support, indicating sustained buying interest at lower levels within the channel.
A decisive break above the Trendline Resistance would signal further bullish momentum, while a failure to hold the Trendline Support could lead to a test of the 1000 Key Long-term support zone.
Disclaimer
The information provided in this chart and accompanying analysis is for educational and informational purposes only. It does not constitute investment advice, recommendations, or an offer to buy or sell any financial instrument.
Important: I am not a SEBI registered Investment Adviser or Research Analyst. The views expressed herein are purely personal observations for educational purposes and should not be construed as professional financial guidance.
Trading and investing in financial markets involve substantial risk, including the potential loss of principal, and are not suitable for every investor. You should carefully consider your financial situation, risk tolerance, and investment objectives, and consult with a qualified, SEBI registered financial advisor before making any investment decisions.
The creator of this chart does not guarantee any specific outcome, profit, or loss, and is not responsible for any direct or indirect losses incurred as a result of using this information. Past performance is not indicative of future results.
This chart has been created for my own personal improvement in Trading and Investment Analysis. Always conduct your own thorough analysis and due diligence before making any investment or trading decisions. Use this information at your own risk.
Head and shoulder pattern in Nifty stock Reliance Industries Ltd also making a bearish head and shoulder pattern, stoploss at right shoulder high can achieve 1:3 risk reward.
Not liable for any profit or loss
This channel post everything for educational purpose, I am not a sebi registered analyst do your own research before any trade.
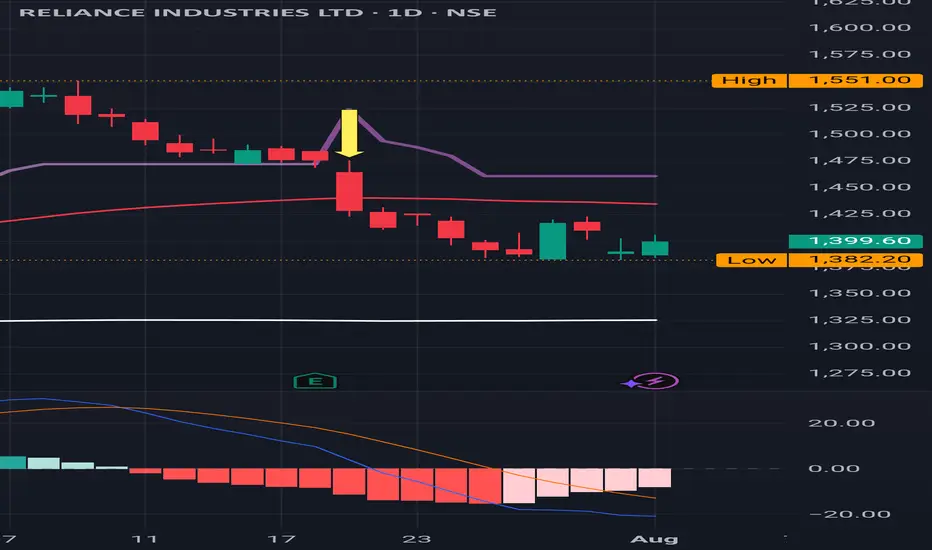
REL : After breaching 1400 level ,1360 is a new support REL : After breaching 1400 level ,1360 has become an important support level to watch out for.
Major Red band Resistance has developed from 1400 to 1431 as visible in the Chart.
( Not a Buy / Sell Recommendation
Do your own due diligence ,Market is subject to risks, This is my own view and for learning only .)
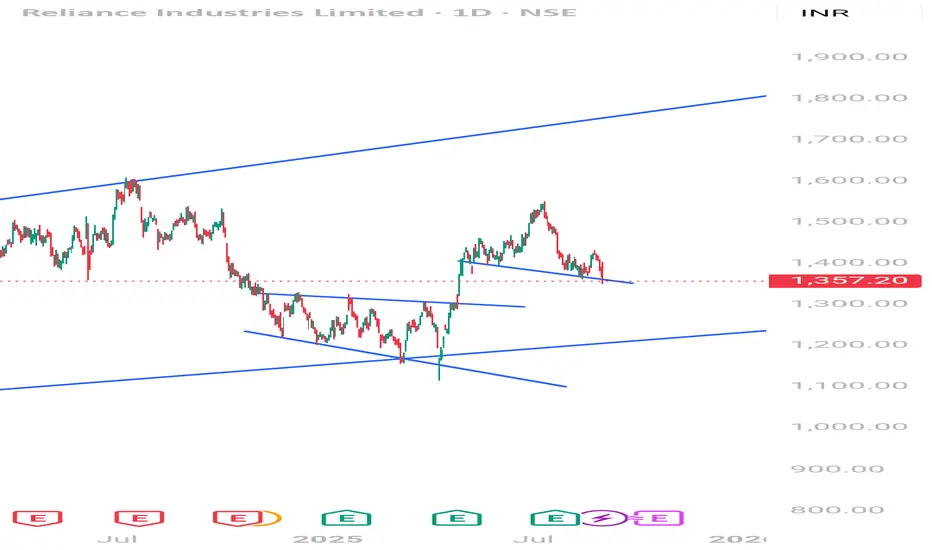
reliance pull back retest done after crossing 50% of channel , now prise did come for pull back and retesh its 50% area , againg it is in bullish zone now

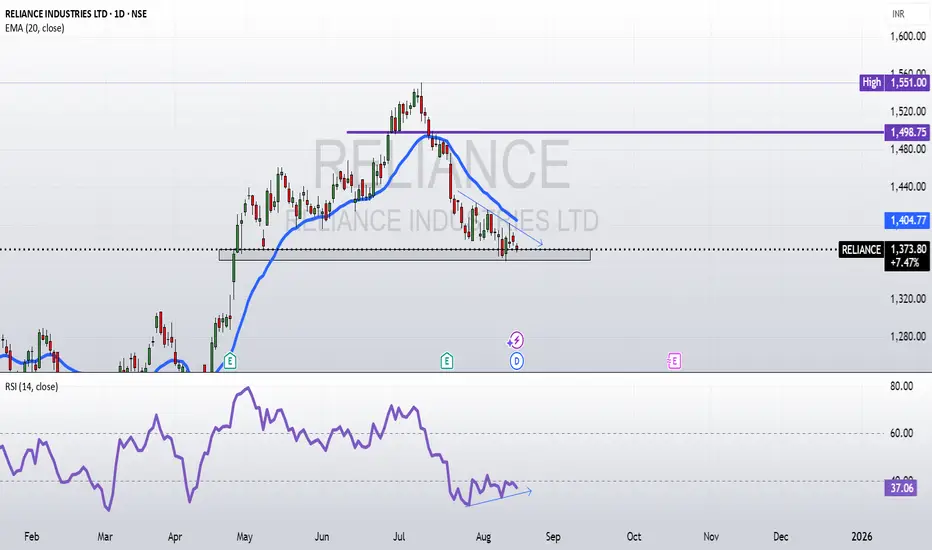
Using RSI tool to measure sentiment of price.there is bullish divergence you see on the chart with respect to RSI. and EMA20 acts a resistance/support in the daily timeframe.
Breakout: 1400
Target 1: 1426
Target 2: 1460
Target 3: 1498
Disclaimer:
I am NOT a SEBI registered advisor nor a financial advisor.
Any investments or trades I discuss on my blog are intended solely for educational purposes and do not represent specific financial, trading, or investment advice.
Disclosure:
I, the author of this report, and my immediate family members do not have any financial interest or beneficial ownership in the securities mentioned herein at the time of publication.
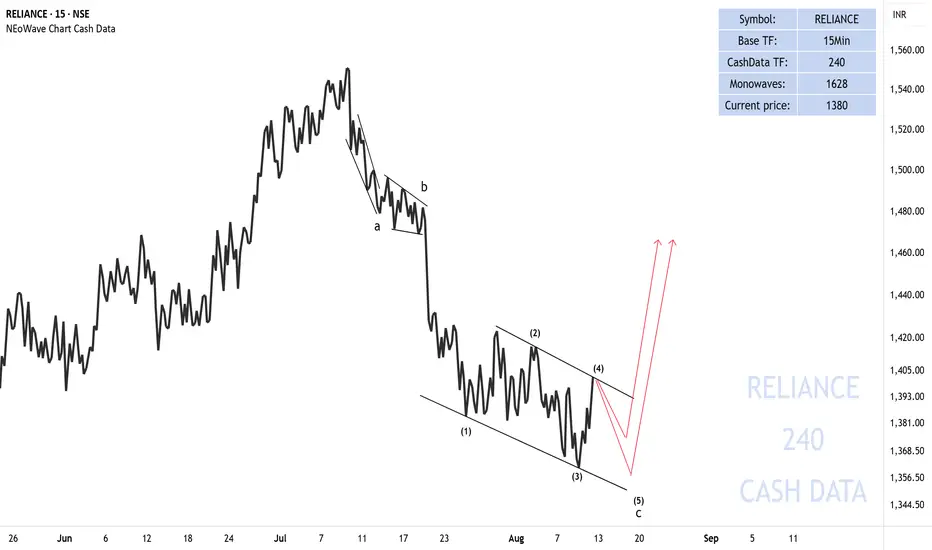
RELIANCE in 15m TimeframeI think an elongated zigzag is forming, we are in wave 5 of c and after that the price could make an upward move.
This scenario will be violated if the price crosses 1332.
Good luck
NEoWave Chart
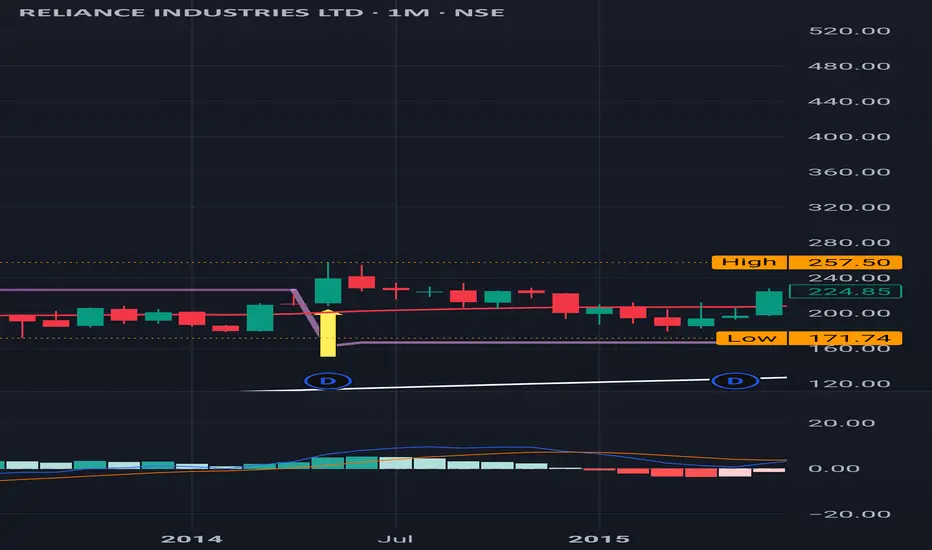
Reliance : A brilliant Journey from May 2014 from 200Reliance : A brilliant Journey from May 2014 from the price level of 200 to until now
It has never been a Sell on a monthly time frame since then.
Even during the Covid time in March 2020 it ditched a Sell signal on a Monthly Time Frame.
It started it's run at around the price level of mere 200 ish in May 2014 and never looked back. Splits / Bonuses/ Dividends / Jio stocks options are all extras apart from the price actions.
It seems this is why it's known as MOTABHAI
( Not a Buy / Sell Recommendation
Do your own due diligence ,Market is subject to risks, This is my own view and for learning only .)
REL : Sitting at an important support level of 1400 ish.
REL : Sitting at an important support level of 1400 ish.
( Not a Buy / Sell Recommendation
Do your own due diligence ,Market is subject to risks, This is my own view and for learning only .)