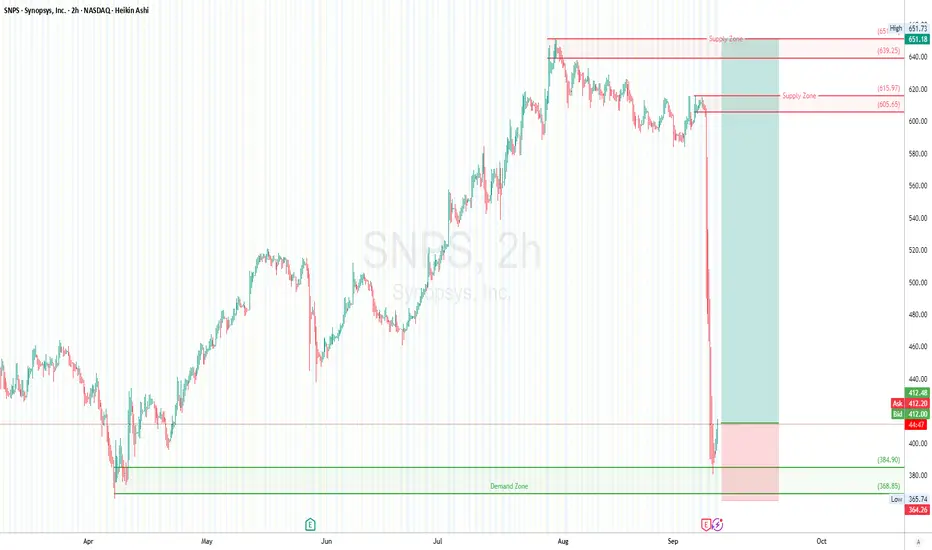
SNPS (Synopsys, Inc.) — 2H TF | Long Setup
SNPS (Synopsys) experienced a parabolic run into $651 ATH, followed by a brutal selloff wiping out nearly $250 in value in a matter of days. This sharp capitulation was after the earnings shock and news impact. However the company fundamental and historical growth still very healthy!
Currently, price is bouncing around $409–412, just above the major demand zone at $368–385. On the upside, clear supply zones sit at $605–616 and $639–651, which will act as hurdles for any recovery rally.
Likely linked to earnings or lowered forward guidance (Synopsys is a leader in EDA software, highly sensitive to semiconductor cycle).
Broader tech weakness and yield-driven selloff could have amplified losses.
🔀 Trend & Structure:
Primary Trend: Bullish (macro still intact from 2022 lows, but in deep correction)
Short-Term: Bearish momentum
Setup: Bounce from demand with potential retracement toward supply zones
🟩 Key Supply/Demand Zones:
Demand Zone (Buy Area): $368 – $385
Supply Zones (Sell Areas):
$605 – $616
$639 – $651
🎯 Trade Setup (Swing Long Reversal Play):
Entry: $412–415 (current levels)
Stop Loss: $364 (below demand invalidation)
Take Profit 1: $605
Take Profit 2: $639
Risk/Reward: ~4.9R to TP1
Max Risk: 1–2% of capital only (high volatility stock)
🧭 Trade Management:
Move SL → BE once $490 is cleared
Scale partial at $550, hold runner to $605+
If $605 supply breaks, $639–651 retest possible
“Volatility is the price you pay for opportunity.”
⚠️ Disclaimer:
This is not financial advice. SNPS is in a high-risk post-earnings selloff setup. Only attempt this trade with tight risk management.
#SNPS #Synopsys #TechStocks #SupplyAndDemand #SwingTrade #ReversalSetup #RiskReward #TradingView
SYP trade ideas
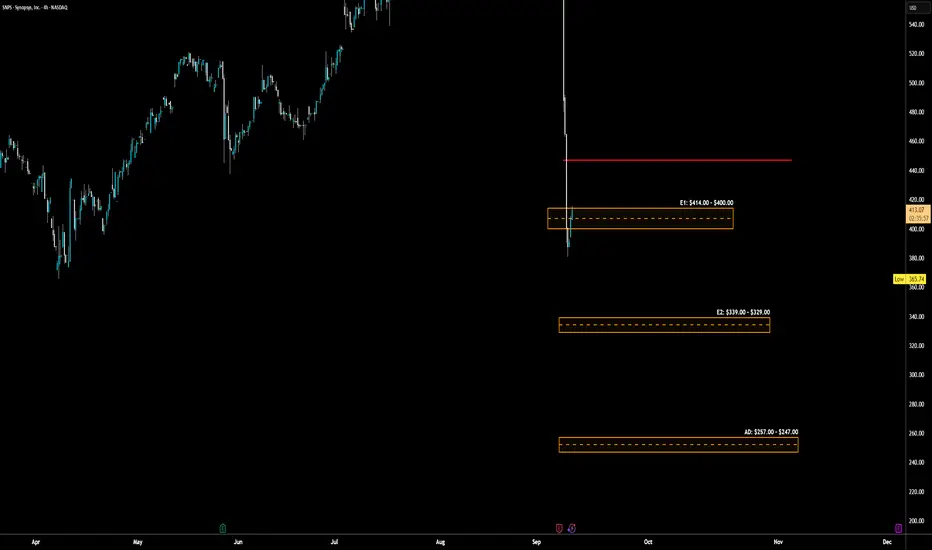
SNPS - LONG Swing Entry PlanNASDAQ:SNPS - LONG Swing Entry Plan
E1: $414.00 – $400.00
→ Open initial position targeting +8% from entry level.
E2: $339.00 – $329.00
→ If price dips further, average down with a second equal-sized entry.
→ New target becomes +8% from the average of Entry 1 and Entry 2.
AD: $257.00 – $247.00
→ If reached, enter with double the initial size to lower the overall cost basis.
→ Profit target remains +8% from the new average across all three entries.
Risk Management:
Stop Loss:
Risk is capped at 12% below the average entry price (calculated across all executed positions including the Edit Zone).
Position Sizing Approach:
Entry 1: 1x
Entry 2: 1x
Edit Zone: 2x
→ Total exposure: 4x
→ Weighted average determines final TP and SL calculations.
______________________________________
Legal Disclaimer
The information provided in this content is intended for educational and informational purposes only and does not constitute financial, investment, or legal advice or recommendations of any kind. The provider of this content assumes no legal or financial responsibility for any investment decisions made based on this information. Users are strongly advised to conduct their own due diligence and consult with licensed financial advisors before making any financial or investment decisions.
Sharia Compliance Disclaimer: The provider makes no guarantees that the stocks or financial instruments mentioned herein comply with Islamic (Sharia) principles. It is the user’s responsibility to verify Sharia compliance, and consultation with a qualified Sharia advisor is strongly recommended before making any investment decisions
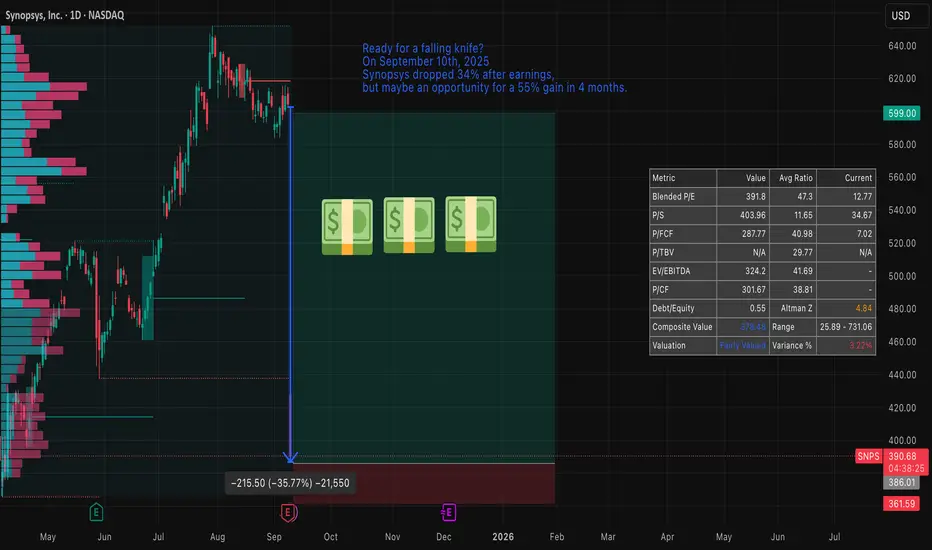
Synopsys — a sharp sell-off, risky entry and clear opportunitySynopsys plunged roughly 30–34% on 10 September 2025, wiping out a large chunk of market value after quarterly results missed expectations and guidance was cut. That kind of move often feels like a “falling knife”: attractive on paper, dangerous in practice.
Price action and technical context
The stock has gapped lower and left a sizeable down-gap to fill. From a technical viewpoint the setup resembles a fast, impulsive sell-off inside a broader downtrend established since the spring; price is now testing levels that were former support in April 2025. Short-term momentum indicators show oversold readings, but volatility is elevated and trend-following measures still favour the downside until a reliable base is formed.
Key technical reference points to watch:
Gap zone/topside resistance: around the pre-drop range near the mid-$600s.
Immediate support / stop placement: just below the April 2025 lows (your stated stop).
Possible gap-fill target: if the market rotates back, reclaiming the gap by January 2026 implies roughly a ~55% upside from current depressed levels (as you noted).
Fundamentals and why this remains an opportunity
Despite the headline shock, Synopsys’s underlying business remains high-quality:
Market-leading positions in EDA tools and IP libraries.
Strong, recurring revenue mix (software subscriptions and maintenance).
Long secular tailwinds from AI, advanced node design and chiplet modularity.
Valuation has re-rated materially after the drop — the company is no longer priced at the frothy multiples of earlier in the cycle. Analysts have revised estimates downward but many still target stock levels clustered around $600, reflecting belief in recovery by late 2025 / early 2026.
Options flow and timing
There is notable open interest concentration in both calls and puts around the $600 strike with expiries in December 2025 and January 2026. That concentration suggests the market expects meaningful activity/interest around that level into the winter and gives a window where a gap-fill or relief rally could materialize before January expiries.
Risk management and trade plan
Trade type: speculative rebound / gap-fill play, not a buy-and-forget investment.
Target: gap-fill / recovery toward pre-drop levels by January 2026 — roughly +55% potential from current depressed price (per your scenario).
Stop: just below April 2025 lows (limits downside if the downtrend resumes).
Position sizing: small relative to portfolio — treat as a high-volatility, event-driven trade.
Alternatives: consider defined-risk option structures (e.g., debit spreads) to cap downside while retaining upside exposure to a gap fill.
Catalysts to monitor
Any updates to guidance or profitability from Synopsys management.
China demand/FX developments and IP licensing commentary.
Options positioning into December 2025 / January 2026 expiries.
Broader semiconductor capital spending and AI-related design win announcements.
Technical indicators to watch
200DMA and April lows (support/resistance anchors).
RSI(14) and MACD for bullish divergence and momentum confirmation.
Volume on any recovery day — strong volume on up days increases odds of a sustained bounce.
Bottom line
This is a high-risk, high-reward setup: a classic “ falling knife ” that can be dangerous if you’re early, but presents a credible opportunity because Synopsys’s fundamentals remain solid, valuation is more attractive, and market positioning (options interest near $600) favors a potential recovery window through January 2026. Use tight risk controls (stop under April lows) and consider defined-risk option plays if you prefer limited downside.
Wyckoff Stage #4 Markdown?- NASDAQ:SNPS crashed on September 10, 2025 but I'm not interested in buying it yet.
- Fundamentally it had a premium valuation which has gotten little compressed but I think it deserves to be punished more.
- Monthly chart looks ugly and NASDAQ:SNPS is likely in a Wyckoff Stage #4
- Fundamentally,
year | 2025 | 2026 | 2027 | 2028
EPS | 13.72 | 15.35 | 18.27 | 22.76
EPS% | 4.54% | 11.92% | 19.00% | 24.59%
EPS is fluctuating from 4% to 24% in 2028. Considering average eps % to be 15%. Fair forward p/e would be 15 but I am willing to pay 20 forward p/e as the base case.
Fair value:
year | 2025 | 2026 | 2027 | 2028
EPS | 13.72 | 15.35 | 18.27 | 22.76
Price | $274 | $307 | $365 | $455
Bull Case ( forward p/e of 30 )
year | 2025 | 2026 | 2027 | 2028
EPS | 13.72 | 15.35 | 18.27 | 22.76
Price | $411 | $460 | $548 | $682
Bear Case ( forward p/e of 15 )
year | 2025 | 2026 | 2027 | 2028
EPS | 13.72 | 15.35 | 18.27 | 22.76
Price | $205 | $230 | $274 | $341

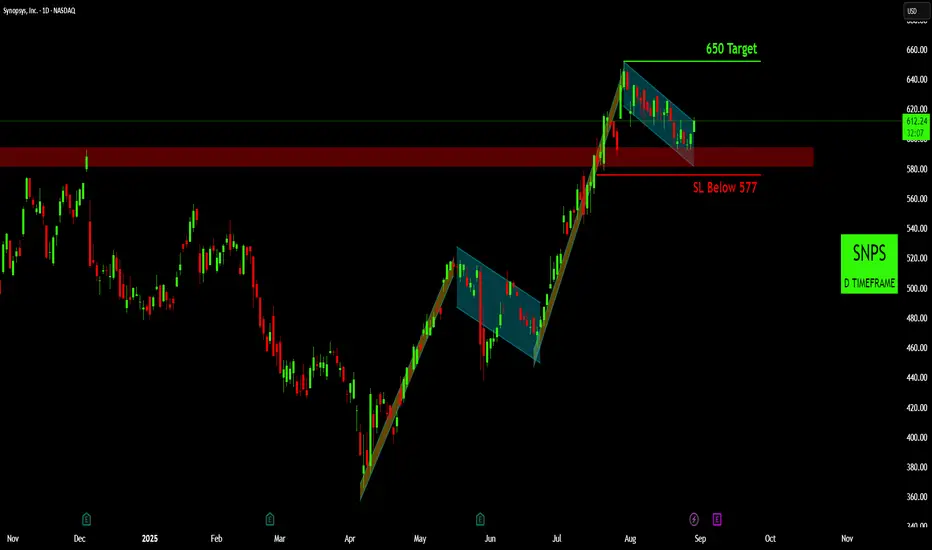
Synopsys (SNPS): Ready to Rally Again After a Brief Pause
Strong Climb, Then a "Breather" : SNPS has been going up very strongly since April. The Pattern clearly displays bull flag continuation patterns, with price consolidating in downward-sloping channels before breaking out to the upside.
Current Pause Ending: After its big jump in July, the stock entered another one of these "pauses," moving gently downwards in a channel. It stayed above a key support area, which is a good sign. Now, it looks like it's breaking out of this pause, suggesting the climb is about to resume.
Next Stop 650: If the stock continues its upward momentum, my next target for the price is 650.
Risk Management: To limit potential losses, I would exit the trade if the price falls below 577. This level acts as safety net.
Disclaimer:
The information provided in this chart is for educational and informational purposes only and should not be considered as investment advice. Trading and investing involve substantial risk and are not suitable for every investor. You should carefully consider your financial situation and consult with a financial advisor before making any investment decisions. The creator of this chart does not guarantee any specific outcome or profit and is not responsible for any losses incurred as a result of using this information. Past performance is not indicative of future results. Use this information at your own risk. This chart has been created for my own improvement in Trading and Investment Analysis. Please do your own analysis before any investments.
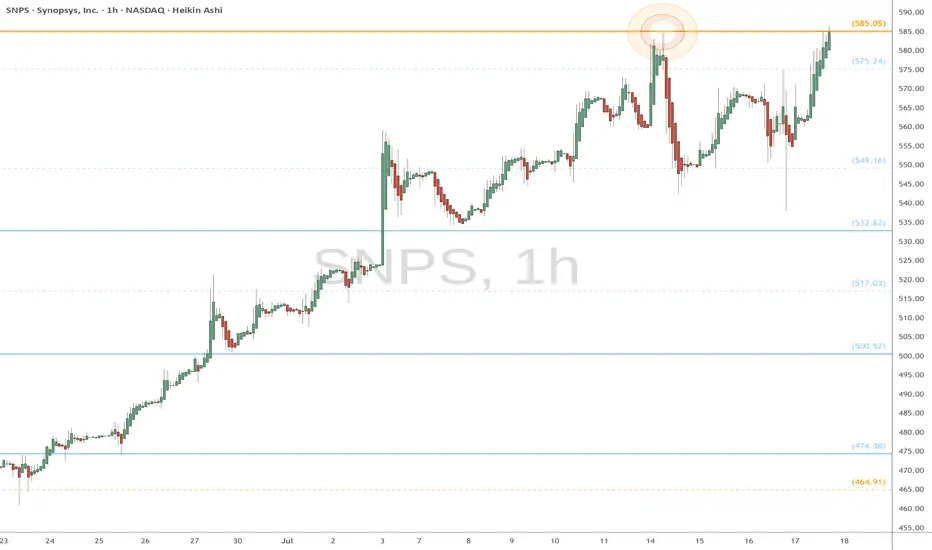
SNPS eyes on $585.05: Golden Genesis break should RUN strongSNPS back to a Golden Genesis that caused last dip.
Current stance and market winds favor break and run.
$585.05 will be key for entries and tight stop losses.
Inverse Head and Shoulders Already Completed Toward a New ATHThe price has completed the formation of an inverse head and shoulders pattern, with the final breakout occurring last week.
Volume confirms the validity of the pattern.
The distance from the head to the neckline projects a target toward a new all-time high (ATH).
As often happens after a breakout, a retest of the neckline may occur, which could present a good entry or accumulation opportunity

SNPS – Dangerous Correction Wave Nearing Completion?The wave structure marked in red often indicates a corrective move. While it appears impulsive at first glance, such formations typically end with a strong candle in the direction of the trend, followed by a full retracement.
This rally is likely not a new bullish impulse but a complex correction within a broader downtrend. Volume remains relatively muted compared to previous sell-offs, reinforcing the corrective nature of the current wave.
Due to the structure's unreliability and tendency to reverse sharply, this is a highly dangerous zone to enter a long. However, for experienced traders, a minimal long position with a trailing stop may be considered for a final push toward the resistance zone around $590.
A failure to break that zone with volume will likely lead to a rapid decline back to previous lows around $400 or even $360.

SNPS Trading Plan: Anticipating a Break Above SMA 150 at 535.73NASDAQ:SNPS
Currently, the price of SNPS is 520.70, which is slightly below the 150 SMA (527.81). The suggested entry point is 535.73, positioned above the SMA 150 to confirm a potential upward trend.
Entry Strategy:
Wait for the price to break above 535.73 to signal confirmation of strength and momentum.
Verify that the SMA 150 remains in an upward trend or shows signs of reversing upward.
Stop Loss:
Set the stop loss at 519.9, just below the SMA 150, to protect against significant downside.
Target:
Identify potential resistance levels above 535.73 to define profit-taking zones.
Alerts:
Place an alert on TradingView at 535.73 to get notified when the price breaks the entry point.
Note:
This plan also aims to identify a potential upward reversal in the trend of the SMA 150, ensuring the stock aligns with a strong bullish movement.

SNPS Still with gas in the weeklySNPS turning bullish after RSI touched the floor, bouncing as if it was lava.
DMI ADX showing signs of strength for the movement.
Monthly also looks positive. A very good stock for the long term gains for sure

Stock Of The Day / 05.12.2024 / SNPS12.05.2024 / NASDAQ:SNPS
Fundamentals. Negative catalyst after earnings report and weak 2025 forecast.
Technical analysis.
Daily chart: nearest potential support level is 515.00 formed by the nearest break in the trend.
Premarket: Gap Down on moderate volume.
Trading session: The price forms a pronounced tightening to the level 532.00 against the initial downward movement, after a non-pullback decline from the opening of the session. We are considering a short deal in continuation of the initial movement.
Trading scenario: pullback along the trend (false tighten) to the level 532.00
Entry: 529.30 breakdown of the trend line of the tightening structure.
Stop: 532.27 above the held level 532.00
Exit: Close part of the position on 520.56 after an unsuccessful attempt to update lower low. Close the rest when exiting upward from the consolidation.
Risk Reward: 1/3

SNPS Breakout Potential to the UpsideNASDAQ:SNPS has been range-bound since 2023 and is finally showing technical patterns that reveal Dark Pool hidden accumulation, pro trader nudges, and the potential for HFTs to gap and run the stock upward.
This stock is setting up to challenge the all-time high. Often in the current Moderately Up-trending Market Condition, HFTs will gap the stock over the resistance level.
So keep the stock on a watchlist to look for pro trader nudges or resting-day candles that indicate the pros are attempting to trigger HFTs to gap the stock up. IF the HFTs gap the stock, then pro traders will take profits immediately, selling into the foray of retail traders chasing the gap. The goal is to enter before a potential gap. The stock may not gap. However, the pattern is indicative of more HFT activity.

SNPS LOOKING GOOD TO GO LONG DEC 3 2023SNPS is looking good to go long at cmp. Again current market price trades have a big SLs always.
I will go long for targets of $613
If you have doubts feel free to message me.

Synopsys Inc. Growth Expectations Ahead of the Quarterly ResultKey arguments in support of the idea.
▪ Expectation of a robust quarterly report.
▪ Attractive entry price and favorable valuation levels based on key multiples.
Investment Thesis
Synopsys, Inc. (SNPS) is the largest computer-aided design (CAD) company in the electronics design industry. Its flagship product, Design Compiler, is a widely recognized logic circuit synthesis tool. The Company offers a comprehensive range of additional products for the design of specialized integrated circuits, including solutions for logic synthesis, behavioral synthesis, element tracing, static timing analysis, formal verification, hardware description language (HDL) simulation (SystemC, SystemVerilog/Verilog, VHDL), and circuit simulation. Synopsys primarily serves customers in the semiconductor and electronics industries. The Company operates through two key segments: Design Automation, which accounts for approximately 69% of total revenue through the first nine months of fiscal year 2024, and Design Intellectual Property (IP), contributing 31%. Founded in 1986, Synopsys is headquartered in Sunnyvale, California.
Expectation of a robust quarterly report. We anticipate that the Company will report results for the current quarter that surpass consensus expectations. Demand for electronic design automation (EDA) solutions remains consistently strong, bolstered by Synopsys’ successful performance in the July quarter and a positive investor outlook for the ongoing period. The Company has reaffirmed its revenue growth guidance of 15% for FY2024 and expects improvements in operating margins. The strategic importance of EDA investments in executing customers' technology plans makes this sector relatively resilient to cuts in capital expenditures. Additionally, the adoption of new AI-based tools, such as ASO.AI and VSO.AI, is gaining momentum and contributing positively to Synopsys’ growth. Furthermore, The Company announced the acquisition of Ansys earlier this year, with the deal expected to close in the first half of 2025. This strategic move will enable Synopsys to provide a comprehensive solution for systematic chip design and integrated chip analysis, expanding its product line and enhancing its competitive position. Consequently, we foresee additional near-term upside for SNPS stock.
Attractive entry price and favorable valuation levels based on key multiples. The stock is currently trading at a discount relative to key multiples when compared to one of its main competitors and the industry average. For instance, Synopsys has an EV/EBITDA ratio of 29.5x for the next 12 months, which is favorable compared to Cadence Design Systems (CDNS) at 34.5x and the peer average of 31.3x. Additionally, the Company’s next 12-month P/E ratio stands at 38.4x, significantly lower than Cadence’s 44.7x and the industry average of 46.7x. This pricing presents an attractive entry point for investors and indicates strong upside potential for the stock.
The target price for the shares is $605, the rating is Buy. We recommend setting a stop loss at $425.

Synopsys Inc. (SNPS) - Waiting for an Entry PointSynopsys Inc. (SNPS) - Waiting for an Entry Point NASDAQ:SNPS
The stock is approaching a potential entry point around $559.31, above the trendline it tends to respect. The entry will be executed with stop loss management in place. It's important to monitor the developments and stay updated accordingly.


SNPS dipping too low now, BuyThere are no fundamental issues with the company. The market share is very solid. There are no lawsuits, no data breaches, or anything like that.
Company has very solid products. I am bullish. Buy.

Strong technical buy signal for Synopsys (SNPS)Technical Analysis of Synopsys Inc. (ticker on Nasdaq: SNPS):
Synopsys (SNPS) shows strong development within both a long-term and short-term rising trend.
A new strong technical buy signal has now been triggered for Synopsys after breaking through a very important technical resistance level around USD 600.00.
There should now be significant technical support for the stock around the USD 600.00 level.
There has been a 'classic' test of the support level here now around USD 600.00, and now the share seems ready for further growth within both the short-term and long-term rising trend.
There is little technical resistance for further upside before around the USD 750.00 level, and up towards the upper trend line of the uptrend.
Based on the technical picture for the share, the potential is assessed to be around USD 750.00 in 1-3 months' time.
What could potentially change the currently very positive technical picture for the Synopsys share would be if the share were to have an established break below USD 590.00.

$SNPSNASDAQ:SNPS again building that consolidation on the hourly, this is setting up real nice. Once this gets above 605 CYA

SNPS Cup N Handle Retracement TestHello everybody thank you for watching my video on this cup and handle setup the price had broken out over the resistance line on the 17th of June and started to retrace all the way up until today so we should see some respect of the support line for a possible entry. if that does not hold tomorrow and it goes lower I will cancel the trade idea and look elsewhere for opportunity.
Let me know if you need to know anything else!

Synopsys Posts Financial Results for Q2 Fiscal Year 2024Synopsys ( NASDAQ:SNPS ) has raised its annual revenue and profit forecast due to the robust demand for its software to design advanced chips driving artificial intelligence applications. The AI boom has boosted investments in custom design of chips as tech firms race to dominate the lucrative technology with new innovations, triggering demand for companies such as Synopsys. Chief Executive Sassine Ghazi said demand for the company's core products remained strong, with revenue from them expected to grow 15% this year as customers design their own chips for AI and other purposes. Semiconductor firms continue to invest in research and design and turn to the company's AI-powered electronic design automation suite, Synopsys.ai, in a bid to ace and improve complex chip designs.
Synopsys ( NASDAQ:SNPS ) now expects annual adjusted earnings per share between $12.90 and $12.98 from its earlier forecast of $12.86 and $12.94. The company updated its annual expectations on its investor day in March, excluding its software integrity (SIG) unit. Earlier this month, the company said it would sell the SIG unit to a private-equity group led by Clearlake Capital and Francisco Partners in a $2.1 billion deal.
Synopsys ( NASDAQ:SNPS ) forecast third-quarter revenue between $1.51 billion and $1.54 billion, below analysts' average estimate of $1.60 billion, according to LSEG data. Revenue in the second-quarter ended April 30 rose about 15% to $1.45 billion, but fell short of estimates of $1.53 billion. Excluding items, it earned $3.00 per share, beating estimates of $2.95 per share.
In January, Synopsys ( NASDAQ:SNPS ), which partners with chipmakers including Taiwan Semiconductor Manufacturing Co, Intel (INTC.O), and Samsung Electronics, said it would buy Ansys (ANSS.O) in a $35 billion cash-and-stock deal. Separately, Ansys said on Wednesday that its stockholders approved its proposed acquisition by Synopsys.
Synopsys ( NASDAQ:SNPS ) reported Q2 financial results for the second quarter of fiscal year 2024, with quarterly revenue of $1.455 billion, up approximately 15% year over year and at the high-end of guidance. Quarterly GAAP earnings per diluted share of $1.92; non-GAAP earnings per diluted share of $3.00, up approximately 26% year over year1 and exceeding guidance.
Synopsys' strong Q2 results were driven by its team's relentless focus on execution, leading technology that is mission-critical to customers, and resilient business model. The company is again raising its full-year targets for revenue and non-GAAP EPS, based on strong execution and continued business momentum.
Technical Outlook
Synopsys ( NASDAQ:SNPS ) stock closed Thursday's trading session with a Relative Strength Index (RSI) of 60.27 which is slightly overbought. The stock has been on a rising trend since the fall of November, 2023 consecutively rising to new highs.

SNPS - wedgeSNPS - formed a wedge on low volume.
I expect volume to come here next days.
I will be watching for entry after 8EMA recapture.

Navigating the Chip Maze: Should You Invest in Synopsys?Navigating the Chip Maze: Should You Invest in Synopsys?
Synopsys, a titan in the Electronic Design Automation (EDA) landscape, offers intriguing prospects for investors curious about the semiconductor industry. But before diving in, let's unpack the company, analyze its potential, and explore options – with a strong disclaimer: trading is inherently risky and not suitable for everyone.
Synopsys: Powering the Chip Revolution
Founded in 1986, Synopsys has carved a niche by providing essential tools and services for chip design and verification. Imagine them as the architects and inspectors of the tiny brains powering our devices. Their clients? Tech giants like Apple, Intel, and Samsung, relying on Synopsys for efficient, secure chip development.
Products and Services:
EDA Tools: The bread and butter – software enabling chip design, simulation, and verification.
Silicon IP: Pre-designed building blocks, saving chipmakers time and money.
Software Security and Quality: Tools to identify and fix vulnerabilities in software, crucial in an increasingly interconnected world.
Financials and Performance:
Revenue: $5.3 billion (FY 2023)
Net Income: $1.2 billion (FY 2023)
Ratings: Leader in Gartner's Magic Quadrant for EDA, "100 Best Companies to Work For" by Fortune
So, Buy, Sell, or Hold?
This is where things get tricky. Analysing publicly available information can't guarantee future performance. Several factors could influence Synopsys' stock price:
Overall Semiconductor Market: A booming market benefits Synopsys, but downturns can impact sales.
Technological Advancements: Staying ahead of the curve in EDA is crucial, and continuous innovation is key.
Competition: Other EDA players like Cadence Design Systems pose constant competition.
Options Trading: A Calculated Gamble?
Remember, options involve significant risks. Buying call options bets on a stock price increase, while put options profit from a decrease. With expirations ranging from 1-12 months, you choose your timeframe and risk tolerance. However, options decay in value over time, and misjudgment can lead to substantial losses.
The Verdict: Do Your Research, Proceed with Caution
Synopsys is a prominent player in a growing industry, but the decision to invest ultimately rests on your individual financial goals and risk appetite. Conduct thorough research, understand the risks involved, and never invest more than you can afford to lose. Consider seeking professional financial advice before making any investment decisions.
Risk Warning
Trading stocks and options is a risky activity and can result in losses. You should only trade if you understand the risks involved and are comfortable with the potential for losses.
Risk Warning: Trading is Not for Everyone
It's essential to emphasize that trading stocks and options carries inherent risks. Market volatility, unpredictable events, and human error can lead to significant losses. Therefore, it's crucial to undertake thorough research, understand the underlying risks, and only invest funds that can be comfortably afforded to lose.
------------------------------------
Rating: STRONG BUY
Risk Disclaimer!
The article information and the data is for general information use only, not advice!
---------------------------------------------------------------------
Risk Warning Trading stocks and options is a risky activity and can result in losses. You should only trade if you understand the risks involved and are comfortable with the potential for losses. Risk Disclaimer! General Risk Warning: Trading on the Financial Markets, Stock Exchange and all its asset derivatives is highly speculative and may not be suitable for all investors. Only invest with money you can afford to lose and ensure that you fully understand the risks involved. It is important that you understand how Trading and Investing on the stock exchange works and that you consider whether you can afford the high risk of loss!
