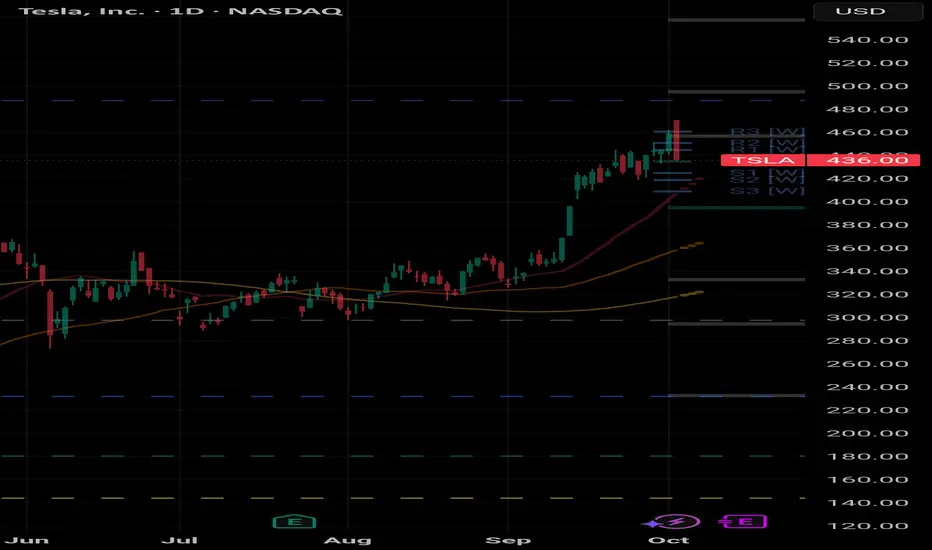
$TSLA revert to mean? Would really like a NASDAQ:TSLA gap close just below 400, but would REALLY love 360/350.
NASDAQ:TSLA
TL0 trade ideas
"old" news on $TSLA keep recycled ...I draw to establish various trading hypotheses!
bull support: $420
greedy target: $550
--------------------------------------
Tesla news this week centers around record vehicle deliveries spurred by a last-minute rush to claim the $7,500 U.S. EV tax credit before its expiration, surging share prices, and anticipation for the unveiling of Tesla's robotaxi next week. Momentum is strong in some European markets due to Model Y updates, but overall global deliveries and profit margins remain challenged by competition and the end of EV incentives.
### Upcoming Catalyst Events
- Tesla will announce Q3 delivery figures on October 2. The results will set the tone for year-end and investor sentiment.
- The official unveiling of Tesla’s robotaxi is scheduled for October 10, positioned as a major innovation for 2026. Production lines for new affordable models are also expected to be discussed soon.
- Ongoing debates continue about Musk’s trillion-dollar compensation package, to be voted on by shareholders in November.
### Product and Market Developments
- The facelifted Model Y Performance launched in select regions with significant upgrades, but the refreshed model is not yet in the U.S. market.
- Tesla’s next major move involves scaling production of cybercab robotaxis and further advancing self-driving technology amid increasing regulatory scrutiny.
Tesla’s record delivery boost from U.S. incentives may be short-lived as competition and regulatory changes mount, but anticipation for new products and technology keeps shares strong and investors alert for next week’s pivotal announcements.

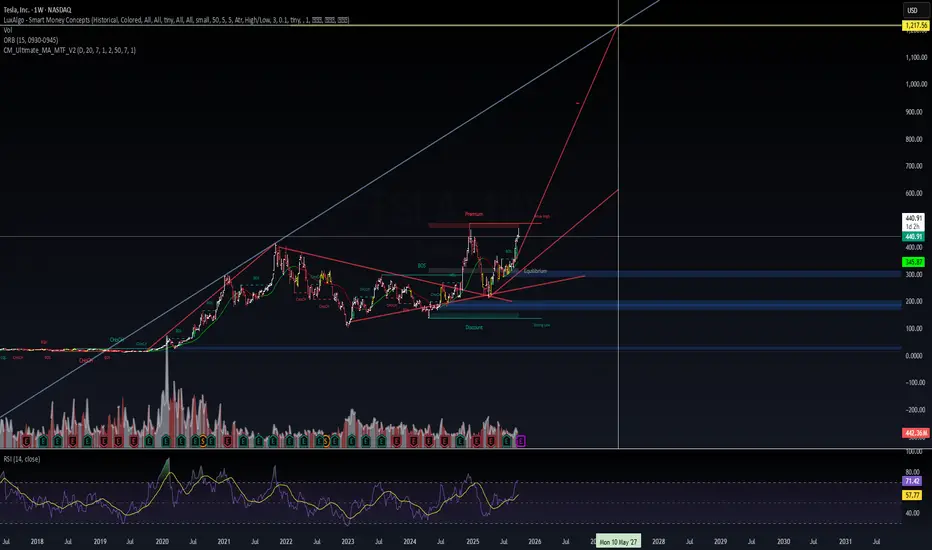
$TSLA – Weekly Outlook📊 NASDAQ:TSLA – Weekly Outlook
Price is holding above equilibrium (~400) after reclaiming structure.
Strong base formed in discount zone (~345–300) now acting as support.
RSI on weekly = 71.4 → momentum strong, trending into overbought.
Long-term projection points toward $1,217.56 (extension target).
🎯 Scenarios
Bull case (70%)
Hold >400 → momentum unlocks premium zone.
Next upside pivots: 470 → 600 → 1,217 (extension).
Bear case (30%)
Break <400 → return to equilibrium/discount at 345–300.
$TSLA | Premium Rejection → Gap Fill WatchNASDAQ:TSLA ⚡ | Premium Rejection → Gap Fill Watch
We’re sitting right at the previous premium sell zone (~$454) — liquidity likely being tested.
Volume rising into resistance, RSI >70, and volatility increasing — signs of distribution.
If bears hold under 454, I expect a retracement toward $420 → $405 to fill the gap zone this week.
Only a confirmed close above 456 invalidates the bearish setup.
Gap fills usually move fast once liquidity flips — and this one has the volatility fuel to do it.
#TSLA #WaverVanir #VolanX #SMC #LiquidityMap #AITrading #SmartMoneyConcepts #Tesla

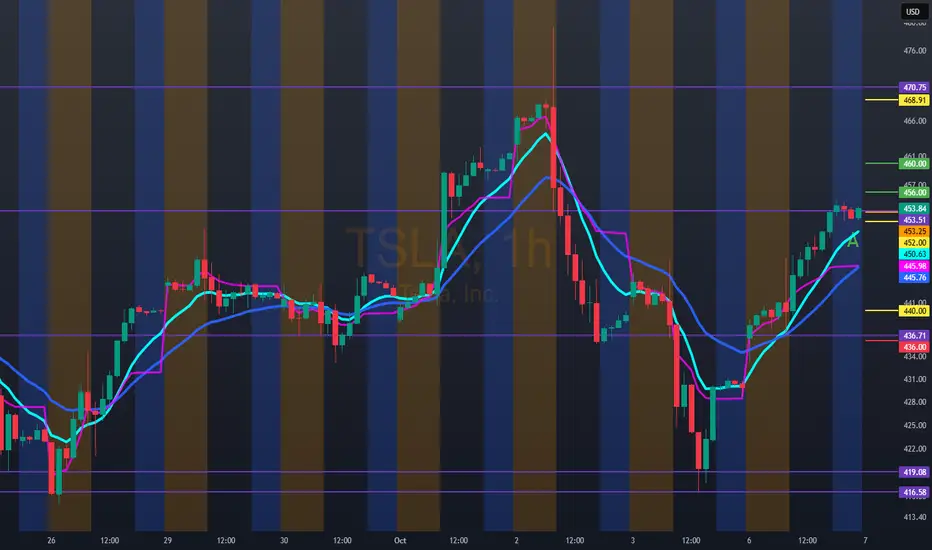
TSLA Oct 7 – At the Edge of a Breakout! Bulls Eyeing $460+ Zone15-Min Chart Analysis (Intraday Trading Setup):
TSLA is riding a sharp ascending wedge structure after a strong rally from the $420s. Price is consolidating near $453.84, right beneath the upper channel line around $455–$456, hinting at a potential breakout or short-term exhaustion.
The MACD remains elevated but is losing histogram momentum — suggesting that while buyers are still in control, short-term strength is cooling. Stoch RSI near 25 shows a possible reset before the next leg higher, a classic pattern after a big push.
If TSLA maintains support above $446.60–$448.00, bulls should watch for continuation toward $454.91 → $460. However, a break below $436.70 would invalidate the bullish micro-structure, potentially sending price toward $430–$428 to retest liquidity.
The 15-min chart shows buyers defending dips aggressively — indicating that institutions are still supporting price action within this rising wedge.
1-Hour GEX Confirmation (Options Sentiment Insight):
The 1-hour GEX data strongly supports the bullish thesis:
* Highest positive NETGEX / CALL resistance sits near $450, which TSLA has already reclaimed — a bullish confirmation that gamma is now supportive, not suppressive.
* CALL walls cluster between $455–$465, forming the next target zone if momentum persists.
* PUT walls remain heavy around $410–$420, providing a sturdy gamma floor.
This configuration reflects a bullish gamma landscape, where dealer positioning favors upward drift as long as TSLA holds above $445. The $450 reclaim may act as a launchpad toward the $460 gamma pocket.
My Thoughts:
TSLA’s recovery from sub-$430 levels shows aggressive reaccumulation and gamma reinforcement from institutions. The near-term wedge consolidation is a healthy pause — not weakness. If buyers can break above $455 with conviction, the next run toward $460–$465 could unfold quickly.
However, caution remains if TSLA slips below $446, as that would reintroduce downside gamma pressure, likely driving a retest of $436–$430 before finding demand again.
Options Outlook (Oct 7–11):
* Bullish setup: Consider 455C or 460C (Oct 11 expiry) if price breaks and holds above $455 with rising volume.
* Bearish scalp: Buy 440P only if price fails at $454.91 and loses $446.60 structure support.
* IV note: IVR 30.5 with IVx 70.1 — volatility remains high, so option premiums are rich; ideal for momentum plays, not range trades.
Conclusion:
TSLA is coiled for a decisive move. The 15-min wedge suggests momentum compression, while the 1-hour GEX map shows strong support below $440 and bullish gamma flow above $450. A confirmed breakout above $455 opens room toward $460–$465, with potential to squeeze higher this week.
Disclaimer: This analysis is for educational purposes only and does not constitute financial advice. Always do your own research and manage your risk before trading.

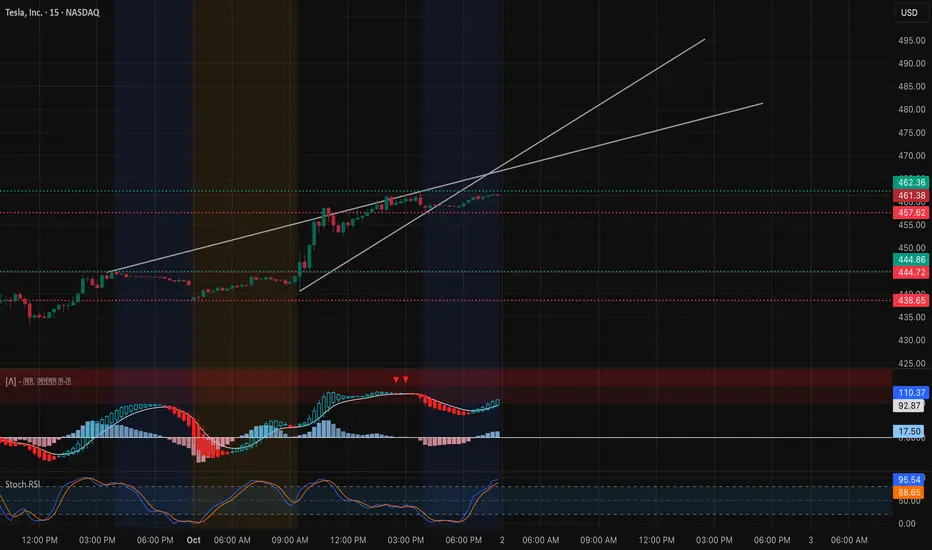
TSLA Testing $462 – Gamma Ceiling or Breakout? (Oct 2)Intraday (15-Min Chart)
Tesla has pushed strongly into the $461–$462 zone, where sellers are starting to show up. On the 15-min chart, price is hugging the upper trendline of the short-term channel. Momentum is extended, but both MACD and Stoch RSI suggest buyers are still pressing their advantage.
* Support levels: $457.5 (near-term pivot) and $452 (channel base).
* Upside trigger: If bulls clear $462.5 with conviction, next upside targets open toward 465–468 intraday.
* Downside risk: Failure to hold $457 risks a pullback to 452–445, where dip-buyers may look to reload.
Bias intraday stays bullish above 457, but stretched oscillators warn of potential rejection if $462 caps the move too strongly.
Options / GEX (1-Hour Chart)
Gamma exposure provides a clear map of where TSLA could move next.
* Call walls: Heavy concentrations sit at 465–470, with $470 acting as the largest resistance zone (gamma ceiling).
* Put walls: Anchored around 432–425, setting downside boundaries.
* Sentiment: Call flow dominates (≈74% bullish options positioning), aligning with recent price momentum.
This paints a classic setup: TSLA is coiling directly beneath the $470 gamma wall. A breakout through 470 could trigger a gamma squeeze toward 475–480, but repeated rejections here trap longs and drag price back into mid-450s.
My Thoughts
For Oct 2, TSLA is at an inflection. I’d favor scalps on dips above $457 targeting 465+ with stops tight under $452. For options traders, a 465–470 call spread lines up well with the gamma map, offering defined risk into resistance. Conversely, if $457 fails, short-term puts targeting 445–448 provide hedge coverage.
Bias: Bullish above 457, but watching $470 as the true breakout line that decides whether momentum continues or stalls.
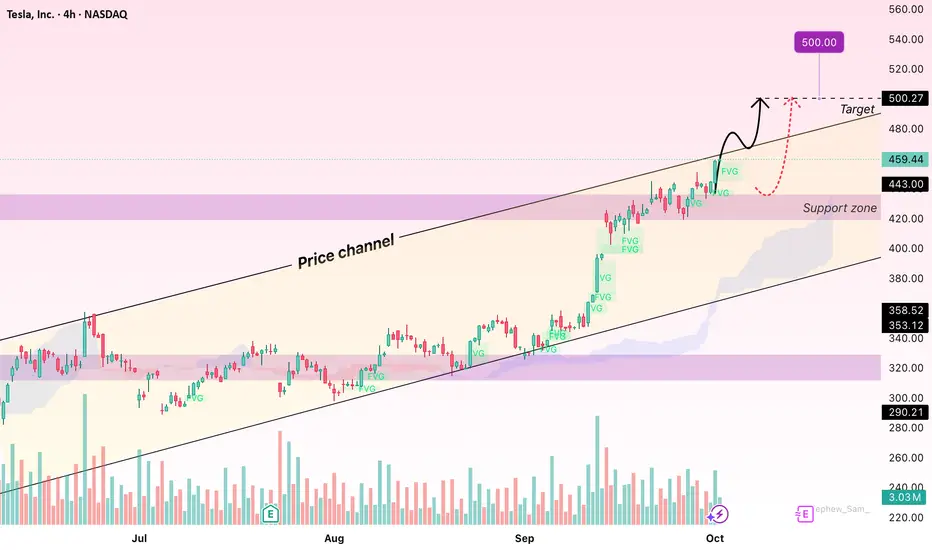
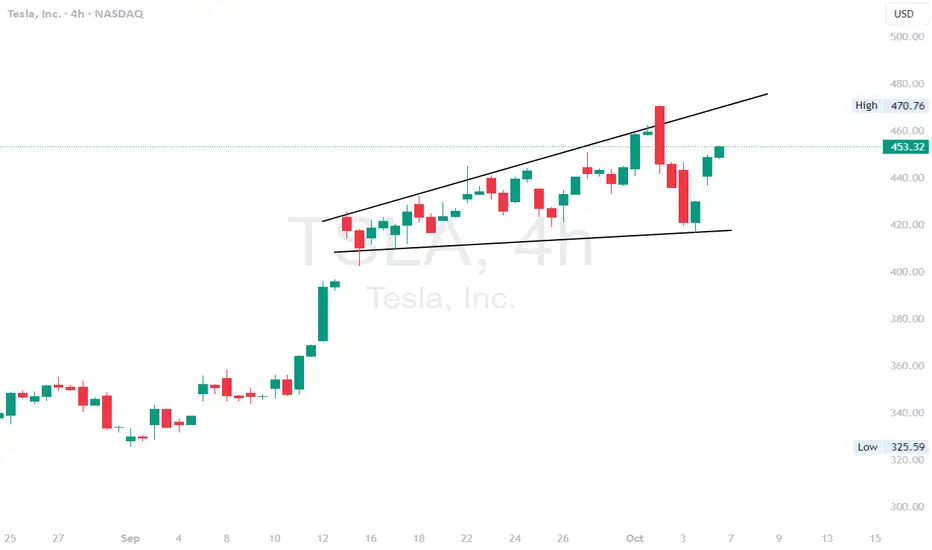
Tesla: Uptrend Intact – Eyeing the 470 Target AheadHello everyone,
Tesla (TSLA) has been extending its rally since mid-July. On the H4 chart, the uptrend remains intact with a clear sequence of higher highs and higher lows, signalling that buying pressure continues to dominate. The recent breakout above the $460 mark further strengthened the bullish trend.
Currently, the price is trading above the Ichimoku cloud, while the $457–460 zone provides a short-term support cushion. In case of a pullback, the $450–445 area would act as a deeper support. On the upside, targets are set at $465, followed by $470 and $475. Rising volumes during breakouts indicate that institutional money is still flowing into the stock.
From a fundamental perspective, Tesla’s Q3 earnings exceeded expectations thanks to strong growth in Model 3 and Model Y sales, providing major momentum for the stock. At the same time, plans to expand into the lower-priced EV segment and renewable energy business add long-term sustainability to its outlook. In a rapidly expanding global EV market, Tesla maintains a competitive edge in both technology and brand strength.
On the macro side, while investors remain cautious about the Fed, the tech sector overall – and Tesla in particular – continues to benefit from the positive sentiment across equity markets.
What do you think – will Tesla reach the $470 target in this leg up, or does it need a short pullback before breaking higher?
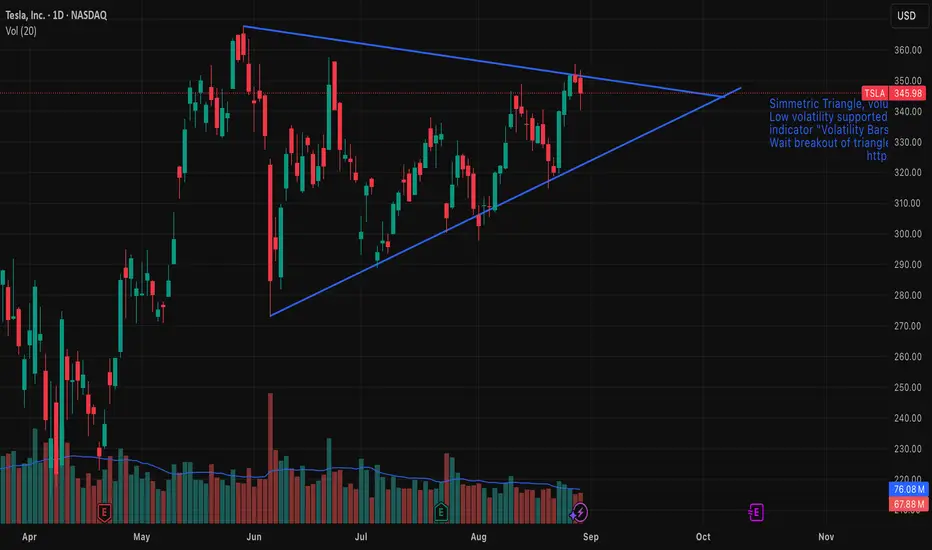
Tesla (TSLA) — Symmetrical Triangle Breakout IdeaSummary
Pattern: Symmetrical triangle on daily chart.
Expected timeframe for breakout: Within 1–2 weeks.
Targets: $367 on an upside breakout; $273 on a downside breakout.
Risk management: Use a stop-loss just outside the triangle after breakout confirmation; position size per your risk rules.
Setup & Rationale
A well-defined symmetrical triangle has formed on TSLA’s price action, characterized by converging trendlines connecting lower highs and higher lows. Volume has contracted inside the pattern, consistent with consolidation. Symmetrical triangles are neutral continuation/reversal patterns; the breakout direction provides the trading signal.
Key technical points:
Price is approaching the apex, increasing the likelihood of a decisive breakout in the next 1–2 weeks.
Volume decline during the consolidation and a volume spike on breakout would confirm conviction.
The breakout should be taken after a daily close beyond the upper or lower trendline (or after a retest), not merely intraday probes.
Entry Criteria
Upside trade: Enter long on a daily close above the upper trendline (or on a confirmed retest).
Downside trade: Enter short on a daily close below the lower trendline (or on a confirmed retest).
Targets & Measurement
Measure the pattern height (vertical distance between the initial high and low of the triangle) and project it from the breakout point.
Upside target (projected): $367.
Downside target (projected): $273.
Adjust targets proportionally if you use a measured move from the actual breakout point rather than the pattern’s maximum height.
Stops & Risk Management
Place stop-loss slightly outside the opposite trendline or beyond a recent swing point to avoid false breakouts.
Preferred approach: fixed-risk percent per trade (e.g., 1–2% of portfolio) and scale position size accordingly.
Consider tightening stops to breakeven after price clears ~50% of the distance to the target.
Confirmation: daily close beyond trendline plus above-average volume (up or down depending on direction).
Symmetrical triangles are neutral; false breakouts occur. Wait for confirmation.
News, earnings, or market-wide events can invalidate technical setups quickly—monitor catalysts.
Adjust targets/stops if volatility expands or if the breakout lacks volume confirmation.
Hello trader, for tomorrow, TSLA: 453.25 10/07/2025 amBullish entry above 456.00/460.00 if the open is in this area. If the open is below 452.00, we can expect this to be the 440.00 area with a possible rebound, providing an upside opportunity. If the 440.00 level is lost, we can only enter bearishly below 436.00/432.00 (a possible downside target of 419.00) (a possible upside target of 488.54)
$TSLA - possible move pre product launchTSLA - Stock moving higher pre product launch tomorrow. Seeing multiple call buyer coming in as well. Stock is in a triangle pattern on the 4 hour time frame bouncing off bottom of the channel. Stock has top of the channel is at $470. bigger move about that level. Stock is decent at the indicator level.
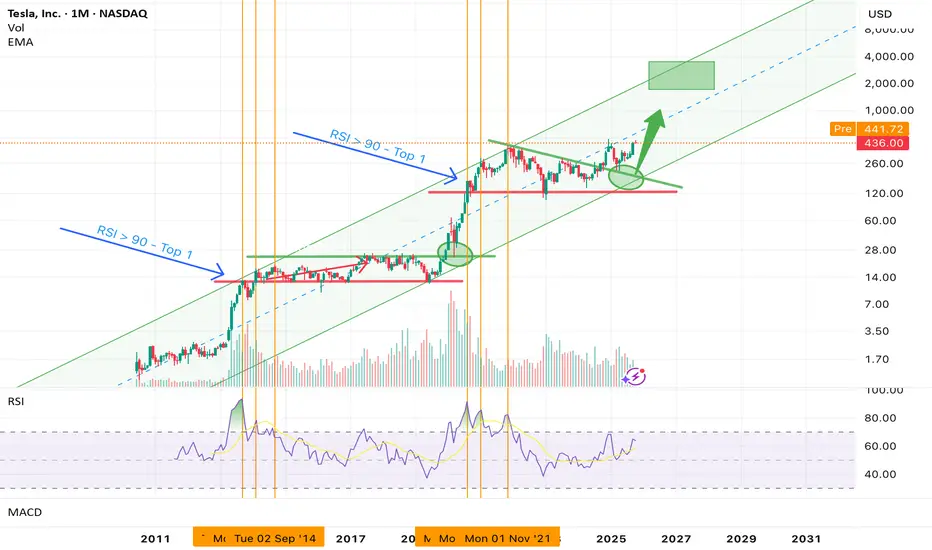
Tesla (TSLA) – RSI Signals New Bull Cycle, Not Near the TopTechnical View: Trend intact. Momentum constructive. Cycle still maturing. The RSI roadmap suggests the story is far from over — and the most explosive phase may still lie ahead.
Summary:
Back in April , we identified the $270–$320 region as a decisive long-term support zone — a confluence of the 0.382–0.5 Fibonacci retracement levels and the lower boundary of Tesla’s decade-long rising channel. That analysis has played out perfectly: TSLA retested this zone, built a solid base, and resumed its uptrend.
Today, with the stock trading above $430 and advancing toward the channel median — already within proximity of the next resistance zone around $480–$500 — the most powerful signal comes from momentum rather than price. The monthly RSI tells us something crucial: we are not near a cycle top. In fact, historical patterns suggest Tesla is entering the expansion phase of a new multi-year bull cycle , with much higher prices still ahead.
RSI and Market Cycles: What History Tells Us
Tesla’s two previous major bull markets — in 2013–2014 and 2019–2021 — followed a remarkably similar script before topping out:
The first euphoric peak of each cycle coincided with a monthly RSI above 90 , not in the middle of the channel but as price pushed into — and slightly above — the upper boundary.
After that first RSI > 90 event, the stock posted two higher highs with lower RSI peaks , a textbook sign of momentum exhaustion (bearish divergence).
The result each time: a sharp correction of 45–75% .
Today, RSI sits near 56 — nowhere close to overbought extremes. This strongly implies that Tesla is still in the mid-cycle expansion stage — a phase historically associated with sustained institutional accumulation, accelerating price gains, and multiple expansion.
Even more importantly, if history repeats, RSI > 90 will not occur until price reaches the upper boundary or slightly breaks above it . Based on current channel geometry, that implies a potential first euphoric peak in the $1,200–$1,600 range — far above where the stock trades today.
My Prediction and Trade Idea
I believe Tesla is now in the second phase of a new multi-year bull cycle, likely playing out over the next 18–30 months . The technical setup — price structure, channel dynamics, and RSI behaviour — all point to continued upside.
My base-case roadmap:
Near-term: Tesla approaches the $480–$500 resistance area (upper half of the channel) in the coming months.
Mid-term: A breakout above $500 could trigger a sustained expansion leg toward $650–$700.
Late-cycle: As momentum peaks and RSI nears 90, price could accelerate into the $1,200–$1,600 zone — the area historically associated with euphoric tops.
For long-term investors and swing traders, the current risk-reward profile remains compelling. As long as Tesla holds above the $320 accumulation zone, the path of least resistance remains higher.
Profit Targets and Stop Loss
First Target : $480–$500 (upper half of the channel)
Second Target : $650–$700 (mid-cycle breakout extension)
Third Target : $1,200–$1,600 (historical RSI > 90 / euphoric top zone)
Stop-Loss Strategy:
A sustained monthly close below $320 would invalidate the mid-cycle thesis and suggest a deeper corrective structure. For traders, this remains the technical “line in the sand.”
Risks to Consider
While the technical backdrop is bullish, several risks could challenge this thesis:
Macro Shifts : Higher-for-longer rates or a global recession could compress growth multiples.
Execution Risk : Delays in autonomy, robotics, or the energy business could dampen investor enthusiasm.
Valuation Pressure : Tesla’s premium valuation makes it sensitive to changes in growth expectations.
Momentum Signals : If RSI fails to advance significantly during the next leg higher, it may signal internal weakness and an earlier-than-expected cycle peak.
Conclusion
Tesla’s long-term uptrend remains robust, key support has held, and momentum indicators show we are still early in a powerful new bull cycle. Historical RSI behaviour strongly suggests that the first euphoric phase — where RSI exceeds 90 and a true cycle top begins to form — will occur at much higher levels , likely $1,200–$1,600 .
Until then, price action, structure, and momentum all point to continued appreciation. As long as support holds above $320, the base-case scenario is clear: Tesla’s next major move is higher — and the market is still writing the early chapters of this bull cycle .
TSLA Roadmap: $563 ABCD Compl → Bat Harmonic → $631 Three-DriveTesla (TSLA) appears to be completing its final impulsive wave toward the $563 region, which also aligns with the D point completion of the ABCD harmonic pattern.
Once this move is finished, the expectation is for a corrective phase that forms a Bat harmonic. This retracement would also work to fill in the untested gaps left behind during the recent rally, with a potential bottom around the 78.6% Fibonacci level.
From there, the next bullish leg could initiate, targeting the 127.2% extension at $631. This move would not only confirm the harmonic reversal but also complete a larger Three-Drive pattern that originates from the initial ABCD structure.
Key Levels to Watch:
ABCD Harmonic D point: ~$563
Bat Harmonic completion zone: ~78.6% retracement
Next rally target: $631 (127.2% extension, Three-Drive pattern confirmation)
Invalidation Scenarios:
A clean breakout above $563 without corrective rejection would invalidate the Bat harmonic setup and suggest an extended bullish run.
A failure to hold above ~$367 (channel/structure support) would weaken the harmonic roadmap and risk a deeper bearish continuation instead of a Three-Drive completion.
This roadmap suggests a critical short-term top before a deeper correction sets the stage for a much larger rally.

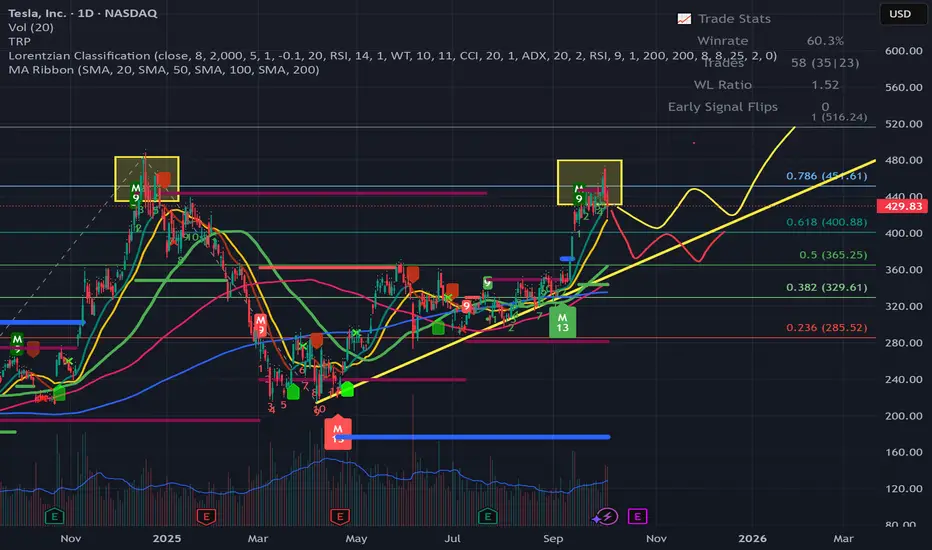
$TSLA: Let The Rally Speak For Itself - 9/16/2025Based on the analysis, it’s confirmed that NASDAQ:TSLA has initiated a new rally following the completion of a lengthy and complex corrective structure at $288.
The stock bounced twice off the 50-week moving average, signaling strong support as the correction neared its end.
Due to the depth and complexity of the structure, Wave 3 is expected to unfold with high momentum, potentially delivering an explosive rally. Key upside targets are displayed in the chart — we’ll be watching closely to see how price reacts at those levels.
📚 Note: The internal structure and labeling were intentionally left visible in the chart for educational purposes. This is especially useful for traders interested in Modern Trading Algorithms and their structural variations.
Happy Trading, and let the rally speak for itself. 🚀

TSLA - Tesla - Possible Pull-Back to 400 or 365Hello Everyone , Followers
Tesla is the second one that i would like to mention today.
It hit the Resistance level of 451 and then it did not achive to break this level.
Now i am expecting 2 possible scenario
Yellow pattern : pull back till 400 and get power from this level and try to break 451 again.
Or Red Pattern : pull back till 365 then get support from trend line and go up again and try to break 451.
If it breaks the 451 then next station is 515 - 516 .
All in all , i am expecting the Pull-back next week and you could follow the price levels that you can see in Chart. I am neutral in Tesla for the time being.
This is just my thinking and it is not invesment suggestion , please do not make any decision with my anaylsis.
Have a lovely Sunday to all.
TSLA SELL++++ $360-370 to be testedAs I posted last week, and, clearly too early TSLA needs to test the $370 range where it broke out from. I do pat myself on the back for the epic bounce off support at $324.80 that needed to hold to see $426's and TSLA always goes further then we think both ways. We're way overdone and todays reversal shows it. $370's imminent in coming weeks

TSLA eyes on $409.56: Golden Genesis fib to hold "High Ground"TSLA has been surging based on various news.
Now retracing towards a Genesis fib at $409.56
Clean bounce would indicate very strong trend.
Golden Genesis fibs are important milestones.
High gravity fibs can capture price into orbit.
Expect consolidation around it then sling shot.
.
Previous analysis that caught a PERFECT BOTTOM:
Hit BOOST and FOLLOW for more such PRECISE and TIMELY charts.
========================================================
.

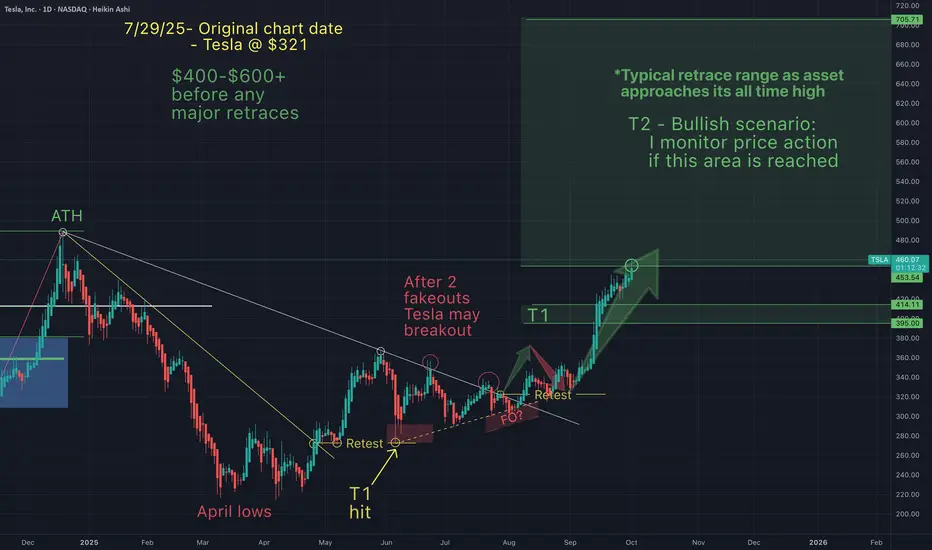
Tesla - NEW ALL TIME HIGH INCOMING (small pullback first?)On July 29th Tesla was around $320 and I suggested that after a long downtrend, Tesla would breakout, retest and continue up ("without any major retraces)", to between $400-$600.
Tesla has now hit my T2 (currently $460) and I am anticipating a small retest before new all time highs in the near term.
Congrats to all of you who have made gains from my charts.
May the trends (continue) to be with you.
Long trade Trade Journal Entry
Pair/Asset: TSLA (Tesla Inc.)
Trade Type: Buyside trade
Date: Friday, 26th Sept 2025
Session: London to New York Session AM (11:00 AM)
Trade Details
Entry: 427.51
Profit Level (TP): 465.20 (+8.82%)
Stop Level (SL): 425.82 (-0.40%)
Risk–Reward (RR): 22.3
Technical Narrative
Pre-Trade Context:
The price consolidated above a demand zone at 423–427, which coincided with the origin of a prior order block. Inducement & BOS (Break of Structure) confirmed bullish intent.
Several fair value gaps (FVGs) were present on the climb, supporting bullish continuation.
Entry Justification:
*Entry at 427.51 aligns with the mitigation of the demand zone and FVG fill.
*The structure flipped bullish after the sweep of local lows, setting the stage for an upside liquidity grab.
Target Rationale:
*TP aimed at 465.20, aligning with the previous swing high and liquidity above.
*Clean imbalances left on the rally offer magnets for price.
Risk Management:
Tight SL at 425.82, just below the demand origin to invalidate trade if broken.
Observations & Notes
The accumulation structure within demand was well-formed before the breakout.
Entry captured an early move with FVG alignment + inducement sweep.
Monitor for potential rejection near 448.96 (intermediate resistance) before TP.

Crazy or Optimistic?We've followed an upward channel since 2022. Since then, we have created HLs & HHs.
I see a price prediction of $550 to $600 by the end of the year, and +$700 by July 2026.
Let me know your thoughts.

$TSLA Fake out Cleared out my Calls this morning in the spike before the drop. Now downside is looking good. Waiting for a quick bounce before jumping in possibly. NASDAQ:TSLA

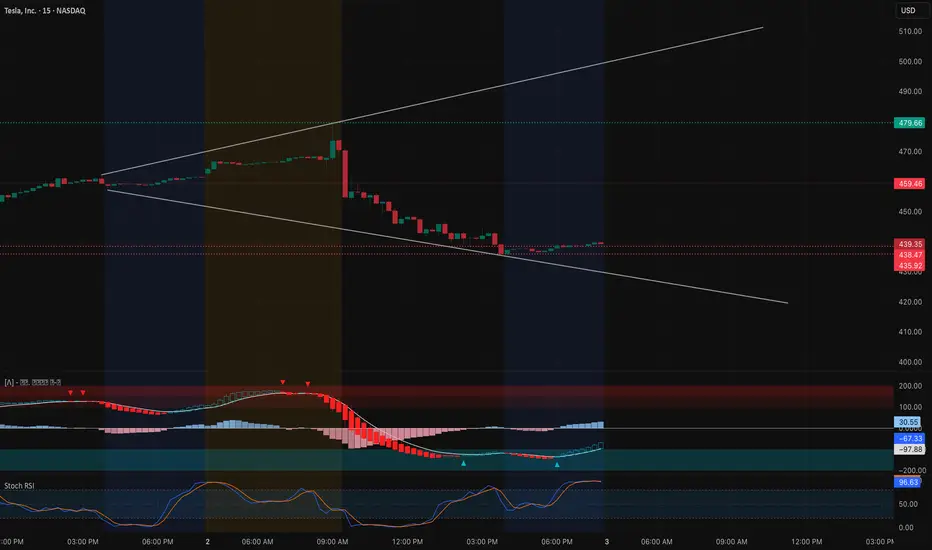
TSLA At a Crossroads: Bounce or Breakdown for Oct 3? Intraday Technical Outlook (15m Chart)
Tesla (TSLA) saw a sharp selloff, sliding from the mid-$470s to close near $439.35. On the 15-minute chart, the structure is now hugging a descending support line:
* MACD: Still deep in bearish territory but showing early signs of momentum cooling as histogram bars lighten.
* Stoch RSI: Reset from extreme oversold levels, suggesting potential for a relief bounce.
* Key Levels: Immediate support rests around $435–432, with a breakdown exposing $425–420. On the upside, first resistance is $445, followed by a more critical level at $452.5.
Intraday takeaway: Short-term traders should watch if TSLA holds above $435. A sustained bounce can spark a retrace to $445–452, while failure risks another leg lower toward $425.
Options Sentiment & GEX Outlook (1H Chart)
The 1-hour GEX map paints a decisive risk zone for tomorrow’s trade:
* Gamma Walls:
* $452.5–460: Strong call resistance cluster, where sellers likely re-emerge.
* $439.5: Key gamma pivot — trading below this opens up bearish flows.
* $432 / $425 / $420: Heavy put walls acting as magnets if weakness persists.
* Implications:
* Holding above $439.5 can squeeze shorts toward $445–452.5, offering upside for quick calls.
* Losing $435 confirms dealer hedging pressure lower, opening room to $425–420, favoring puts.
* Volatility Context: IVR at 26.9 vs IVx avg 65.2 shows premiums are mid-range but still elevated. This means intraday traders may prefer spreads over outright calls/puts to balance risk/reward.
My Thoughts & Recommendation
For Oct 3 trading, Tesla is sitting right at a critical gamma pivot.
* Intraday (scalping/trading): Look for a bounce play off $435, with upside targets at $445–452 if momentum aligns. A breakdown below $432 favors continuation toward $425–420.
* Options trading (swing/0DTE): Call positions only make sense above $439.5, with tight stops and targets capped near $452. Put strategies (vertical spreads or debit puts) look stronger if price fails at $439.5 and rolls back toward $425.
Bias heading into Oct 3: Cautiously bearish unless $439.5 is reclaimed with volume.
Disclaimer:
This analysis is for educational purposes only and does not constitute financial advice. Always conduct your own research and manage risk before trading.
Tesla - Here we goooooo!🚗Tesla ( NASDAQ:TSLA ) is finally breaking out:
🔎Analysis summary:
Finally, after a consolidation of four years, Tesla is attempting another all time high breakout. With the bullish triangle coming to an end, bulls are dominating this stock. It just comes down to the next couple of months but a triangle breakout remains far more likely.
📝Levels to watch:
$400
SwingTraderPhil
SwingTrading.Simplified. | Investing.Simplified. | #LONGTERMVISION

TSLA TeslaToday’s session printed a dark candle with heavy pressure and big price action — not the best look from a candlestick perspective. The immediate support sits at the uptrend line near 433. If price can hold that level tomorrow, the uptrend remains intact. But if we get a decisive close below, expect a sharper drop. First downside target would be 405, and if that fails, we could see an extension toward 370–360, lining up with the previous lower uptrend line. Tomorrow’s price action at that 433 support is critical — watch it closely. follow me on X Enginv777
