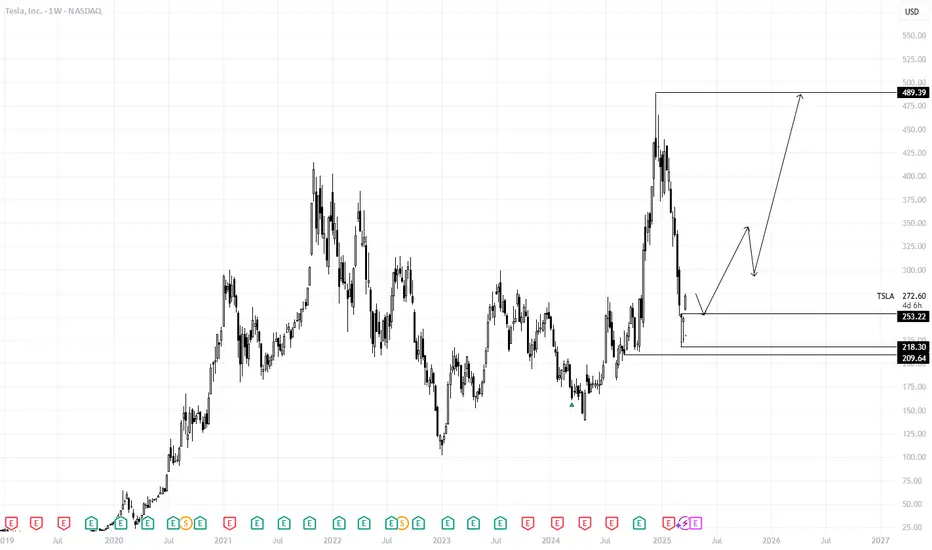
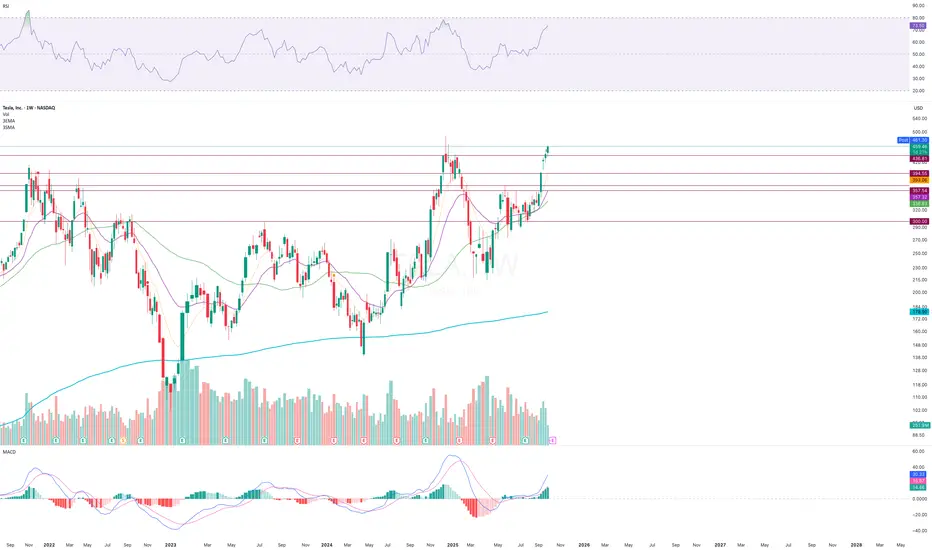
Crazy or Optimistic?We've followed an upward channel since 2022. Since then, we have created HLs & HHs.
I see a price prediction of $550 to $600 by the end of the year, and +$700 by July 2026.
Let me know your thoughts.
Trade ideas

$TSLA to $5,000 #CathiesBack!!! #Bullflag #AlwaysHasBeenSome Bull #corn for the PermaBulls out there after this V recoVery on Indices...
Just some log scale mathematical measurements from one flagpole to the next...
#AnythingIsPossible if Physics allows... Tesla at 5k is simply tesla at 5Trillion valuation... once self driving fulfilled? Odds increasing with GPU/AI capabilities...
NASDAQ:NVDA should be a major green light for the next leg up in markets or rejection... definitely leaning bullish still after V , dips to be bought in this environment...

Gold extensions10 1 2005 I am really happy with this video because it did so many things that could have been helpful to your trade looking at the market the way we've been looking at it for a long time. The tools that I look at work. The only thing that concerns me is that I told you how you could have made money on gold by shorting it and then when it came back to support you could have made money on gold in both directions and each Direction was nearly 3000,,, so in 2 4-hour periods of time you could have made over $6000..... But I would guess that at the beginning Trader is going to get in trouble with this without some more screen time and observation if your trades at the end of the day when you start doing an analysis from early that day. Actually on today you could have been long then short then long and it looks obvious it is very stressful trading that way. So look at it, get a feel and whenever you do don't over trade it's very important to avoid drawdowns because if you are starting and you try to train hot markets that are going to trade in both directions and you blow it and you get an 8000 drawdown... You will never appreciate the attributes of the market because it's very difficult to get back and trade when you're not prepared for the volatility. And it's very hard psychologically to go long and then go short and vice versa... But the patterns the market. And all the reversals would have minimal drawdowns and none of them would have been touched in this particular Market earlier today.

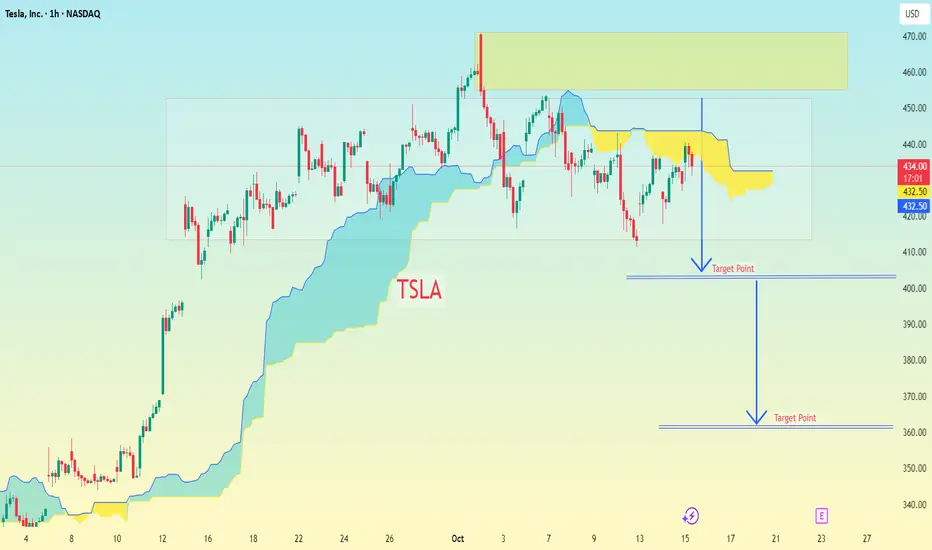
TSLA with Ichimoku Cloud...TSLA with Ichimoku Cloud and projected target points drawn below the current price.
Let’s break it down:
Current price on chart: around $434
Yellow zone (resistance): roughly $445–$465
First target line drawn: around $405–$410
Second (lower) target line drawn: around $365–$370
📊 Interpretation (based on my chart):
Target Level Approx. Price Meaning
1st Target $405–$410 Short-term support / take-profit zone
2nd Target $365–$370 Deeper correction / extended short target
⚠ Note:
These targets are based on my chart’s visual annotations, likely assuming price breaks below the Ichimoku cloud and moves toward lower support levels. This aligns with a bearish setup.
👉 Risk Management Tip:
If entering short, a stop loss just above the resistance zone ($450–$455) may be considered.
If entering long, these same levels can act as profit-taking or add-on zones.
a small dip before the moonI hope the market will retrace here and we will see the top of the market in 2026. Completing a whole market cycle.

TSLA Oct. 9 — Bulls Defending $430 Zone, Eyeing Break Above $444Tesla (TSLA) has been forming a constructive base near the $430 zone after reclaiming momentum from its recent dip. On the 15-minute chart, structure shows a clean BOS (Break of Structure) followed by a minor CHoCH around $437–$438 — indicating consolidation before a possible continuation move. The ascending intraday trendline remains intact, and price is currently holding above short-term liquidity levels.
MACD is curling upward again with momentum building, while the Stoch RSI has reset near the mid-zone and looks ready to push higher — signs that a bullish continuation could resume if TSLA maintains above $433.
On the 1-hour chart, the key HVL sits around $425, which also aligns with gamma support. Above, there’s a visible stack of gamma resistance layers between $442.5 and $452.5, topped by a major call wall near $457.5–$460. This range defines the next battleground for directional momentum.
Support and Resistance Levels:
* Immediate Resistance: $441.33 → $444.0
* Major Resistance (Gamma Wall): $452.5 → $457.5
* Immediate Support: $433.09 → $430.0
* Key Support Zone: $425 → $422
GEX & Options Sentiment (1H GEX Chart):
* The highest positive Call Gamma lies between $444–$457.5, suggesting an upside magnet if TSLA maintains strength.
* Strong Put Support sits at $425–$420, reinforcing the bullish floor from the recent rebound.
* IVR is low (27) and Calls dominate at 62%, indicating bullish skew but with room for volatility expansion if breakout volume increases.
* Gamma exposure shows positive slope above $440, meaning dealer hedging could amplify upside moves once that zone clears.
Trade Scenarios:
Bullish Setup:
* Entry: Above $441.5 breakout confirmation
* Target 1: $448
* Target 2: $452.5
* Stop-Loss: Below $432
* Rationale: Holding above $433 with bullish MACD and rising GEX bias confirms continuation toward $450 zone.
Bearish Setup:
* Entry: Below $430 breakdown
* Target 1: $425
* Target 2: $420
* Stop-Loss: Above $435
* Rationale: A failed retest at $438–$440 with divergence could trigger a short-term retrace to retest gamma support.
TSLA is in a critical consolidation phase. A break above $441.5 could trigger a bullish leg toward $450+, while losing $430 could open a short-term fade to $425. Bulls are defending key ground — but watch for volume confirmation before entering.
Disclaimer:
This analysis is for educational purposes only and does not constitute financial advice. Always do your own research and manage your risk before trading.
If anyone needs me to TA any stock, PM me.

TESLA LONGSLooking for price to sell off to price low of 152. If price shows bullish price action after liquidating low ( MSS+ retracement into FVG or ICT Breaker) i will be buying in. Alternative setup would be the same if price decides to sell off to the marked 2023 low.
Initial price targets will be Highs marked at 300$.

TESLA LONG JHON SILVERSLong on Tesla at these prices. Can see a retracement to 250$. Overall Bullish on Tesla. Worst case scenario we can see a short into sub-220$ region.
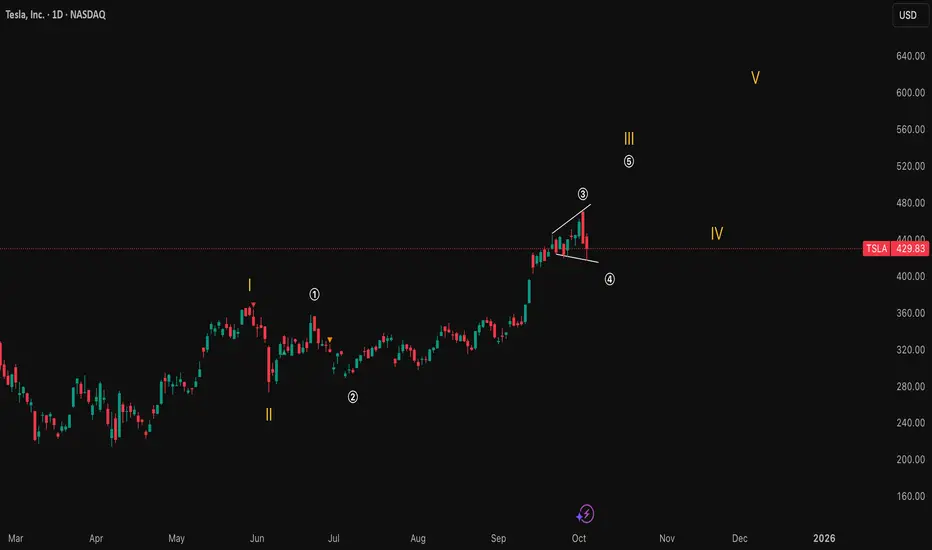
TSLA: A Disciplined MoverHello,
Tesla dances to a disciplined rhythm, and I can't get enough of it.
Target of wave 5 is typically between (570-630)$, and it is a profit-taking zone.
Happy trading.

This happened today TSLA 453.25 Bullish entry above 456.00/460.00 if the open is in this area. If the open is below 452.00, we can expect this to be the 440.00 area with a possible rebound, providing an upside opportunity. If the 440.00 level is lost, we can only enter bearishly below 436.00/432.00 (a possible downside target of 419.00) (a possible upside target of 488.54)
www.tradingview.com

This happened today TSLA 453.25www.tradingview.com
Bullish entry above 456.00/460.00 if the open is in this area. If the open is below 452.00, we can expect this to be the 440.00 area with a possible rebound, providing an upside opportunity. If the 440.00 level is lost, we can only enter bearishly below 436.00/432.00 (a possible downside target of 419.00) (a possible upside target of 488.54)

Tesla Approaching Key Resistance: Time to Position for a BreakouCurrent Price: $429.83
Direction: LONG
Targets:
- T1 = $445.50
- T2 = $460.00
Stop Levels:
- S1 = $420.00
- S2 = $410.00
**Wisdom of Professional Traders:**
This analysis synthesizes insights from thousands of professional traders and market experts, leveraging collective intelligence to identify high-probability trade setups. The wisdom of crowds principle suggests that aggregated market perspectives from experienced professionals often outperform individual forecasts, reducing cognitive biases and highlighting consensus opportunities in Tesla.
**Key Insights:**
Tesla continues to dominate the EV (electric vehicle) market with innovations in autonomous driving and battery technology. Analysts are focusing on the recent announcements about significant manufacturing cost reductions and Tesla's newly introduced Cybertruck deliveries, which are expected in Q4 2025. These developments solidify its position as a leader and provide a catalyst for improving margins. Furthermore, the continued expansion into the energy storage market will diversify revenue streams, offering resilience to economic variations.
From a technical perspective, Tesla is approaching a critical resistance level near $435. If broken, this level could trigger a significant upward momentum as bullish sentiment builds. The recent holding of support above $420 suggests strong institutional confidence in Tesla’s upward potential.
**Recent Performance:**
Tesla’s stock has risen approximately 15% over the last three months, recovering from a dip earlier this year when macroeconomic uncertainty temporarily pressured high-growth tech firms. The stock has shown consistent strength as it rebounded from the $380 level after weaker-than-expected Q2 earnings but has since been buoyed by a positive outlook for Q4. Tesla has seen increased volume in recent weeks, signaling growing trader attention.
**Expert Analysis:**
Many equity analysts remain bullish on Tesla's mid-term trajectory. The company’s recent Q3 earnings report (released last month) revealed impressive year-over-year growth in energy division revenues, while automotive gross margins remained steady despite pricing pressures in China. Technical strategists view the current consolidation just below $435 as preparation for the next leg upwards. Tesla's RSI (Relative Strength Index) remains below overbought levels, leaving room for additional bullish momentum.
**News Impact:**
The announcement of Tesla's advancements in Full Self-Driving (FSD) technology has renewed market interest. Achieving regulatory approval for autonomous driving in key markets like Europe and the U.S. could dramatically expand Tesla's total addressable market. Meanwhile, Elon Musk’s comments on Tesla’s potential new factory locations have reignited speculation about the company’s growth strategy, fueling optimism among investors.
**Trading Recommendation:**
Given Tesla’s strong fundamentals, positive technical setup, and upside potential, initiating a long position at current levels may lead to substantial gains. Traders should watch for a break above $435, which could pave the way for a move to $445.50 (T1) and possibly $460 (T2). Use stops at $420 (S1) and $410 (S2) to manage downside risk effectively. Tesla's position as a market leader, combined with its technical momentum, makes this an attractive opportunity for the current trading window.
Do you want to save hours every week? Register for the free weekly update in your language!
TSLA - False breakout?TSLA back in the april channel.
In this market everything is anchored from low of April I feel and I have drawn a vwap band from the April lows which spans from 316-333 which can be the next bounce zone in case price pulls back , this is where TSLA made base before the next leg up.
Most likely price may revisit $400 area to gap fill and also has a anchored vwap from last swing low around 405.
So far seems like a false breakout from the channel and volume has really picked up to the downside in recent days. New base can be formed around 400 mark if thing stabalize for next leg up in coming days, lets see as its tsla.
For more chart requests please ping me on X - vickg81.

TSLA: Last chance under $500, $400Nice run up. We're still in a overall bull market, which Tesla has only started becoming a part of.
We could see a gap fill (seen on the daily and weekly chart) at ~$395. Potentially even a retracement to ~$350.
However, we'll eventually see the stock above 600 in the next year or more. Don't know when.... Could ltake more time, but I think the "more affordable" Model Y will be the first catalyst before any Robotaxi revenue comes in.
Strategically it makes sense to release the more affordable EV after the tax credits go away. No other EV manufacturer OR legacy auto company can produce and sell vehicles as cheaply as Tesla without it.
Haters truly will hate it.

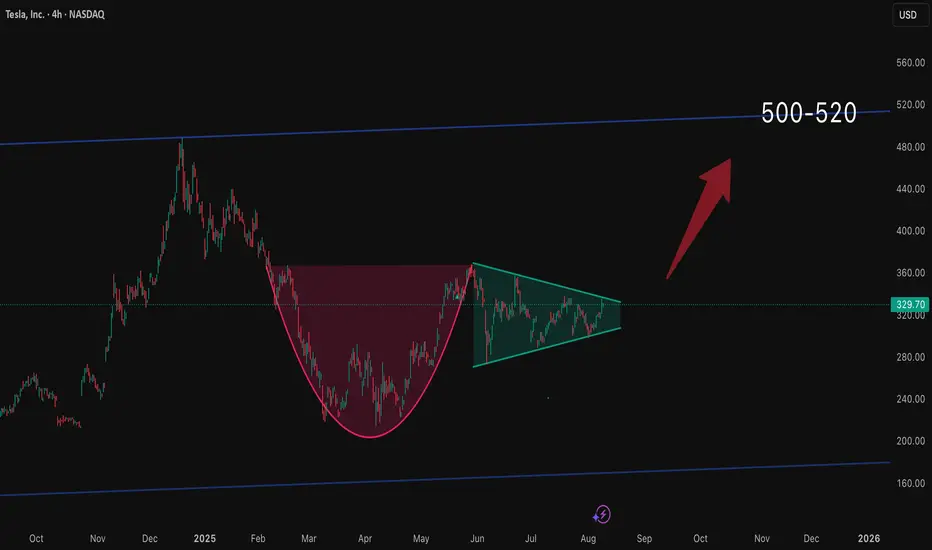
wave 4 in a wave 3 I’m predicting this path for Tesla — we’re in wave 4 of a larger wave 3, so it might get a bit volatile before continuing upward toward 500–520 . We’ll see what happens ☀️
Did your Furu have this one? #DIAMOND #Island #WhiteBoySummerHighlighted the diamond for clarity in case anyone had doubts ;)
Last post of June, need 1k followers to come back.
200C 7/19 = Free Vacation
- Prophecies

TSLA testInvestment Strategy: Rebalances quarterly to maintain exposure to high-momentum stocks while capping individual holdings at ~5% to manage risk. This factor-based approach aims to outperform the broader S&P 500 over the long term by riding momentum wav
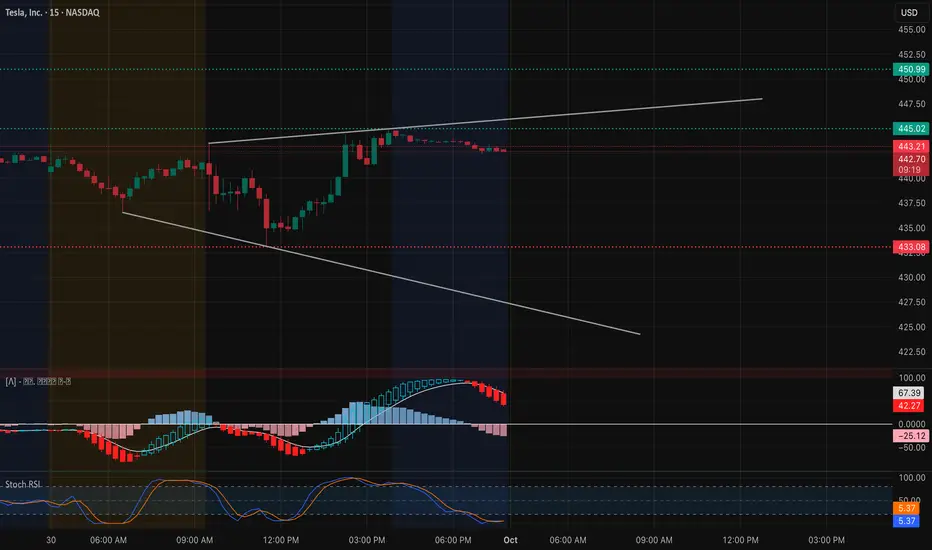
TSLA Oct. 1 – Eyeing the $450 Breakout Zone! 🚀Intraday View (15-Min Chart)
TSLA rebounded sharply intraday and is now consolidating around $443–$444 just under key resistance. Price action has formed a rising channel, but momentum is stalling.
* Support Levels: $442.20, $438.60, $433.08
* Resistance Levels: $445.00, $450.99, $452.50
* Indicators: MACD histogram rolling red, showing fading momentum. Stoch RSI sitting low, suggesting room for a relief bounce.
📌 Intraday Thought (Oct. 1): If $442 holds, expect attempts to push into $445–$450. A breakdown below $442 could trigger a move back toward $438 and $433. Scalpers can play long near $442 support with tight risk, or fade $450 resistance if tested and rejected.
Options & Swing View (1H + GEX)
Gamma exposure shows critical levels:
* Upside: Heavy call wall at $450–$452.5, with more stacked toward $465–$470.
* Downside: Strong put support near $432–$425, deeper wall at $417.5.
This suggests TSLA is coiling between $432–$450. A breakout over $450 could ignite momentum into $465–$470, while losing $432 risks a slide back to $425.
* Bullish Play (Oct. 1): Calls or debit spreads targeting $450 → $465 if price breaks $445 with volume.
* Bearish Hedge: Puts toward $432 → $425 if $442 breaks down.
* Neutral Play: Iron condor between $432–$452 to capture premium during consolidation.
My Thoughts (Oct. 1)
TSLA is parked right below a heavy $450 gamma wall. If bulls clear $445 and sustain, we could see an explosive push toward $465+. But failure to hold $442 opens the door to retesting $432 quickly. For now, this is a make-or-break level, and I’d keep risk management tight with options plays centered around the $450 breakout.
Disclaimer: This analysis is for educational purposes only and does not constitute financial advice. Always do your own research and manage risk before trading.
Is the wait over?Time to rise and shine off the couch? Cup and handle will hopefully be complete soon.
Preferably want to see the price above 370 for it to be valid.
But already at 340 it’s a mini buy signal.
We’ll see what the future brings us.
☀️🫶
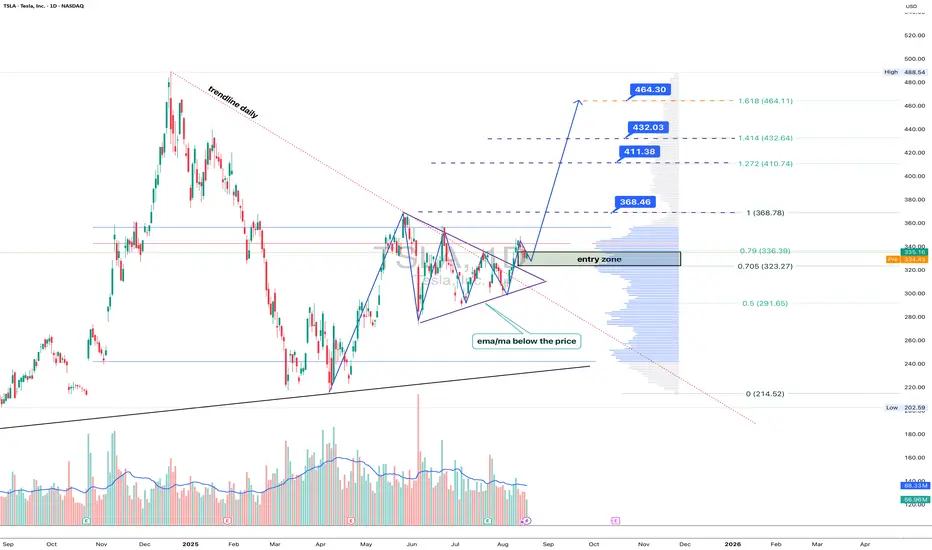
Tesla: breakout mode, Elon’s rocket fuel for the chartTechnically , Tesla broke out of a symmetrical triangle while holding above EMA/MA supports, which confirms bullish control. The breakout unlocks targets at 368.46 (Fibo 1), followed by 411.38, 432.03, and the 1.618 extension at 464.30. Volume profile confirms strong accumulation below, leaving the upside path less crowded.
Fundamentally , Tesla keeps investor attention alive. EV sales stabilized, but the focus has shifted to AI and robotaxi — Musk’s latest promises of disruption. With Fed rates peaking and yields easing, growth stocks regain momentum. Risks remain from Chinese competitors, yet Tesla’s margins are still leading the industry.
Tactical plan : entry zone stands at 323–336. As long as price holds above it, buyers target 368.46 → 411.38 → 464.30. A break below 323 would flip the bias back toward 291.
Bottom line: Tesla’s chart looks ready for lift-off. Musk might be dreaming of Mars, but for now, bulls are happy if he just launches the stock a few hundred dollars higher.
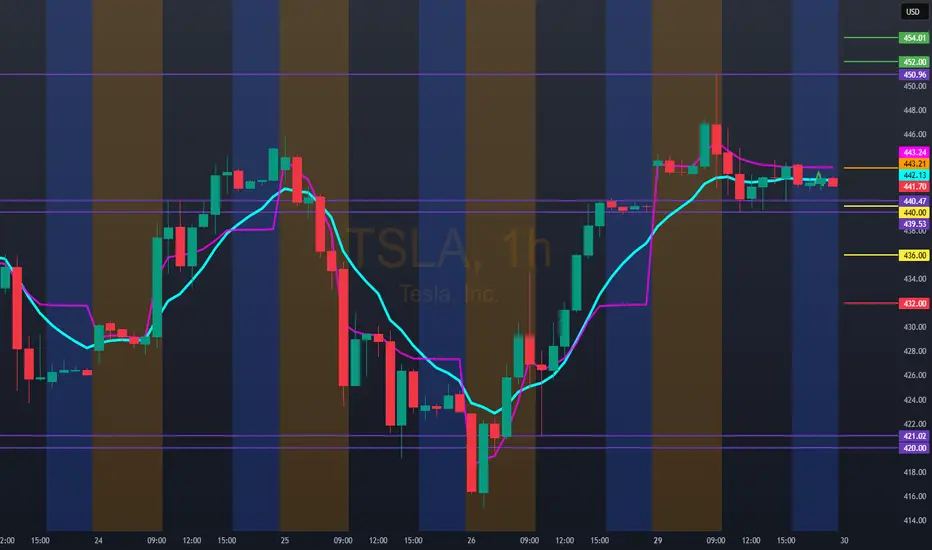
Hello trader, for tomorrow, 9/30/25, TSLA: 443.21Bullish entry above 454.00 with possible upside projection to 488.54, stop below vwap
Bearish entry only below 432.00. We could experiment with a rebound zone at 440.00/436.00, stop above vwap

#SUPERUSDT Long#SUPER/USDT Long
Leverage: 50x
Entry Targets: 0.5403
Take-Profit Targets:
0.6000
0.6400
0.6600
0.6800
0.7161
Stop-Loss: 0.5160
Trading comes with high risk; limit your funds to 2% per trade.
