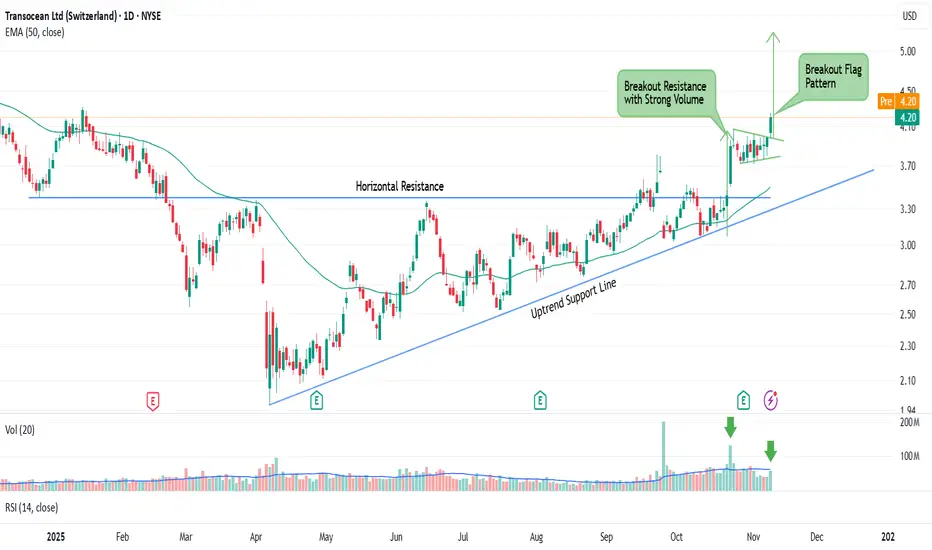
Transocean Ltd (RIG) – Bullish BreakoutSummary:
RIG has broken out of long consolidation and strong resistance at 3.40 with high volume , showing strong buyer interest.
After the breakout, price pulled back and formed a flag pattern , then broke out again yesterday , confirming bullish continuation .
Trading Plan:
Entry: 4.2
Next report date
—
Report period
—
EPS estimate
—
Revenue estimate
—
−2.500 CHF
−465.00 M CHF
3.20 B CHF
948.99 M
About Transocean Ltd (Switzerland)
Sector
Industry
CEO
Keelan I. Adamson
Website
Headquarters
Steinhausen
Founded
1953
ISIN
CH0048265513
FIGI
BBG008973JB0
Transocean Ltd. engages in the provision of offshore contract drilling services for oil and gas wells. It also owns and operates offshore drilling fleets such as ultra-deepwater, harsh environment, deepwater, and midwater rigs. The company was founded in 1953 and is headquartered in Steinhausen, Switzerland.
Related stocks
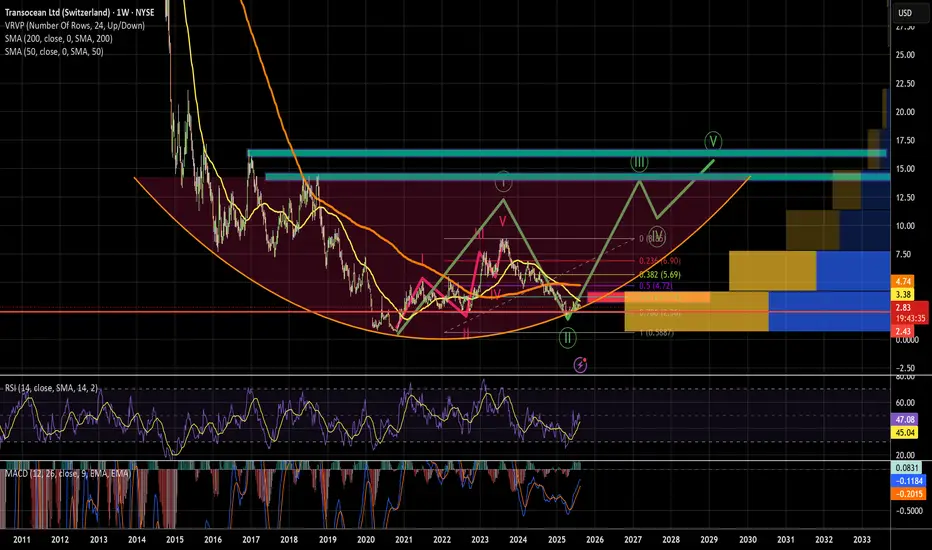
$RIG approaching 200W moving averageNYSE:RIG is approaching its 200-week smoothed moving average on unusually strong volume. I will be watching for a clear break and support on it. The last time this occurred, the stock doubled. With growing recent volume, a strong uptrend appears to be in play. This narrative could develop significa
$RIGlooking great risk vs reward.
Be mindful this is a weekly chart and this name moves slowly. We need them to meet their operational commitments including fleet utilization which may be a trigger for this wave 3.
MACD weekly approaching 0 line while we are at a bottom of a potential wave 2. Moving a
Hidden Support on RIG: Next Big Move?🔹 Trade Summary
Setup:
Price pulling back to ascending trendline support
Testing major support near $2.58
Analyst 1-year target: $3.76
Entry:
Above today's high of $2.64 (on confirmation of bounce from trendline)
Stop-loss:
Below $2.40 (clear break of trendline)
Targets:

shorty short technical onlyshorty short technical only
take my monay
all i see is the technicals working wonders

RIG Mega Profits SecuredRIG is a high beta oil stock. We secured profits today and looking for another entry.
With the recent breakout and upside momentum in oil, this name caught a massive bid.
Crude oil has seen a sharp rise in just the last week and shaping up for a continuation move higher.
If this breakout holds

RIG Entry Now?Looks like a great entry point. Good volume with a solid move up in price. MACD starting to cross. Short and long RSI in 30s and heading up. TTM Squeeze showing positive cross up. Good option volume. Lets hope for a strong move on open and be ready to jump.

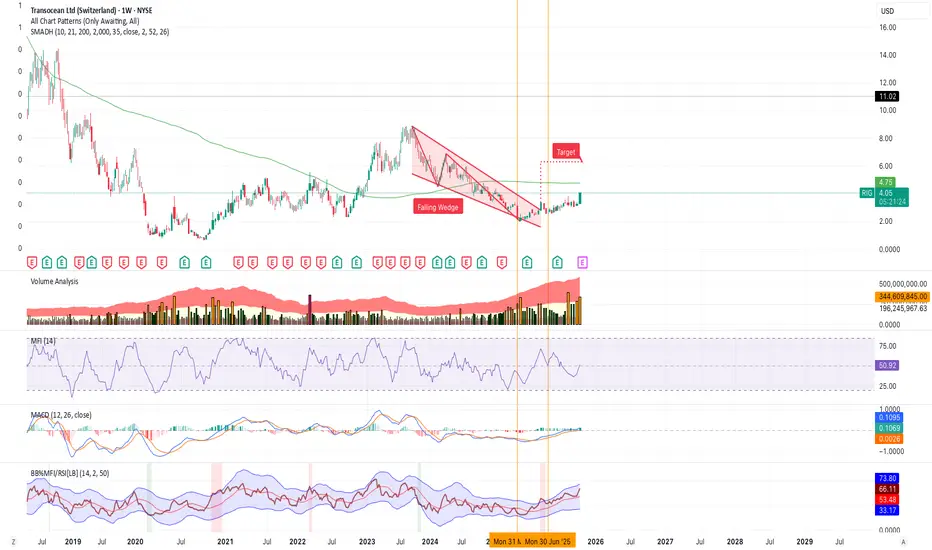
TransoceanHey guys, Transocean has about a 10X to the top of the bear fib channel. Then it decides if it wants to break out of the channel, or get rejected. I think breakout. I could go into the fundamentals ad neaseum, but it doesn’t really matter if the chart says so, it is so.

$RIG ( Bullish ) will the 618 hold? NYSE:RIG bouncing off this support now for 3 months.. will it hold?

RIG (Transocean) – Potential Reversal?
Technical Overview
• Current Trend: RIG has been in a clear downtrend since September 2023, as confirmed by Dr. Elder’s Triple Screen framework. However, recent technical signals suggest the trend is losing steam.
• Weekly Timeframe:
The MACD histogram is showing a bullish divergence, ind

See all ideas
Summarizing what the indicators are suggesting.
Neutral
SellBuy
Strong sellStrong buy
Strong sellSellNeutralBuyStrong buy
Neutral
SellBuy
Strong sellStrong buy
Strong sellSellNeutralBuyStrong buy
Neutral
SellBuy
Strong sellStrong buy
Strong sellSellNeutralBuyStrong buy
An aggregate view of professional's ratings.
Neutral
SellBuy
Strong sellStrong buy
Strong sellSellNeutralBuyStrong buy
Neutral
SellBuy
Strong sellStrong buy
Strong sellSellNeutralBuyStrong buy
Neutral
SellBuy
Strong sellStrong buy
Strong sellSellNeutralBuyStrong buy
Displays a symbol's price movements over previous years to identify recurring trends.
T
RIG.HH
Transocean International Limited 9.35% 15-DEC-2041Yield to maturity
9.84%
Maturity date
Dec 15, 2041
T
USG90073AM2
Transocean International Limited 8.5% 15-MAY-2031Yield to maturity
8.78%
Maturity date
May 15, 2031
US893830AT6
Transocean International Limited 6.8% 15-MAR-2038Yield to maturity
8.77%
Maturity date
Mar 15, 2038
T
US893830AF6
Transocean Sedco Forex, Inc. 7.5% 15-APR-2031Yield to maturity
8.58%
Maturity date
Apr 15, 2031
T
RIG.GL
Transocean Offshore Texas, Inc. 8.0% 15-APR-2027Yield to maturity
7.24%
Maturity date
Apr 15, 2027
T
RIG6193494
Transocean International Limited 7.875% 15-OCT-2032Yield to maturity
7.13%
Maturity date
Oct 15, 2032
T
RIG.GK
Transocean Offshore Texas, Inc. 7.45% 15-APR-2027Yield to maturity
6.77%
Maturity date
Apr 15, 2027
T
TOTF5524610
Transocean Titan Financing Ltd. 8.375% 01-FEB-2028Yield to maturity
—
Maturity date
Feb 1, 2028
T
RIG5513904
Transocean International Limited 4.625% 30-SEP-2029Yield to maturity
—
Maturity date
Sep 30, 2029
See all TOJ bonds
Frequently Asked Questions
The current price of TOJ is 3.200 CHF — it has decreased by −1.85% in the past 24 hours. Watch Transocean Ltd. stock price performance more closely on the chart.
Depending on the exchange, the stock ticker may vary. For instance, on BX exchange Transocean Ltd. stocks are traded under the ticker TOJ.
TOJ stock has risen by 7.14% compared to the previous week, the month change is a 33.72% rise, over the last year Transocean Ltd. has showed a −16.30% decrease.
We've gathered analysts' opinions on Transocean Ltd. future price: according to them, TOJ price has a max estimate of 3.97 CHF and a min estimate of 2.14 CHF. Watch TOJ chart and read a more detailed Transocean Ltd. stock forecast: see what analysts think of Transocean Ltd. and suggest that you do with its stocks.
TOJ stock is 4.59% volatile and has beta coefficient of 1.65. Track Transocean Ltd. stock price on the chart and check out the list of the most volatile stocks — is Transocean Ltd. there?
Today Transocean Ltd. has the market capitalization of 3.61 B, it has increased by 4.78% over the last week.
Yes, you can track Transocean Ltd. financials in yearly and quarterly reports right on TradingView.
Transocean Ltd. is going to release the next earnings report on Feb 23, 2026. Keep track of upcoming events with our Earnings Calendar.
TOJ earnings for the last quarter are 0.05 CHF per share, whereas the estimation was 0.03 CHF resulting in a 69.59% surprise. The estimated earnings for the next quarter are 0.06 CHF per share. See more details about Transocean Ltd. earnings.
Transocean Ltd. revenue for the last quarter amounts to 818.80 M CHF, despite the estimated figure of 804.92 M CHF. In the next quarter, revenue is expected to reach 814.60 M CHF.
TOJ net income for the last quarter is −1.53 B CHF, while the quarter before that showed −744.21 M CHF of net income which accounts for −105.81% change. Track more Transocean Ltd. financial stats to get the full picture.
No, TOJ doesn't pay any dividends to its shareholders. But don't worry, we've prepared a list of high-dividend stocks for you.
As of Nov 14, 2025, the company has 5.8 K employees. See our rating of the largest employees — is Transocean Ltd. on this list?
EBITDA measures a company's operating performance, its growth signifies an improvement in the efficiency of a company. Transocean Ltd. EBITDA is 1.03 B CHF, and current EBITDA margin is 31.64%. See more stats in Transocean Ltd. financial statements.
Like other stocks, TOJ shares are traded on stock exchanges, e.g. Nasdaq, Nyse, Euronext, and the easiest way to buy them is through an online stock broker. To do this, you need to open an account and follow a broker's procedures, then start trading. You can trade Transocean Ltd. stock right from TradingView charts — choose your broker and connect to your account.
Investing in stocks requires a comprehensive research: you should carefully study all the available data, e.g. company's financials, related news, and its technical analysis. So Transocean Ltd. technincal analysis shows the buy rating today, and its 1 week rating is neutral. Since market conditions are prone to changes, it's worth looking a bit further into the future — according to the 1 month rating Transocean Ltd. stock shows the sell signal. See more of Transocean Ltd. technicals for a more comprehensive analysis.
If you're still not sure, try looking for inspiration in our curated watchlists.
If you're still not sure, try looking for inspiration in our curated watchlists.