Potential Top on the daily for a swift pullbackJSK has run over 350% without forming a daily higher low since Sept. 8th (~1.5 months and 31 trading days). This move has gone absolutely parabolic and hasn't formed support during that time. Currently we have the highest sell candle ever on the hourly showing a potential volume climax for the top. Also on the 4hr chart we have built up a lot of bearish divergence over the past 3-4 weeks likely to print a reversal candle with massive volume. Keep in mind before the run up this use to trade on average ~$8 million in dollar volume. We trade over $2 BILLION yesterday in dollar volume and today's volume is exceeding that with selling. As far as technical indicators go, the weekly was at a high of 92 and daily was flirting with 90 yet again. I have never witnessed a chart go this long in my over 3 years of trading without forming daily higher lows. With a lack of support built on the run up, I anticipate a very heavy pull back on this name.
Running fib retracements from our last daily higher low when this whole impulsive move began, we can look to some levels. Also note the bearish divergence built up on the daily chart. Look to at minimum $62.98 for the first area of possible support, if not we go much lower. Too much bearish divergence with zero support established on daily.
Trade ideas

JKS - too good to be trueAfter recommending NYSE:JKS for long term purchase last November, idea went trully ballistic in recent months making around +500% since the time of recommendation.
Despite such price increase, company still does not seem particularly expensive (it was a bargain in low teens) and high purchasing volume also hints that trend higher may continue for years to come.
However, short term wise, JKS is clearly very overbought, and decent correction may ensue shortly. looking for spots to take some profits off the table should be priority strategy in the upcoming weeks.

JKS:NYSE - JINKOSOLAR HOLDING - Strong runSolar stock running particularly hot. Up 200% over the last month. Be interesting to see how long it run, and how big it reverses, but has certainly been pretty steady over the last month. Could be worth a watch.


JKS - HH and working on the HLwith broader market consolidation, JKS is reacting the Diamond performance levels and provides reasonable options spreads.


$JKS JinkoSolar Overextended - Bearish Options Activity$JKS JinkoSolar Holding Co. - RSI and volume trending down after a huge parabolic runup recently. Expecting a near term retrace sub-$50.
Keep a close eye on the 20d ema line on the hourly chart. This has held up as support this entire run. A break below this line will confirm the downward move is underway.
Recent Bearish Options Activity:
15k $55.00 strike (OTM) 10/16 puts traded last Friday (7x OI) for $2.4M in premium.
Near term target: $44-$48 range

JKS - Tariff News and the chart held upprovided a challenging Puts play with a 30 minute pennywick hammer as a fake-out. Chart provided a perfect backtest and go before giving back the gains and returning the mid-channel.
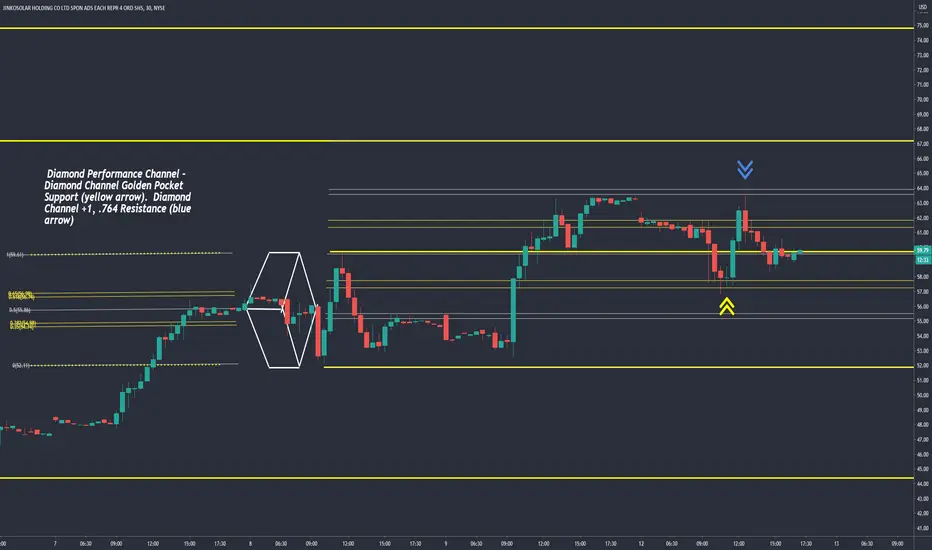
JKS - Diamond Performance Channel Solar was the best performing sector of the previous week - scouting consolation on tariff news. being careful not to be too early with potential puts.

JKSSolar sector is absolutely hot right now. Got Shaken out on this trade earlier...and just took off after shake off.

JKS Elliott Wave UptrendMy Elliott Wave for JKS. thinking we see Wave 3 next week which will be larger than this last run up.

JINKOSOLAR JKS 50$ before end of octoberJINKOSOLAR 50$ before end of october. It's going to 50$ in 7 days , they are selling massively in Europe due to new green policies and anti covid recovery policies.
Any market crash, could make it retrace a bit, but overall 50$ is ensured soon or later.

It's Time To Short SolarTake a look at the chart of $TAN and tell me it's not overextended right now. JKS is the biggest offender and I'm looking to buy some puts on this insane move. Completely unsustainable and will see lower prices from here.

Looking for a topJKS is now up over 137% since its last daily higher low. This straight up daily trend has gone on for almost an entire month now with the daily RSI at 90. We have built up 4hr and 1hr bearish divergence. Looking for an intermediate term pull back for days/weeks to set our daily higher low in the mid $30's. Price target was upgraded to $32 post earnings report. This blew past that and now time to digest the move.


JKS: While OIL has been correcting for the longest time, Solar has taken off. On the cusp of wave 3, the sky is the limit.....

JKS: Is this a Descending Triangle?I am quite new to this.
Do we see a descending triangle at JKS? I am looking forward to your comments.

JinkoSolar Announces up to US$100 Million Share Repurchase ProgrJKS: JinkoSolar Holding Co., Ltd.
2020-03-12 05:15:00
JinkoSolar Announces up to US$100 Million Share Repurchase Program
