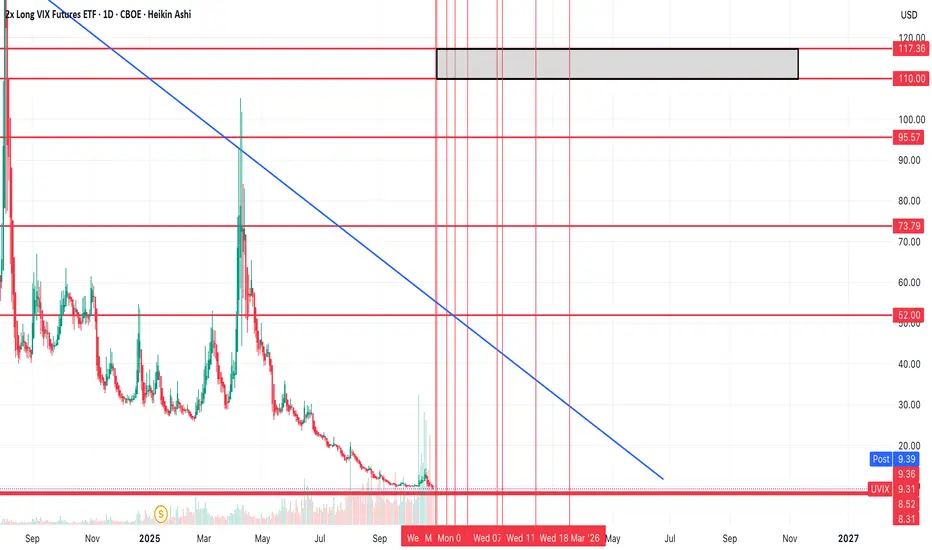
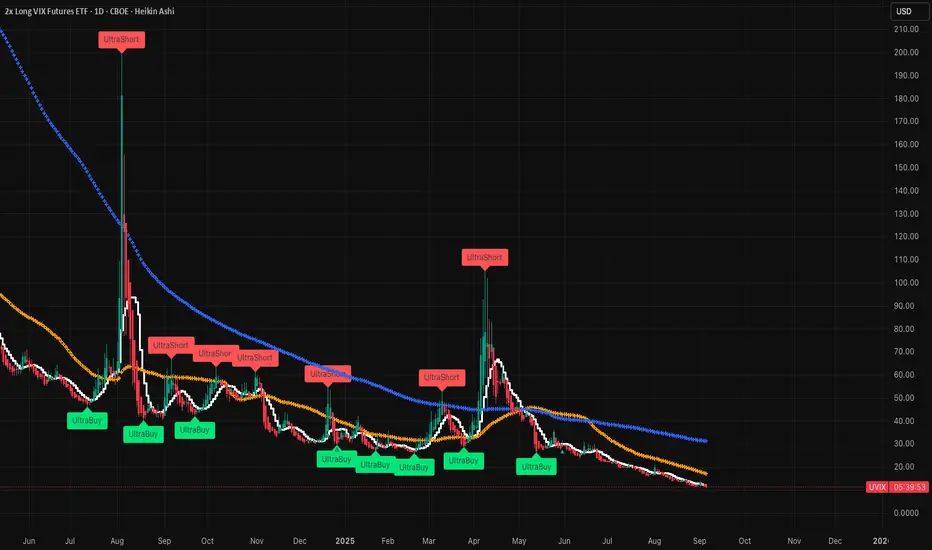
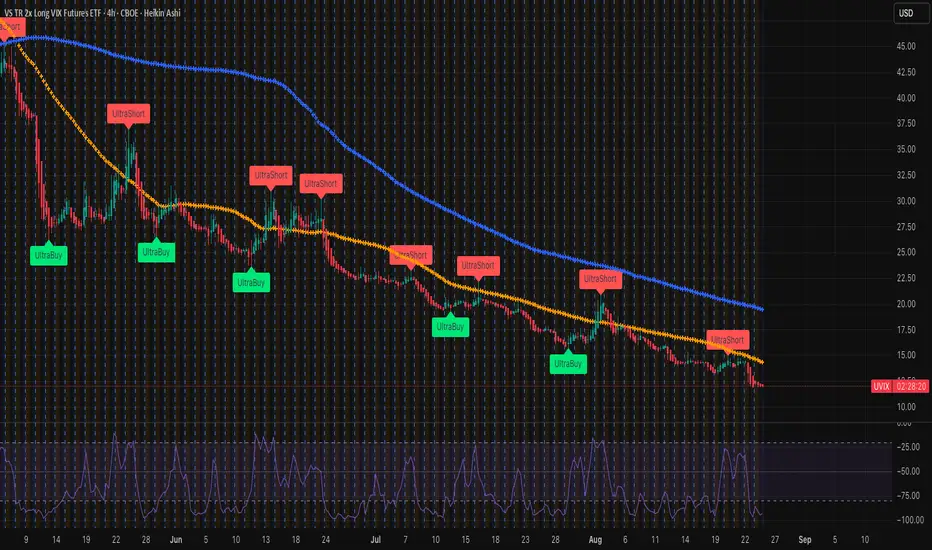
Almost time to bid for volatility? $UVIX over $100?I think we're getting really close to a large spike in volatility.
I think it's likely that vol will continue to fall into next week (and potentially a big longer into November), and if we can get down to the $8-$8.50 region, that there's strong support there and that could trigger a reversal.
SP
Key stats
About 2x Long VIX Futures ETF
Home page
Inception date
Mar 28, 2022
Structure
Commodities Pool
Replication method
Synthetic
Distribution tax treatment
No distributions
Income tax type
60/40
Max ST capital gains rate
27.84%
Max LT capital gains rate
27.84%
Primary advisor
Volatility Shares LLC
Distributor
Foreside Fund Services LLC
Identifiers
3
ISINUS92891H6062
UVIX offers daily 2x leveraged exposure to short-term VIX futures, designed to capture the implied volatility of the S&P 500, in a commodity pool wrapper. As a geared product, UVIX is designed as a short-term trading tool and not a long-term investment vehicle. Returns over holding periods greater than one day can be, and often are, significantly different from 2x. Like its peer products, UVIX does not deliver leveraged returns on the VIX index itself, but on front- and second-month futures contracts that are rolled daily. Structured as a commodity pool, investors will get K-1 at tax time but avoid the counterparty risk of an exchange-traded note.
Related funds
Classification
What's in the fund
Exposure type
Cash
Bonds, Cash & Other100.00%
Cash100.00%
Top 10 holdings
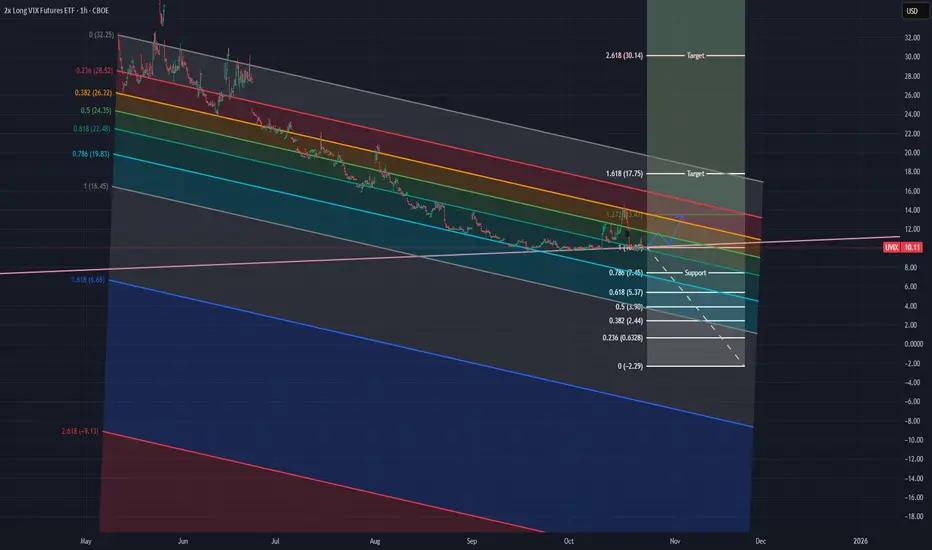
UVIX TargetsHello all,
I cooked up a way to find entries and exits on UVIX in the event of another volatility event, adjusted for decay. Let me know how I could improve the chart, I'm new to drawing diagonal fibs but thought I'd give it a shot.
x
Happy Trading!

UVIX.....making lemonade every timeThis is an awesome opportunity with a great upside potentially. NVDA and SPX are dropping hard and so is BTC. This is a great recipe for the VIX to spike.
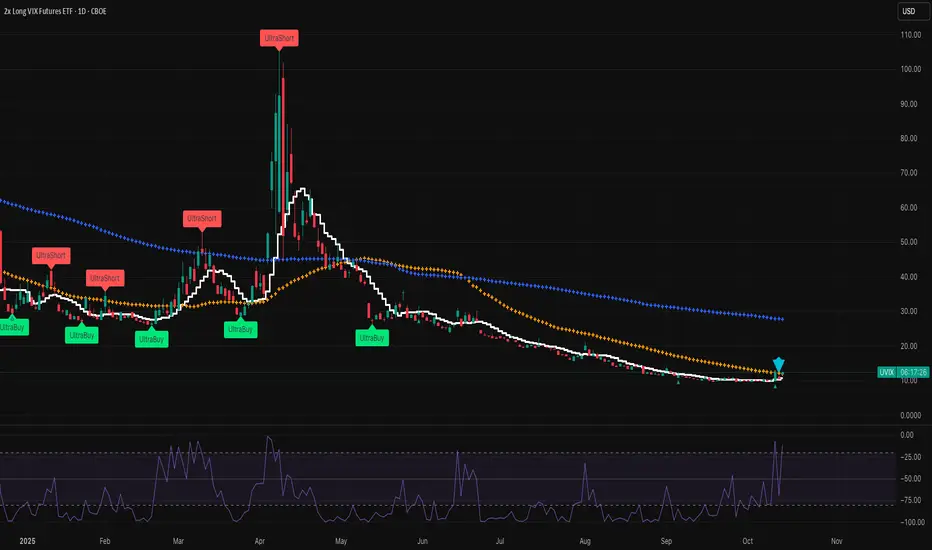
UVIX a lot more love to giveUVIX daily just crossed 50SMA. This is huge and a lot more upside esp. with all the f$ckery taking place. I have been warning on this for a few weeks now and made 20% today. Can easily go up to 30-40. Add SMA9 / Williams % range on 15mins. I have a few more premium, but that should help getting star

Picture perfect bull might be a bulletI'm the type of guy that likes to keep it simple, be patient, and let the chart come to me. I find it always gives the answers EVENTUALLY. In this case, have you ever seen anything scream liftoff as loudly? Here we have two bullish channels overlapping. After a failed breakout of the pink channel in

$UVIX and $UVXY and big moneyOn the daily chart CBOE:UVIX and CBOE:UVXY had the big money positions below our current trading price. That to me indicates a correction coming.
Do you have long term stops in place? Are you prepared for a slowdown in this bull market?

Potentially a nice upside to VIXHorrible jobs report and no clear sign that things will get better make it a great recipe for the VIX (UVIX) to spike. The glimmer of light from cutting interest rates likely won't make a dent in the economy. It's too little TOO LATE! A massive correction needs to happen and PE / CAPE ratios show th
Soon she will grow like a tree....UVIX (VIX proxy)Don't underestimate the VIX spike (UVIX is highly correlated), which has been sitting at a ONE YEAR low, which is extremely rare - only in times when a massive correction is about to happen! Frame this post bc historically VIX doesn't sit around 15 for too long (over 30 years). A major jump is unrav
See all ideas
Summarizing what the indicators are suggesting.
Oscillators
Neutral
SellBuy
Strong sellStrong buy
Strong sellSellNeutralBuyStrong buy
Oscillators
Neutral
SellBuy
Strong sellStrong buy
Strong sellSellNeutralBuyStrong buy
Summary
Neutral
SellBuy
Strong sellStrong buy
Strong sellSellNeutralBuyStrong buy
Summary
Neutral
SellBuy
Strong sellStrong buy
Strong sellSellNeutralBuyStrong buy
Summary
Neutral
SellBuy
Strong sellStrong buy
Strong sellSellNeutralBuyStrong buy
Moving Averages
Neutral
SellBuy
Strong sellStrong buy
Strong sellSellNeutralBuyStrong buy
Moving Averages
Neutral
SellBuy
Strong sellStrong buy
Strong sellSellNeutralBuyStrong buy
Displays a symbol's price movements over previous years to identify recurring trends.
Frequently Asked Questions
An exchange-traded fund (ETF) is a collection of assets (stocks, bonds, commodities, etc.) that track an underlying index and can be bought on an exchange like individual stocks.
UVIX trades at 5.94 USD today, its price has risen 0.85% in the past 24 hours. Track more dynamics on UVIX price chart.
UVIX net asset value is 5.90 today — it's fallen 40.56% over the past month. NAV represents the total value of the fund's assets less liabilities and serves as a gauge of the fund's performance.
UVIX assets under management is 354.59 M USD. AUM is an important metric as it reflects the fund's size and can serve as a gauge of how successful the fund is in attracting investors, which, in its turn, can influence decision-making.
UVIX price has fallen by −51.59% over the last month, and its yearly performance shows a −83.90% decrease. See more dynamics on UVIX price chart.
NAV returns, another gauge of an ETF dynamics, have fallen by −40.56% over the last month, showed a −41.29% decrease in three-month performance and has decreased by −84.70% in a year.
NAV returns, another gauge of an ETF dynamics, have fallen by −40.56% over the last month, showed a −41.29% decrease in three-month performance and has decreased by −84.70% in a year.
UVIX fund flows account for 809.20 M USD (1 year). Many traders use this metric to get insight into investors' sentiment and evaluate whether it's time to buy or sell the fund.
Since ETFs work like an individual stock, they can be bought and sold on exchanges (e.g. NASDAQ, NYSE, EURONEXT). As it happens with stocks, you need to select a brokerage to access trading. Explore our list of available brokers to find the one to help execute your strategies. Don't forget to do your research before getting to trading. Explore ETFs metrics in our ETF screener to find a reliable opportunity.
UVIX invests in cash. See more details in our Analysis section.
UVIX expense ratio is 2.19%. It's an important metric for helping traders understand the fund's operating costs relative to assets and how expensive it would be to hold the fund.
Yes, UVIX is a leveraged ETF, meaning it uses borrowings or financial derivatives to magnify the performance of the underlying assets or index it follows.
In some ways, ETFs are safe investments, but in a broader sense, they're not safer than any other asset, so it's crucial to analyze a fund before investing. But if your research gives a vague answer, you can always refer to technical analysis.
Today, UVIX technical analysis shows the sell rating and its 1-week rating is sell. Since market conditions are prone to changes, it's worth looking a bit further into the future — according to the 1-month rating UVIX shows the sell signal. See more of UVIX technicals for a more comprehensive analysis.
Today, UVIX technical analysis shows the sell rating and its 1-week rating is sell. Since market conditions are prone to changes, it's worth looking a bit further into the future — according to the 1-month rating UVIX shows the sell signal. See more of UVIX technicals for a more comprehensive analysis.
No, UVIX doesn't pay dividends to its holders.
UVIX trades at a premium (0.12%).
Premium/discount to NAV expresses the difference between the ETF’s price and its NAV value. A positive percentage indicates a premium, meaning the ETF trades at a higher price than the calculated NAV. Conversely, a negative percentage indicates a discount, suggesting the ETF trades at a lower price than NAV.
Premium/discount to NAV expresses the difference between the ETF’s price and its NAV value. A positive percentage indicates a premium, meaning the ETF trades at a higher price than the calculated NAV. Conversely, a negative percentage indicates a discount, suggesting the ETF trades at a lower price than NAV.
UVIX shares are issued by Volatility Shares LLC
UVIX follows the Long VIX Futures Index - Benchmark TR Gross. ETFs usually track some benchmark seeking to replicate its performance and guide asset selection and objectives.
The fund started trading on Mar 28, 2022.
The fund's management style is passive, meaning it's aiming to replicate the performance of the underlying index by holding assets in the same proportions as the index. The goal is to match the index's returns.