The latest gold trends and strategies:
Current Market Overview:
Gold is currently in a narrow-range consolidation phase. A clear range has formed between the daily-level resistance zone of 4080-4090 and the support level of 4000-4005. Both bulls and bears are locked in a stalemate at these key levels, warranting heightened alertness for a potential breakout. The specific intraday trading plan is as follows:
I. Core Technical Logic
Resistance and Support Analysis
Strong Resistance Zone: 4080-4090 (Previous highs + Bollinger Band upper line pressure)
Strong Support Zone: 4000-4005 (Psychological level + Dense moving average area)
Consolidation Signals: The RSI hovers around the neutral 50 level, indicating weak momentum; the Stochastic indicator is retreating from the overbought zone, suggesting short-term downward pressure.
Key Breakout Levels
Upside Breakout Signal: A sustained move above 4090 could open the path towards 4120-4150.
Downside Breakout Signal: A break below 3990 could trigger intensified selling, targeting 3960-3930.
II. Intraday Trading Strategy
Range Trading Strategy (Buy Low, Sell High)
Short Opportunity (Sell)
Entry Zone: 4080-4085
Stop Loss: 4095
Target: 4030-4000
Rationale: Resistance zone pressure + technical indicator correction needs.
Long Opportunity (Buy)
Entry Zone: 4000-4005
Stop Loss: 3990
Target: 4050-4080
Rationale: Psychological level support + potential bullish defense momentum.
Breakout Trading Strategy
Long on Upside Breakout
Condition: Price stabilizes above 4090 accompanied by increased volume.
Entry: Light position on a pullback to 4080-4085.
Stop Loss: 4070
Target: 4120-4150
Short on Downside Breakout
Condition: Price breaks below 3990 and shows weakness on any rebound.
Entry: Light position on a rebound near 4000.
Stop Loss: 4010
Target: 3960-3930
III. Risk Warning
Monitor intraday fluctuations in the US Dollar Index and geopolitical events, as these could break the technical range.
If the price action does not develop as anticipated (e.g., false breakout), exit positions promptly to avoid overtrading.
Summary:
Gold's current primary axis is the 4080-4000 range. Prioritize buying near support and selling near resistance with strict stop losses. If key levels are decisively broken, consider following the trend.
Trade ideas

XAUUSD PLAN🧭 Overall View
The chart shows possible two market scenarios drawn by the arrows — one bullish continuation and one bearish retracement before the next leg up.
🟪 Key Zones
Upper Supply/Resistance Zone (~4,160–4,180)
This is where the price has previously reacted and dropped.
Marked as a possible take-profit or rejection zone for buys.
Mid-range Zone (~4,120 area)
Price is currently testing this zone.
It’s acting as a short-term resistance or decision area.
Lower Demand/Support Zone (~4,060–4,070)
Previous low area where price reacted and bounced up.
Marked as a potential buy zone if price pulls back.
🔀 Two Possible Scenarios Drawn
1️⃣ Bullish Scenario (Main Plan)
Price may break above the mid-range zone (~4,120).
Then a pullback (retest) could happen toward that same zone.
After confirmation, price continues up toward the upper supply area (~4,180–4,220).
➡️ This shows the expectation of higher highs and structure continuation.
2️⃣ Bearish Scenario (Alternate Plan)
If the mid-zone rejects price,
Price could drop back down toward the lower support (~4,060).
Then from that demand area, a bounce up is expected toward the higher zone again.
➡️ This means the trader expects a deeper correction before continuation.

Gold market shorts (makes an exquisite move)📉 Gold Market Insight
Gold market makes an exquisite move, plunging for hourly shorts toward the 3990’s, signaling a short-term corrective phase within the broader bullish structure. follow for more insights , comment and boost idea

Gold price analysis October 23GOLD UPDATE – Prioritize SELL strategy in the short term
The downward correction of gold continued to extend in yesterday's session, showing that the sellers are still clearly dominant. In the short term, the downtrend may continue, leading the price to lower support zones.
In today's session, the strategy of waiting for SELL following the downtrend is still prioritized. The 4145 zone – the important resistance level of the previous session – will play a key role. If the price cannot overcome this zone and a price rejection signal appears, the possibility of further decline will be reinforced.
Trading strategy:
🔸 SELL trigger when there is a price rejection at the resistance zone of 4145 – 4227
🎯 Target: 3946

A SELL FIRST A sell around 4097-4102, Sl around 4125 or 1/3 , 1/4 of tp, and tp at 4000-3990, but bulls can come in to move price up anywhere around 3990-80 so it's best to close around 3990.

XAUUSD: Market Analysis and Strategy for October 22Gold Technical Analysis
Daily Resistance: 4380, Support: 3900
4-Hour Resistance: 4180, Support: 4000
1-Hour Resistance: 4160, Support: 4000
Technically, gold fell by $380, temporarily halting its decline near 4000. Technical indicators are recovering, and the market is taking a brief breather. Bull markets are prone to large swings, so it's unclear whether gold has truly reversed in the short term.
Gold has tested the 4000 support level twice. Watch for the continuation of the short-term downtrend. The moving average price has broken through the upward trend line in the short term, and the indicators are in a state of recovery, but the Bollinger Bands remain upward. The 4170/4180 levels on the daily chart are key. If they are successfully recaptured, the market is poised for a strong bullish resurgence. Otherwise, the market will continue to fluctuate downwards in the short term, looking for support. Focus on the 4000 level. If it breaks below, it will continue to move towards 3900.
Looking at the 1-hour chart, the candlestick pattern has broken below the neckline of the M-shaped top. Market bearish sentiment is being released, and indicators continue to move downward rapidly. The short-term bull-bear dividing line is between 4188 and 4208. Short-term rebound momentum is limited, and the NY market remains bearish.
Trading Strategy:
BUY: 4000-4005near
SELL: 4160near
SELL: 4178near
More Shares →
XAUUSDGold is currently testing a major confluence support zone, aligning with the daily inclining trendline and a previous demand area around the 4000–3980 region.
The recent sharp decline has brought price back into this key structure, where buyers previously stepped in. If this zone holds, we could see a potential bullish reversal toward the 4200–4250 area in the coming session
A strong bullish reaction from this level would confirm continuation of the broader uptrend. However, a clean break below 3980 could signal a deeper retracement.

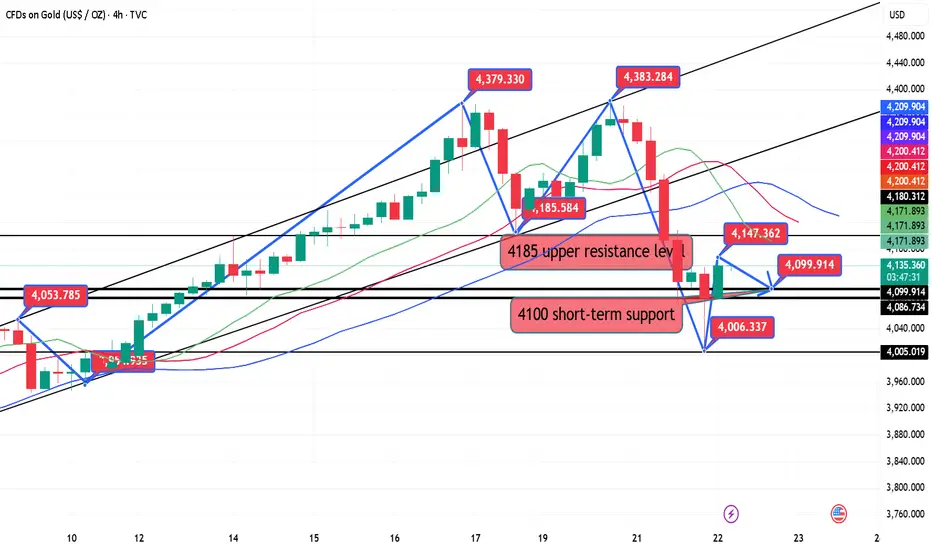
10.22 Gold continues to correctAfter forming a double top early Tuesday morning, gold has been experiencing resistance during Tuesday's Asian session, signaling a potential Waterloo. As of Wednesday's Asian session, gold hit a low of 4004 before rebounding above 4100, a bullish consolidation. Gold is currently trading in a range-bound environment. We continue to monitor the 4147-50 resistance level, which also marked the resistance level at midnight Tuesday. Gold prices retreated after hitting this resistance level several times last night. During the day, we will monitor the upward resistance level. If gold fails to break through, we will maintain a volatile trading strategy. We will prioritize shorting within this resistance level.
From the 4-hour chart, we are currently focusing on the 4147-4150 resistance level for the upside, while the -4085-4100 support level is expected to remain. If bulls fail to break through, gold will likely continue its range-bound correction. Trading strategies should prioritize trading within this range. In the intermediate range, we should be cautious about buying orders and wait patiently for key entry points. I'll provide detailed trading strategies during the trading session, so please stay tuned.
Gold Trading Strategy:
1. Short gold with a light position at 4147-4150, stop loss at 4156, target at 4085-4100. Hold if it breaks through!
2. Go long gold at 4085-4095, stop loss at 4078, target at 4145-50. Hold if it breaks through!
XAU/USD 22 October 2025 Intraday AnalysisH4 Analysis:
-> Swing: Bullish.
-> Internal: Bullish.
Analysis and bias remains the same as analysis dated 20 October 2025.
Price has printed as per previous intraday expectation by printing a bearish CHoCH which indicates, but not confirms, bullish pullback phase initiation.
Price is currently trading within an established internal range, however, I will continue to monitor price with regards to depth of pullback.
Intraday expectation:
Price to continue bearish, react at either discount of 50% internal EQ, or H4 supply zone before targeting weak internal high priced at 4,380. 990.
Note:
The Federal Reserve’s sustained dovish stance, coupled with ongoing geopolitical uncertainties, is likely to prolong heightened volatility in the gold market. Given this elevated risk environment, traders should exercise caution and recalibrate risk management strategies to navigate potential price fluctuations effectively.
Additionally, gold pricing remains sensitive to broader macroeconomic developments, including policy decisions under President Trump. Shifts in geopolitical strategy and economic directives could further amplify uncertainty, contributing to market repricing dynamics.
H4 Chart:
M15 Analysis:
-> Swing: Bullish.
-> Internal: Bearish.
Price has printed according to my analysis dated 20 October 2025 where I mention that price is to continue bullish, react at either premium of 50% internal EQ, or M15 demand zone, before targeting weak internal low priced at 4,185.910.
Price has printed a bearish iBOS and subsequently a bullish CHoCH to indicate, but not confirm bullish pullback phase initiation.
Price is now trading within an established internal range.
Intraday expectation:
Price to react at either premium of 50% internal EQ, or M15 demand zone, before targeting weak internal low priced at 4,004.280.
Note:
Gold remains highly volatile amid the Federal Reserve's continued dovish stance, persistent and escalating geopolitical uncertainties. Traders should implement robust risk management strategies and remain vigilant, as price swings may become more pronounced in this elevated volatility environment.
Additionally, President Trump’s tariff announcements, particularly against China, are expected to further amplify market turbulence, potentially triggering sharp price fluctuations and whipsaws.
M15 Chart:

XAUUSD: Bullish Rejection from Demand Zone - Ready for Upside?Following a period of consolidation/correction, GOLD is showing strong signs of a potential bullish reversal. We've identified a key support level at HTF DEMAND ZONE where significant buying interest has emerged, indicated by a strong weak rejection.
The price action has broken through it may likely do a small retest before the continuation. I'm looking for pullback into lower timeframe demand to follow the move.
Trade Idea:
Entry:
I’m looking to buy from LTF Demand Zone on a pullback, adding to go long when price enters this area. This lets me enter at a discount price while trading in direction of the newly established upward momentum.
Target:
The first Target Profit (TP) is set at the next supply Zone above, where selling pressure might emerge.
Stop Loss:
To control risk, the Stop Loss (SL) is placed just below the demand Zone.
If price drops below this area, it would invalidate the demand’s ability to hold, signalling a potential reversal.
Disclaimer: This is not financial advice. Always conduct your own research and manage your risk.
If this idea resonates with you or you have your own opinion, traders, hit the comments. I’m excited to read your thoughts!

Daily live trade with XAUUSD in 15m/30m/1h 20251022Daily live trade with XAUUSD in 15m/30m/1h 20251022

XAUUSD 20/10/2025Gold continues to trend up from 20/10/2025 with next targets at 4380 and 4475 respectively.

Up or down ?!Given the slope and momentum of the last wave and other evidence such as analysis and the number of last microwaves, it seems that it will reach $400 very soon and then $3,850.


Beyond the Chart - GOLD Market Technicals & Fundamentals CAPITALCOM:GOLD Short Bias 🔻
Market structure shows a confirmed BOS and CHoCH signaling a short-term shift in order flow.
Multiple FVGs stacked above highlight trapped liquidity zones with price reacting cleanly from those imbalances.
Current bias remains short-term bearish expecting a corrective leg toward 4,270 region to fill lower FVGs and potentially test the channel base before any new expansion.
A short retracement to mitigate upper FVGs remains possible but structure favors downside continuation for now.
🧠 Fundamentals:
CPI data and the Fed’s tone continue to drive sentiment. Stronger USD keeps pressure on gold while dovish signals could slow the drop. Geopolitical headlines may still trigger safe-haven demand swings.
No luck, just structure & precision. ⚡️

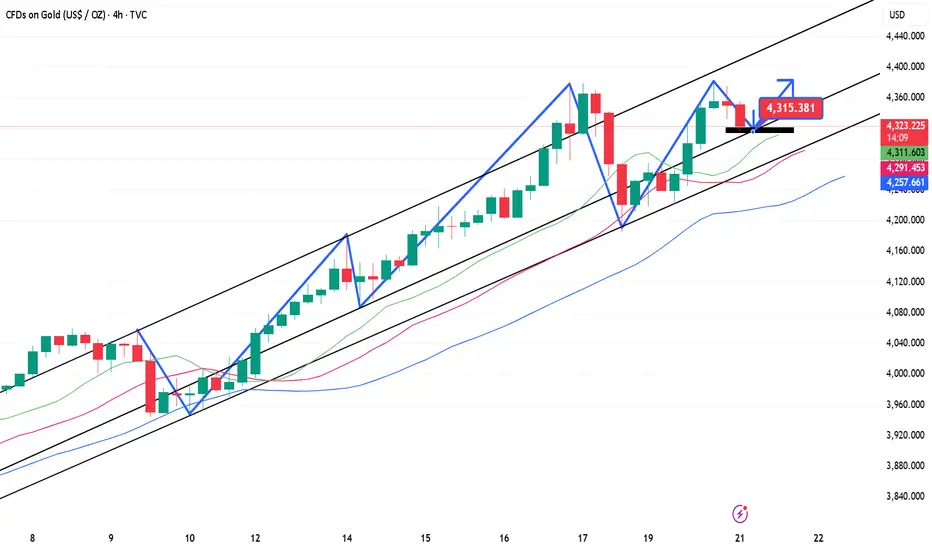
10.21 Gold correction continues to riseTechnical Analysis
The 4-hour MACD formed a death cross with shrinking volume, converging and flattening, indicating current volatility. The 4-hour candlestick chart also closed at a high level with a small Yin-Yang candlestick. The question now remains whether the candlestick chart will rise directly or retrace to the middle line near 4292. A direct rise would not fall below the morning's low of 4332.
The hourly chart began to fluctuate and decline after trading sideways this morning. Currently, attention is focused on support near 4332. The hourly MACD formed a golden cross with shrinking volume, and the STO indicator corrected downward, indicating a potential decline in the hourly chart. Current support on the hourly chart lies around 4332-4327 and 4302.
In summary:
The daily chart suggests today's decline is not over, and will likely reach at least 4300. The question now remains whether the 4-hour chart will fluctuate at a high level or rise directly. A direct rise would likely lead to a continued rise to around 4420, while consolidation at a high level would likely lead to a decline. Therefore, a short position around 4372-4377 is feasible. As for long orders, they need to be placed near 4267-4275, and the first long order can be placed near 4296-97.
Strategy:
Short near 4368-70, defend 4382, target 4335-4300-4270
Long near 4296-97 below, defend 4290, target 4330
Long near 4268-72 intraday, defend 4262, target 4300-4330-4370, etc.
Breaking above 4382 will directly lead to the 4410-4420-4480 line, so if it breaks above 4382 and then falls back to 4370, go long.
Like
GOLD Will Break ATH Again? Buy!
Hello,Traders!
GOLD Price is maintaining a strong bullish structure, consolidating just beneath its all-time high. Liquidity build-up above the highs suggests potential for an impulsive breakout, extending toward new record levels as buyers remain in full control. Time Frame 5H.
Buy!
Comment and subscribe to help us grow!
Check out other forecasts below too!
Disclosure: I am part of Trade Nation's Influencer program and receive a monthly fee for using their TradingView charts in my analysis.

Gold (XAUUSD) – Buy-the-Dip Play Still in MotionHello Goldies ✨
The weekly outlook couldn’t be cleaner — it’s still a buy-the-dip market.
Structure remains bullish across higher timeframes, though a quick liquidity sweep might come before the next leg higher.
Fun fact: every time the 4H RSI hits 82, gold has dropped roughly $200 (or 2,000 pips) afterward. They don’t teach that in trading school, do they? 😏
Here’s how it’s shaping up for the coming week 👇
📊 Weekly Outlook
Bias: Bullish continuation within an extended uptrend
Structure: Higher highs and higher lows remain firmly intact since mid-2024
Observation: This week’s candle shows a clean, healthy pullback within trend — a natural correction after a strong impulsive leg.
Key Levels
Support: 4,140–4,090 → weekly demand + imbalance fill zone
Resistance: 4,445–4,465 → first major weekly target / premium range
Expectations: As long as 4,090 holds, weekly momentum stays bullish with expansion potential toward 4,445–4,585.
📆 Daily Structure
Bias: Corrective phase within a broader bullish framework
Observation: Price has tapped into a daily order block sitting in the 61.8–78.6% fib zone — a discount region.
RSI: Cooling from overbought, showing a healthy reset for continuation.
Key Zones
Demand: 4,100–4,185
Supply: 4,445–4,465
Expectation: If demand holds, expect a bullish reversal candle early week targeting 4,445.
⏱ H4 Analysis
Bias: Bullish, with possible liquidity grab before expansion
Observation: Liquidity sits below 4,185 and 4,140 — a likely sweep zone before rally resumes.
Key Zones
Bullish OB: 4,140–4,185 → reaccumulation zone
FVG Magnet: 4,270–4,279 → upside target
Projection: A drop into OB → bounce → rally toward 4,379 → 4,445.
RSI: Recovering from oversold — momentum returning.
🕐 H1 Intraday Plan
Current: Hovering near 4,250, reacting to minor FVG
Bias: Short-term correction before final sweep
Scenario 1 (Preferred):
Bounce → 4,270–4,280 → sweep to 4,185–4,140 → bullish reversal → expansion toward 4,380 → 4,445
Scenario 2 (Aggressive Bullish):
If 4,215 holds, early push toward 4,380–4,445
🎯 Targets:
1️⃣ 4,379–4,380
2️⃣ 4,445
3️⃣ 4,585 (extension)
Below 4,090 → invalidates the bullish thesis
Summary (Oct 20–26)
Gold likely consolidates early in the week, teasing a dip into 4,185–4,140 before launching higher.
Momentum stays bullish above 4,090 — every dip into OBs or FVGs remains a buy-the-dip opportunity under SMC logic.
Expect reaccumulation before the next impulsive push toward 4,445–4,585.

AXUUSD Set trapsMany say that gold will be strengthened by a strong bearish correction
This is mostly not true
Gold will rise as soon as the market opens.
Don't waste the opportunity and think wisely

EXPECTATION FOR THE WEEK AHEAD Gold retraced down on Friday to create a higher low and tested a major zone around 4190 area, if it closed below 4190 it would have triggered more sells but it didn't and got rejected thereby closing above 4200 and this is a sign of bullish resumption and as a trader with fair understanding of the market the next thing to look for is a buy and the first best place to buy is at 4235-30 and hold it but if you don't want to really manage your trade, i suggest you close at 4335-40 and if it closes above 4365 then you target a buy again at 4365-60 area and hold for ever,
price could be rejected at 4340 or anywhere within the upper rectangular block and sell to close below 4190 for it to sell more for some days, so to prevent losing gained profits you can close at 4340 in order to be at the safer side incase the market decides to change to long term sells, if you have the courage to hold for then you can hold because the trend is bullish overall and i will update too to signal if it decides to change direction.
Clue: if Monday closes with a bullish candle especially above 4365 then we are buying from Tuesday going, but if it closes bearish on Monday (D1) then we will definitely sell from Tuesday going especially if it closes below 4190.

When everyone is bearish, I am looking for buying opportunities#XAUUSD OANDA:XAUUSD
Looking at the hourly chart, the gold price is fluctuating slowly downwards during the day. Although the bears have regained control of the market in the short term, from the perspective of the 4H cycle, we are still above the rising trend line. Therefore, our bullish attitude in the medium and long term remains unchanged. Any pullback before a significant break below the trend line should be considered a bullish entry opportunity.
In the short term, gold still has room to fall. Don't blindly chase the rise and sell the fall at this time. Wait patiently for it to fall back to the support and stabilize before participating in the transaction. As time goes by, the support points on the short-term trend line are constantly moving up. If the gold price in the European and American markets retreats to 4055-4040, we can try to go long on gold in batches with a light position, with the target looking at 4090-4115.

GOLD BEARISH BIAS RIGHT NOW| SHORT
GOLD SIGNAL
Trade Direction: short
Entry Level: 4,250.59
Target Level: 4,039.91
Stop Loss: 4,389.04
RISK PROFILE
Risk level: medium
Suggested risk: 1%
Timeframe: 12h
Disclosure: I am part of Trade Nation's Influencer program and receive a monthly fee for using their TradingView charts in my analysis.
✅LIKE AND COMMENT MY IDEAS✅

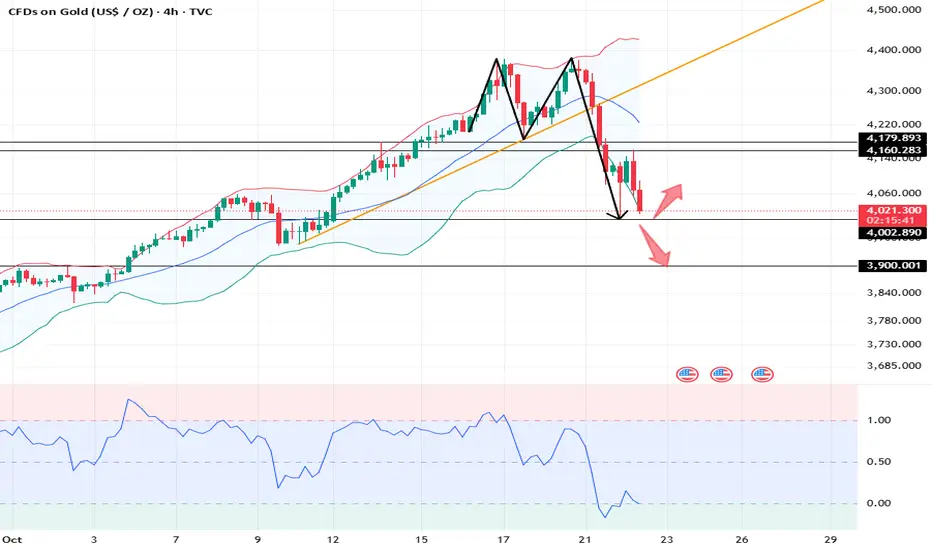
4100 Crumbles !!!Gold Could Drop Another $100!After gold rebounded to the area around 4155 yesterday, the rebound high point is gradually decreasing. It is still the main field of the bears. The rebound in the short term has obvious signs of pulling up shipments, so the rebound sustainability is not strong, and the decline of gold in the local structure is more eye-catching!
From the perspective of the pattern structure, gold remained below the bearish wedge in the short term, and after being suppressed by the bearish wedge, it once again formed a descending triangle in the short term. Under the suppression of the dual technical pattern structure, gold still has room to continue to fall, and it is possible to test the support area near 4000 again, and it is even expected to continue to the 3990-3980 area.
Gold has now fallen below the 4100 mark, and the market's bearish outlook will be further amplified. Any rebound in the short term will be a good opportunity to short gold. Therefore, in short-term trading, you can consider shorting gold appropriately when it rebounds to the 4095-4105 area, first aiming at the retracement target: 4060-4050.
