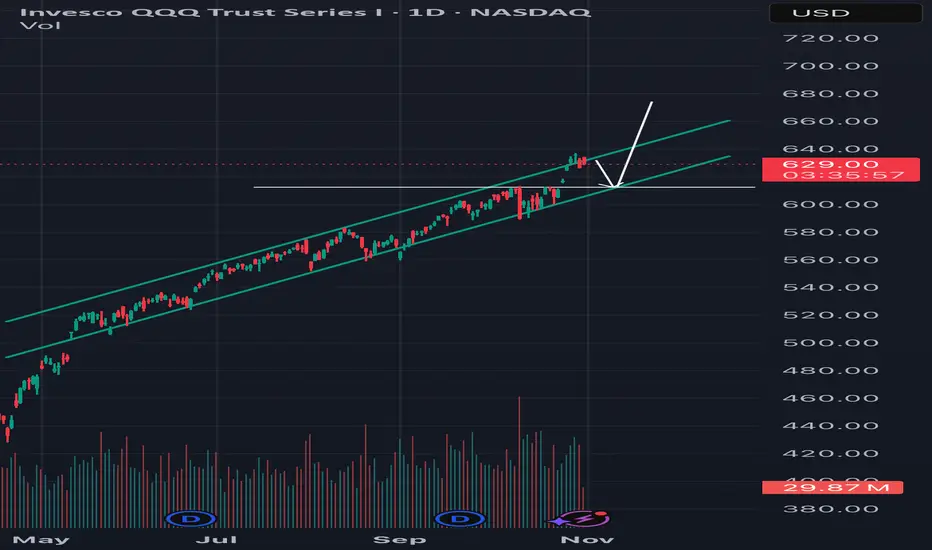
Qqq.. No crying in the casinoPullback from summer channel top to channel bottom is underway and almost finished..
But go to your weekly and zoom out a decade
Logarithmic
Zoomed in
So yes, we are at the bottom of a 6month channel but we are still at the top of a 15year trendline and I don't think we last above here much
Related funds

QQQ Weekly Map 3–7 Nov 2025Context
QQQ finished the week near the highs after a steady October climb. Buyers keep absorbing every shallow pullback. This week sits on two hinges. First, jobs and services data that nudge yields and implied vol. Second, a small cluster of tech earnings that can rotate leadership inside semis an
QQQ Buy the Rumor, Sell the News?Markets don't top on bad news, but on good news that fails to push prices higher
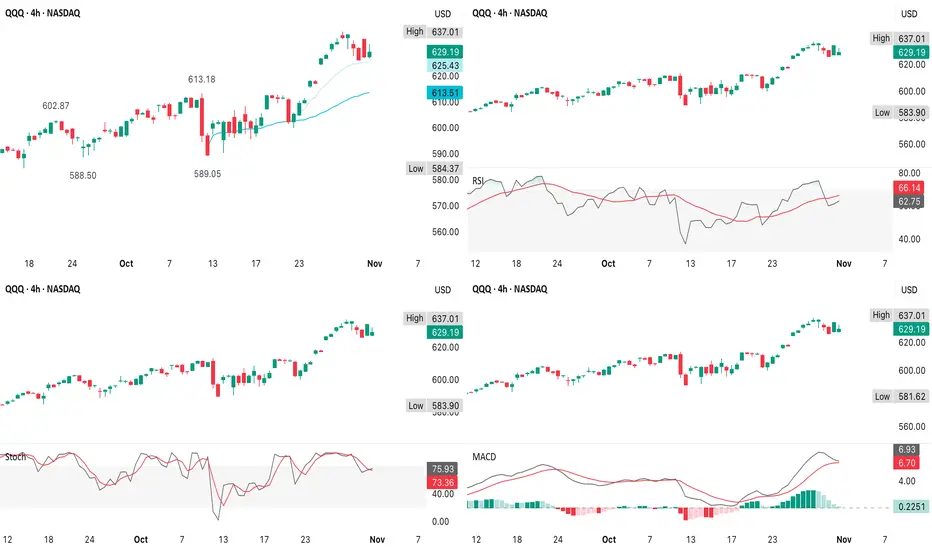
Momentum still favors upside, but is technically stretched.
Dual-position plan (short-term call hedge + medium-term puts) is sound
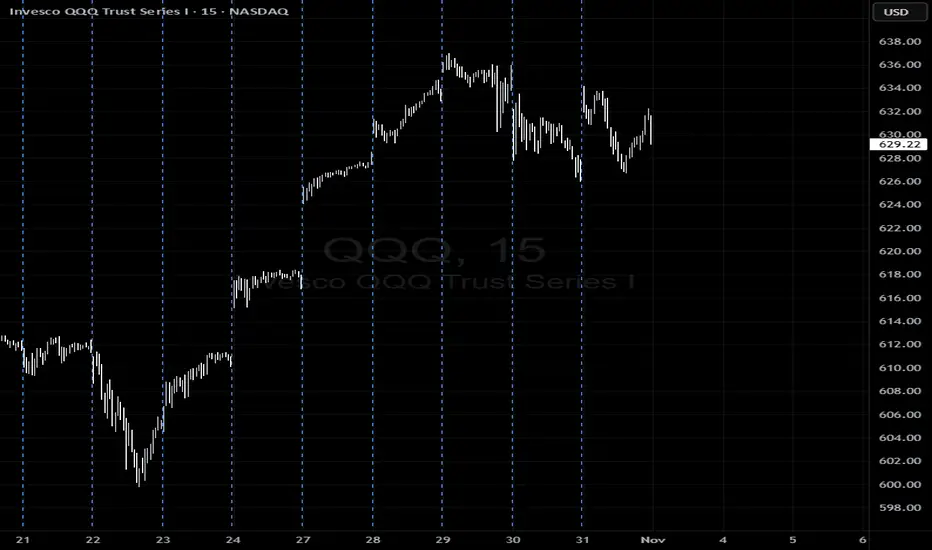
Just trade fast around $636 & $630 pivots
1. Rumor phase has already played out

QQQ QuantSignals V3 0DTE 2025-11-01QQQ QuantSignals V3 0DTE 2025-11-01
QQQ 0DTE Signal | 2025-11-01
• Direction: BUY PUTS | Confidence: 65%
• Expiry: 2025-11-03 (same-day)
• Strike Focus: $626.00
• Entry Range: $4.60
• Target 1: $9.00
• Stop Loss: $2.25
• Gamma Risk: Low
• Flow Intel: Bearish (High P/C Ratio) | PCR 3.95
• Price vs VW
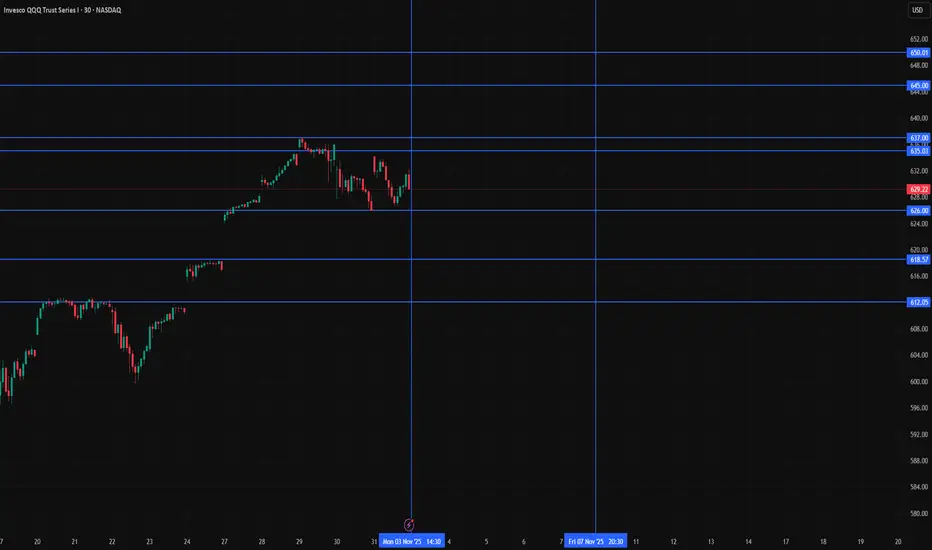
QQQ Controlled ShakeoutPrice pulled back right to the midpoint of its rising channel
The daily pivot (P) at ~$618.8 is being tested & that’s nearly identical to the 4H VWAP from the 10 October low
This area has been a launchpad several times in the past (late July & early October)
QQQ is at a major confluence of supp

QQQ Bearish Pullback: Retest Toward 590–595 ZoneQQQ on the 1D chart has been trending higher for months, but the latest session printed a clean Bearish Engulfing with a ~1.86% drop and a break below the 20-day (around 614.50). That rejection left fresh supply near the recent high at 635 and flipped 610–615 into near-term resistance. Momentum has

Stock Market Forecast | TSLA NVDA AAPL AMZN META MSFTStock Market Forecast | CME_MINI:NQ1! CME_MINI:ES1! NASDAQ:NDX SP:SPX
Mag 7 | TSLA NVDA AAPL AMZN META MSFT GOOGL

Qqqback inside channel no reason why it would go up china trade deal was already priced in I think we fill gap 612 before the deal is announced stop loss if it goes above channel again. meta and nflx alone if they cross bearish on the monthly they both weight about 6% on Qqq
QQQ (7 November)QQQ remains within statistical bounds of its uptrend
A daily close back above $625 would re-open the path to $637+, while a close below $595 would warn that the current mean-reverting structure is breaking down
The ±3% price envelope nicely visualizes how tightly QQQ has been hugging its midlin

QQQ Generals (AAPL, MSFT & NVDA)Each stock is in a primary uptrend, but with slightly different phases of momentum - you’re seeing a bit of divergence among the “QQQ generals,' which is important
AAPL
Grinding higher, above 50d MA & within upper Bollinger band
Still trending, but upper wicks = supply around $275-$277; like
See all ideas
Displays a symbol's price movements over previous years to identify recurring trends.
Frequently Asked Questions
An exchange-traded fund (ETF) is a collection of assets (stocks, bonds, commodities, etc.) that track an underlying index and can be bought on an exchange like individual stocks.
Since ETFs work like an individual stock, they can be bought and sold on exchanges (e.g. NASDAQ, NYSE, EURONEXT). As it happens with stocks, you need to select a brokerage to access trading. Explore our list of available brokers to find the one to help execute your strategies. Don't forget to do your research before getting to trading. Explore ETFs metrics in our ETF screener to find a reliable opportunity.
No, QQQ doesn't pay dividends to its holders.