OIL: The Bearish Movement Could Resume AgainOIL: The Bearish Movement Could Resume Again
OIL tested a strong resistance zone near 60. This area corresponds also with a strong structure zone and also a psychological price that pushed the price down several times.
OPEC continues to increase the OIL production so the odds are to go down again

Crude Oil Breakout Alert - Bulls Taking Control!WTI Crude Oil (4H) – Technical Outlook
Price action is breaking out of a well-defined descending channel, indicating early signs of a potential trend reversal. The breakout is occurring near the 50-EMA, which is now acting as dynamic support. A successful retest of the channel’s upper boundary mar

us oilHI GUYS,
UPDATE and CORRECTION on US OIL
we wait for sells Friday morning, a few hours from now,
(MON, TUE) Double bottom buy price is calling for a sell price pattern (FRI, MON) Head shoulder

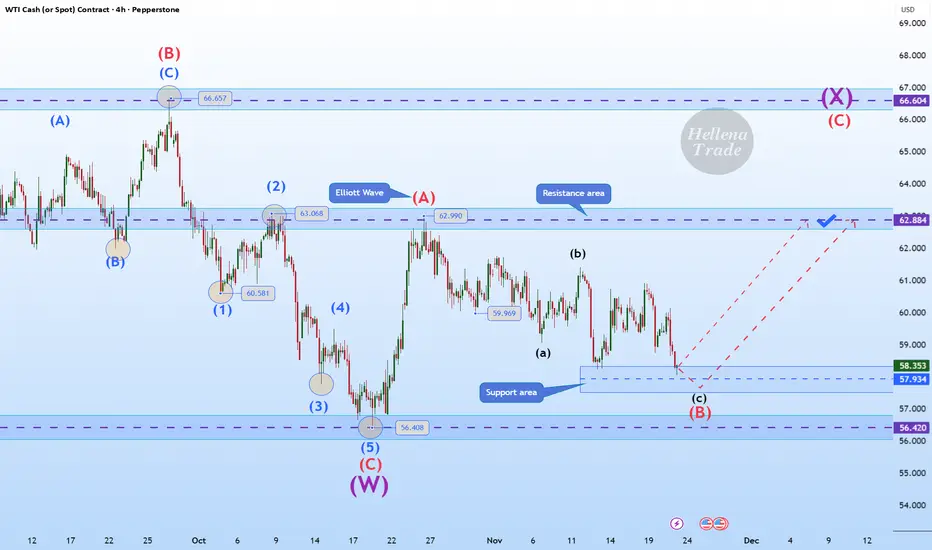
Hellena | Oil (4H): LONG to the area of the maximum of wave “A”.Colleagues, the past forecast has not been canceled, but I see some changes and therefore feel it is necessary to make a fresh forecast.
Apparently, the corrective wave “B” has extended to the area of 57.930. This is quite close to the low of wave “C” at 56.408 and the price should not update it, o
🇺🇸 USOIL – Big Money Steps Back In | Fresh Sell Order BlockUSOIL continues to follow its broader downtrend as Big Money steps back into the market.
After a brief bullish correction, price was rejected sharply and formed a fresh VShark Order Block, supported by strong volume and a clean Imbalance zone.
This reaction reveals clear footprints of large players

USOIL : Don't be fooledHello friends
Well, you see that we have a descending channel that has hit the ceiling twice and the ceiling three times.
Well, in the third encounter with the bottom or support, you see that the buyers provided good support for the price and pushed it up and broke our medium-term ceiling. Now, if

Oil Market Outlook: Range-Bottom Reaction AheadHello traders,
Today I’m here with an analysis of Crude Oil.
Based on the chart, as you can see, the price is currently sitting on a support level.
Considering the global geopolitical situation and ongoing conflict news, we may see a potential rise in price.
Overall, we are looking at a sideways (r

WTI OIL targeting at least $56.00 on the short-term.WTI Oil (USOIL) continues to expand its 4-month Channel Down and has repeatedly been rejected on its 1D MA50 (blue trend-line) in the past 40 days.
As mentioned before, this is similar to September's price action, which eventually tested the previous Support before breaking it and move to a new Low

USOIL Will Go Lower From Resistance! Sell!
Take a look at our analysis for USOIL.
Time Frame: 4h
Current Trend: Bearish
Sentiment: Overbought (based on 7-period RSI)
Forecast: Bearish
The price is testing a key resistance 59.046.
Taking into consideration the current market trend & overbought RSI, chances will be high to see a bearish mo

WTI OIL Short-term relief rebound before a Lower Low?WTI Oil (USOIL) has been trading within a 1-month Channel Down and has just completed its strongest Bearish Leg (-5.91%). All previous three Bearish Legs eventually bottomed and rebounded into the new Bullish Legs towards the Sell Zone consisting of the 4H MA200 (orange trend-line) - 1D MA50 (red tr

See all ideas
Displays a symbol's price movements over previous years to identify recurring trends.