Crude Oil Trading Strategy for TodayMarginal improvement signals have emerged, and consumer resilience exceeded expectations.
The demand for replenishment in Asia has been concentratedly released: In November, China's petrochemical refineries received an additional 15 million tons of crude oil import quotas (approximately 300,000 barrels per day). In the first half of November, China's crude oil imports increased by 12% year-on-year, and the purchasing focus shifted to WTI-related varieties, which led to an increase in U.S. crude oil export volume from 5.4 million barrels per day to 5.8 million barrels per day (reaching a new high since October), forming a "import - export" positive cycle.
Heating oil demand started earlier than expected: In the first ten days of November in North America, the temperature was 3-5℃ lower than the average. The price of heating oil futures in the New York port rose by 4.2% in a week, and the output of heating oil by refineries increased by 8% month-on-month, which led to the continuous reduction of distillate oil inventories and indirectly stimulated the demand for crude oil purchases.
Crude Oil Trading Strategy for Today
buy:59.5-60
tp:60.5-61
sl:61.5
Trade ideas

WTI OIL 4H Channel Down aiming for a Lower Low.WTI Oil (USOIL) is extending the 1D MA50 (red trend-line) rejection of October 24 and has formed a short-term Channel Down. We are currently on its second Bearish Leg following a new rejection this time on the 4H MA200 (orange trend-line).
With the first Bearish Leg declining by -4.72%, we expect the current one to replicate this drop and target $58.60.
-------------------------------------------------------------------------------
** Please LIKE 👍, FOLLOW ✅, SHARE 🙌 and COMMENT ✍ if you enjoy this idea! Also share your ideas and charts in the comments section below! This is best way to keep it relevant, support us, keep the content here free and allow the idea to reach as many people as possible. **
-------------------------------------------------------------------------------
💸💸💸💸💸💸
👇 👇 👇 👇 👇 👇

USOIL LOCAL LONG|
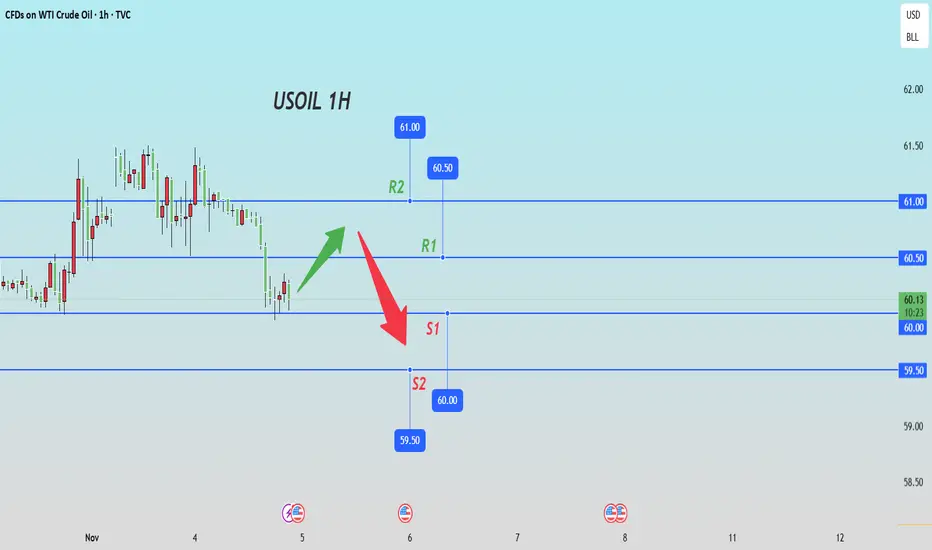
✅WTI OIL is expected to bounce from the demand level near $60.00, targeting the $60.70 resistance zone as bullish momentum builds. Time Frame 3H.
LONG🚀
✅Like and subscribe to never miss a new idea!✅

WTI Crude resistance at 6160The WTI Crude Oil is currently trading with a bearish bias, aligned with the broader downward trend. Recent price action shows a retest of the longer term support, suggesting a temporary relief rally within the downtrend.
Key resistance is located at 6160, a prior consolidation zone. This level will be critical in determining the next directional move.
A bearish rejection from 6160 could confirm the resumption of the downtrend, targeting the next support levels at 5946, followed by 5845 and 5780 over a longer timeframe.
Conversely, a decisive breakout and daily close above 6160 would invalidate the current bearish setup, shifting sentiment to bullish and potentially triggering a move towards 6215, then 6300.
Conclusion:
The short-term outlook remains bearish unless the WTI Crude price breaks and holds above 6160. Traders should watch for price action signals around this key level to confirm direction. A rejection favours fresh downside continuation, while a breakout signals a potential trend reversal or deeper correction.
This communication is for informational purposes only and should not be viewed as any form of recommendation as to a particular course of action or as investment advice. It is not intended as an offer or solicitation for the purchase or sale of any financial instrument or as an official confirmation of any transaction. Opinions, estimates and assumptions expressed herein are made as of the date of this communication and are subject to change without notice. This communication has been prepared based upon information, including market prices, data and other information, believed to be reliable; however, Trade Nation does not warrant its completeness or accuracy. All market prices and market data contained in or attached to this communication are indicative and subject to change without notice.

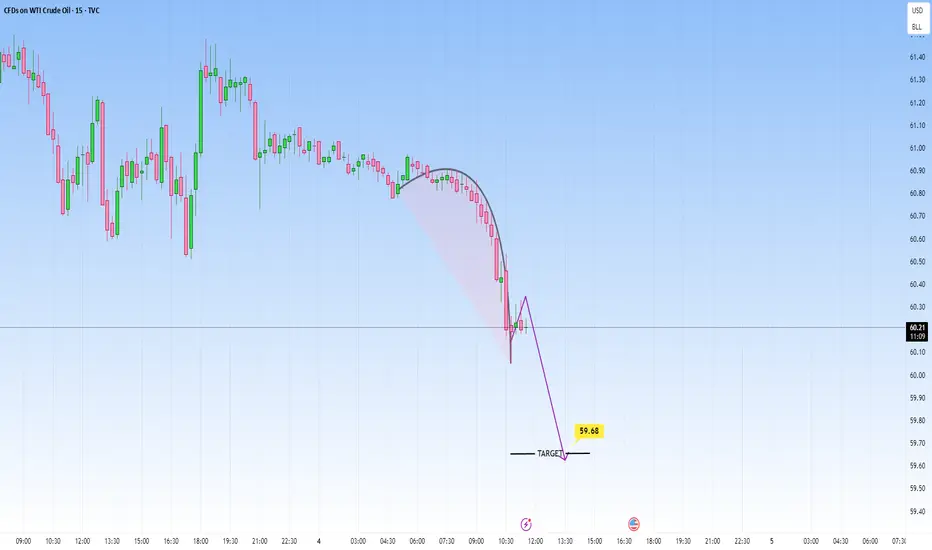
USOIL: Slow Continuation to the downside LikelyIn this short-term view, price is forming a rounded kind of top. The structure broke to the downside with more volume.
We could see another leg lower, targeting around 59.65.
WTI It's creating an Invers Head and Sholders pattern-At this price It's a very good opportunity to enter with a very good SL and a high profit opportunity.
-Currently It's bullish as the chart show us but It's important to be very carrefull cause petrol It's very volatile and political influenced


USOIL SELLElliot wave analysis sell
Price appears to have completed a flat corrections.
I have added to my initial sell trade, SL and TP as specified.

UK brent Sells After forming the last Higher High, price failed to break new highs and dropped below recent Higher Lows – signaling a shift from bullish structure into a bearish phase. Price is now in Correction, pulling back into a broken support area that may act as resistance. An imbalance left below adds confluence for a continuation lower. Waiting for a Lower High to confirm bearish Continuation in line with the higher timeframe downtrend.
The daily chart shows price reacting from a key supply area, adding strong higher-timeframe confluence. With imbalance below and structure now bearish, a confirmed Lower High would validate continuation to the downside
Entry: 61.230
Stop Loss: 62.130
Take Profit: 57.200

Immediate data is negative, and inventory support has weakened. The inventory reduction process in the United States has come to an end, and the expectation of inventory accumulation is rising: The latest high-frequency data shows that the crude oil inventory in the Cushing area increased by 1.8 million barrels (to 36.8 million barrels, reaching a new high since October), ending the previous three-week reduction trend; the U.S. crude oil import volume remained at a high level of 6.1 million barrels per day, coupled with the refinery operating rate dropping from 88.6% to 86.2% (reduced profits led to a decrease in processing demand), short-term inventory accumulation pressure has emerged.
The weak signal on the demand side is clear: European diesel consumption decreased by 8% year-on-year, U.S. gasoline retail sales declined by 3.2% month-on-month, the demand for winter heating oil in the Northern Hemisphere did not start as expected (the spot price of heating oil in the New York port dropped by 5.3% in a week), and terminal demand is unable to support oil prices.
Crude Oil Trading Strategy for Today
sell:61-60.5
tp:60-59.5
sl:62
USOIL BULLS ARE STRONG HERE|LONG
USOIL SIGNAL
Trade Direction: long
Entry Level: 60.06
Target Level: 60.65
Stop Loss: 59.67
RISK PROFILE
Risk level: medium
Suggested risk: 1%
Timeframe: 2h
Disclosure: I am part of Trade Nation's Influencer program and receive a monthly fee for using their TradingView charts in my analysis.
✅LIKE AND COMMENT MY IDEAS✅

Hellena | Oil (4H): SHORT to support area of 59.00.Colleagues, the situation is complicated, but I still expect the price to renew the local low of 56.40.
It looks like the price is forming a complex compound correction (WXY) and I think that for now it is worth looking at the 59.00 area as the nearest most likely level.
Ideally, I would like to see the completion of wave “C” in the area of 64.80.
Fundamental context
According to the latest IEA report, the global oil market remains under pressure as supply continues to outpace demand. For 2025, production is expected to rise by around 3 million barrels per day, while demand growth is forecast at only 0.7 million barrels. This imbalance increases the risk of oversupply and inventory buildup across key regions.
Manage your capital correctly and competently! Only enter trades based on reliable patterns!

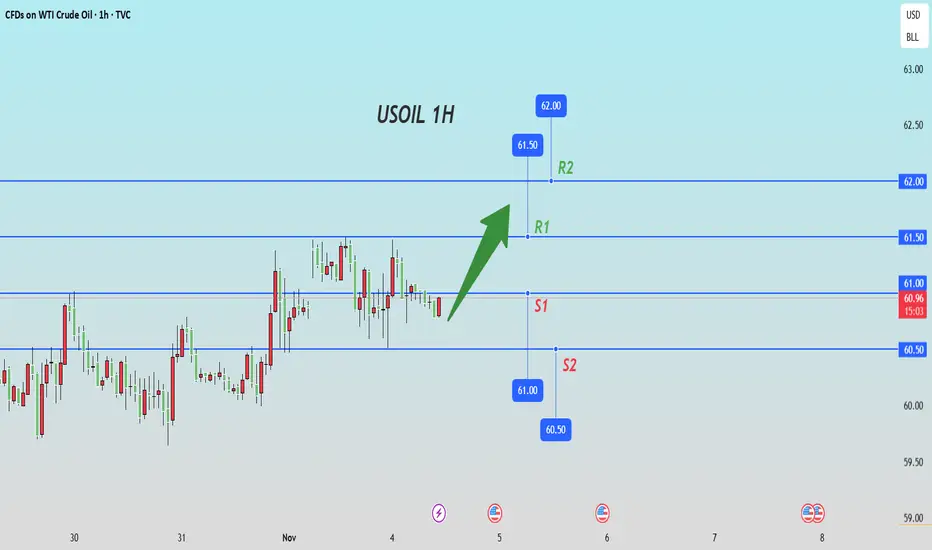
Bullish bounce off?WTI Oil (XTI/USD) has bounced off the pivot, which has been identified as a pullback suport and could potentially rise to the 1st resistance.
Pivot: 60.13
1st Support: 58.86
1st Resistance: 63.19
Disclaimer:
The above opinions given constitute general market commentary, and do not constitute the opinion or advice of IC Markets or any form of personal or investment advice.
Any opinions, news, research, analyses, prices, other information, or links to third-party sites contained on this website are provided on an "as-is" basis, are intended only to be informative, is not an advice nor a recommendation, nor research, or a record of our trading prices, or an offer of, or solicitation for a transaction in any financial instrument and thus should not be treated as such. The information provided does not involve any specific investment objectives, financial situation and needs of any specific person who may receive it. Please be aware, that past performance is not a reliable indicator of future performance and/or results. Past Performance or Forward-looking scenarios based upon the reasonable beliefs of the third-party provider are not a guarantee of future performance. Actual results may differ materially from those anticipated in forward-looking or past performance statements. IC Markets makes no representation or warranty and assumes no liability as to the accuracy or completeness of the information provided, nor any loss arising from any investment based on a recommendation, forecast or any information supplied by any third-party.

Short-term bullish core logic: 3 immediate signals resonatePolicy aspect: OPEC+ halts production increase takes effect, $60 defense line is firmly established
On November 3rd, OPEC+ officially announced a 2026 first-quarter production pause, with only a 12-month maintenance increase of 137,000 barrels per day. This decision precisely hedged against the "2 million barrels per day supply surplus in the first quarter" risk warned by IEA. Historical data shows that when OPEC+ voluntarily curbs production during the demand slack period, oil prices often receive a policy support premium of 1-2 weeks. Currently, $60.91 is at the stabilization stage after policy support, and $60, as the marginal cost line for US shale oil, forms a double support.
Inventory aspect: Unexpected continuous inventory reduction, demand resilience exceeds expectations
As of the week ending October 24th, US commercial crude oil inventories dropped by 6.86 million barrels (expected only a 200,000 barrel reduction), gasoline and distillate inventories decreased by 5.94 million barrels and 3.36 million barrels respectively, and all three oil product inventories were below the five-year average by 3%-8%. Although the inventory in the Cushing region increased by 1.334 million barrels month-on-month, the overall commercial inventory has cumulatively decreased by 15.9 million barrels, coupled with the import volume dropping to a 2021 low (510 million barrels per day), the short-term supply-demand tight balance pattern has not changed, providing substantial support for oil prices.
Technical aspect: Bottom formation begins, rebound momentum starts
$60.91 is at the upper edge of the "56.93-61.65" oscillation range, the daily line presents a "hammer pattern + bullish engulfing" combination pattern, and since late October, a clear bottom reversal signal has been formed;
Momentum indicators improve simultaneously: RSI has rebounded from the oversold range to 41, the MACD red bar begins to expand, and after the price stabilizes at the $60 key level, speculative long positions have returned 38,000 contracts in a week, the financial support has strengthened.
Crude Oil Trading Strategy for Today
sell:61-61.5
tp:60.5-60
sl:62
Crude oil barrel priced at $300?Don't be surprised if we eventually see the crude oil barrel priced at $300.
I sure won't!

Crude Oil Trading Strategy for TodayThe cooling of inflation data strengthens the logic of a rate cut.
The core PCE price index in the United States rose by 2.8% year-on-year in October (lower than the expected 3.0%), reaching a new low since March 2023 and remaining below 3% for three consecutive months, confirming that inflation is approaching the Fed's 2% target. The probability of a 25BP rate cut in December has risen from 65% to 82%, and the cumulative rate cut expectation for 2026 has reached 125BP. In a liquidity-lean environment, the valuation attractiveness of crude oil as a risky asset has significantly increased - historical data shows that the average increase in WTI oil prices during the rate-cut cycle is 12%-15%, and the current price of $61.21 is still in the early stage of valuation recovery.
The US dollar index is under pressure, and the expectation of non-US demand release is expected.
The US dollar index has fallen by 3.2% from its October high and is currently stabilizing below the 92.5 mark. The purchasing power of non-US currencies has rebounded. The purchasing costs of oil-importing countries such as India and China have decreased. In November, India's oil imports are expected to increase by 6% month-on-month (to 5.2 million barrels per day), and China's refineries have received new quotas in November (an additional 12 million tons), and the policy-driven replenishment demand will directly support oil purchases, forming a positive cycle of "weak US dollar - increased purchases - oil price rise".
Crude Oil Trading Strategy for Today
buy:60.5-61
tp:61.5-62
sl:60

Crude Oil Trading Strategy for TodayU.S. crude oil inventories have exceeded expectations for three consecutive weeks of decline, easing the pressure in Cushing.
The latest EIA data (as of the week ending November 1) shows that U.S. crude oil inventories decreased by 5.8 million barrels on a month-on-month basis (expected - 2.2 million barrels), with the scale of decline in the past three weeks exceeding market expectations, and a cumulative reduction of 12.6 million barrels. The core Cushing region's inventories ended the previous four weeks of consecutive increases and decreased by 1.2 million barrels on a month-on-month basis (to 35 million barrels, 8% lower than the 5-year average), shifting from "accumulation pressure" to "tight balance". This data directly dispelled market concerns about "more than 2 million barrels per day of accumulation in the fourth quarter", and $61 became the strong bottom range supported by inventories.
Global major consumption areas' inventories have improved simultaneously, verifying the resilience of demand
European ARA region's crude oil inventories dropped to 43 million barrels (a 12% year-on-year decrease), China's commercial crude oil inventories decreased by 3.5 million barrels on a month-on-month basis (with the start of refinery replenishment demand), and Japan's crude oil inventories also decreased by 5% compared to the previous month. Global major consumption areas' inventories have simultaneously declined, confirming that terminal demand is not "unilaterally weak", but rather shows "overall resilience under regional differentiation", providing cross-regional supply and demand support for oil prices.
Crude Oil Trading Strategy for Today
buy:60.8-61
tp:61.8-62.5
sl:60.4

Crude Oil Trading Strategy for TodayPrecise control of production increase pace, directly addressing the pain point of the demand off-season
On November 2nd, the eight core member countries of OPEC + reached a key decision: in December 2025, they will maintain a slight increase of 137,000 barrels per day, but in the first quarter of 2026, they will completely suspend further production increases. This decision precisely hedged against the risk of "a record 4 million barrels per day surplus in 2026" as warned by the IEA. By freezing the supply increase in the weakest demand quarter (with demand possibly dropping by 2-3 million barrels per day in February and March), it forms a substantive "price protection and stabilization measure". Compared with the previous market concerns about "continuous production increase", the policy shift brought about a difference in expectations, providing strong support for oil prices. $60 became the implicit bottom line for the OPEC + policy to support the market.
Crude Oil Trading Strategy for Today
buy:60.8-61
tp:61.8-62.5
sl:60.4

WTI Crude Oil | Flag Breakout Faces Macro ResistanceCrude broke out of its short-term flag, but momentum has been softer than expected — a possible hint of a broader consolidation phase. OPEC+’s pause on supply hikes through Q1’26 aligns with surplus projections, but fresh U.S. sanctions on Russia could flip that narrative fast.
Technical Lens:
Price broke above a descending channel, yet upside follow-through stalled beneath the $62–65 resistance band (former breakdown zone). RSI is mid-range near 55, showing balance between buyers and sellers. A larger flag may be forming within the broader $58–65 structure.
Scenarios:
If $65 holds as resistance → price could drift back toward $58–59 support to reset momentum.
If $65 breaks cleanly → opens scope toward the $68–70 handle, aligning with prior supply zone.
Catalysts:
OPEC+ output guidance revisions, U.S. sanctions enforcement on Russian crude, and global demand indicators heading into winter.
Takeaway:
WTI sits in a technical crossroads between breakout continuation and macro restraint — $62–65 remains the decision zone to watch this week.

BUY USOILOur trade for today is on OIL, as you can see, we bought to target the Daily LQ.
Follow for more trades!

USOIL Is Very Bullish! Buy!
Please, check our technical outlook for USOIL.
Time Frame: 6h
Current Trend: Bullish
Sentiment: Oversold (based on 7-period RSI)
Forecast: Bullish
The market is trading around a solid horizontal structure 60.808.
The above observations make me that the market will inevitably achieve 62.277 level.
P.S
Overbought describes a period of time where there has been a significant and consistent upward move in price over a period of time without much pullback.
Like and subscribe and comment my ideas if you enjoy them!

Crude oil review - 03/11/2025Oil prices climbed after OPEC+ announced a modest output hike for next month, followed by a production pause through the first quarter of next year. The move signals the group’s acknowledgment of a growing supply surplus in 2026, despite earlier price declines due to concerns about oversupply. While tighter U.S. sanctions on Russian producers have added some uncertainty to supply forecasts, overall market conditions remain skewed toward excess production. Additional risks include disruptions from a Ukrainian drone strike on a Russian oil facility and political instability in Nigeria, which could affect output and shipping flows.
On the technical side, the crude oil price has retested the major technical resistance at $62 and corrected to the downside since. Currently, the price is testing the resistance of the 50-day simple moving average and the 50% Fibonacci retracement level of the daily range. The Bollinger Bands are still expanded, indicating that volatility in the crude oil market remains high, while the Stochastic oscillator is near extreme overbought levels, suggesting a potential bearish correction in the upcoming sessions. If this becomes reality, the first area of potential support may be seen around the $60 level, which is the psychological support of the round number. The second area of support might be found around $58, which corresponds to the 23.6% Fibonacci retracement level.
Disclaimer: The opinions in this article are personal to the writer and do not reflect those of Exness

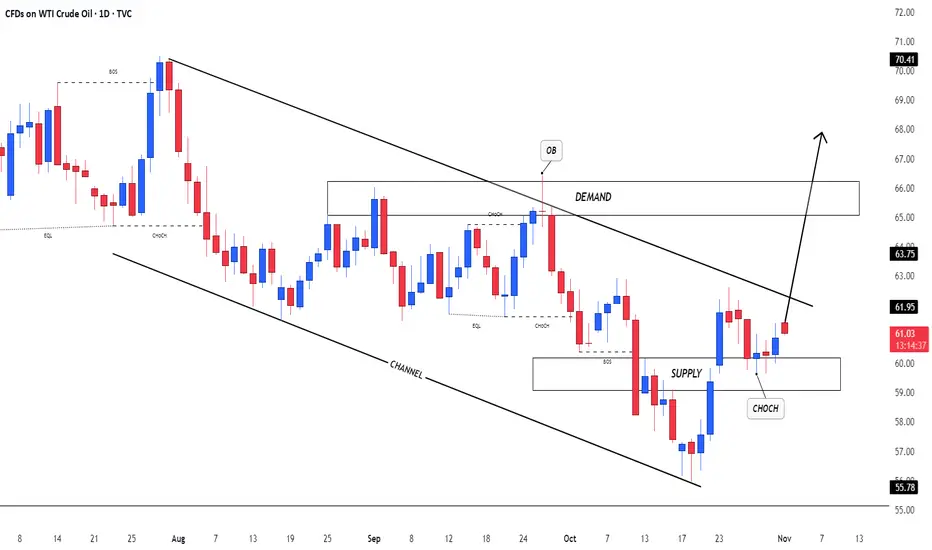
US OilCrude Oil Index
- Bearish Channel as an corrective pattern in Short Time Frame
- RSI - Divergence
- Supply Zone
- Change of Characteristics
- Order Block