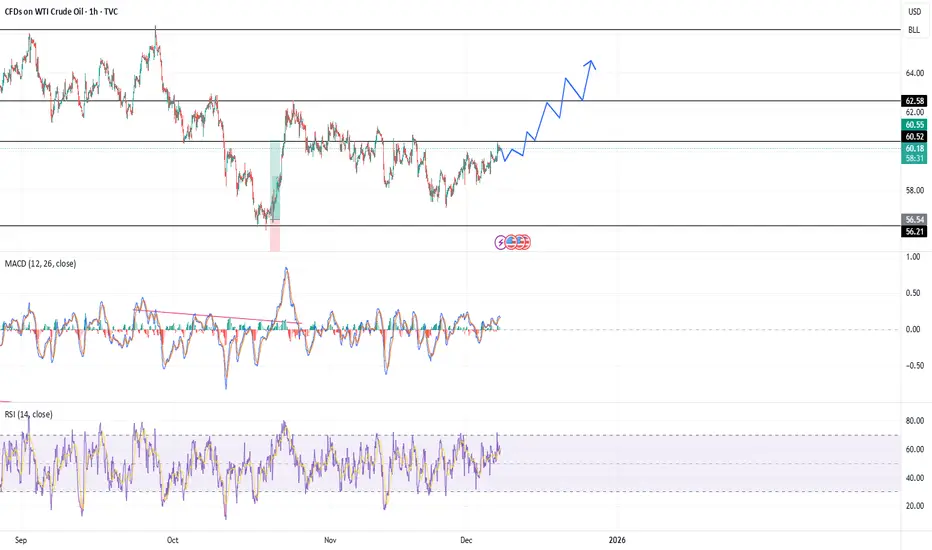
USOIL will have a reversal The price will be reversed based on MCAD line. the bearish trend is exhausted and price will move up probably.
Trade ideas
WTI Crude – Macro Cycle OutlookWTI continues to track a dominant long-term cycle rhythm that has consistently produced major swing highs and lows across the past decade. The current positioning suggests we’re nearing the late stage of a down-cycle, which historically leads to accumulation, volatility compression, and eventual expansion.
The shorter oscillation (blue cycle) has been driving tradable swings roughly every 72 weeks, while the broader composite cycle (purple) points to a larger structural trough forming into the 2025–2026 window. If that timing holds, the coming quarters may represent a transitional regime.
CCI remains depressed but not capitulated, consistent with the “late descending phase” where momentum exhaustion precedes reversal but price can still grind lower.
CYCLE TAKEAWAY:
1. Late in down-cycle
2. Transitional phase likely
3. Potential for major cycle low into 2025–2026
4. Upside expansion historically follows these troughs
As always, cycles provide timing context, not trade signals – confirmation comes from price and momentum turning, not dates on a chart.
Not financial advice – sharing my cycle work for research and discussion.

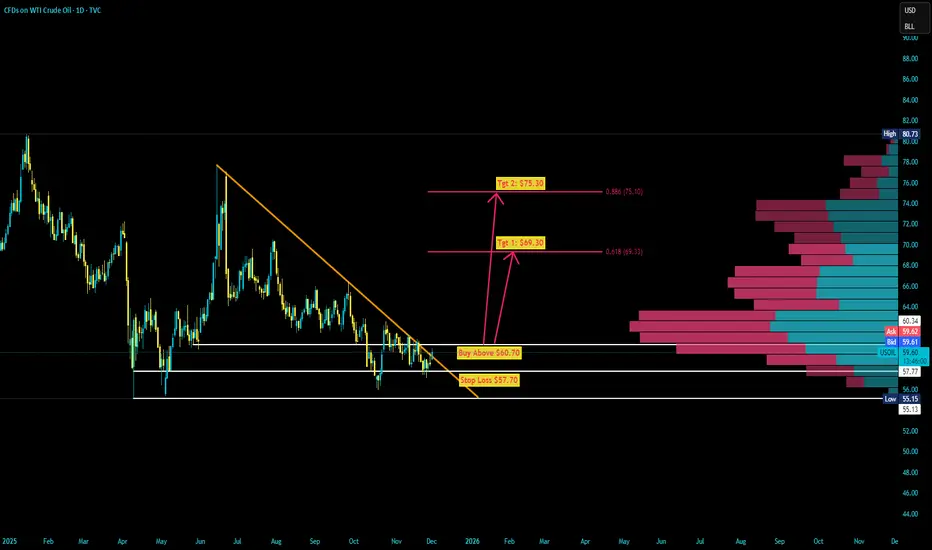
OIL IS (SOON) GOING TO 60ish.. 61, 62, 63, ....I am bullish on CrudeOil..
It has perfect wave counting 5 waves of C- correction.
And it stopped perfectly at the 78.6 Fibo levels with a strong bull candle.
Don't miss this chance.. Very good R:R from this level..
CHEEERRRSSSS...!!!!

US OILHI GUYS,
I have stopped trading us oil after i posted or shared a price sell pattern that failed to work.
i will be waiting for the duration of 511days to trade again.
NOTE. My technical analysis is saying that there is a historical manipulation on the previous RT WEEKLY, which definitely has to affect the currently on-going situation to the RT DAILY Incoming buy pattern .
NOTE MY strategy is if i make a loss on a pair twice a week, it simply means everything will always go south (wrong)
this is why i always recheck the 6month the 12month and possibly the 24 month if they have a historical manipulation or a new structure that i have never seen then i stay away from investing, but i track down the history because it will definitely happen again next year or the years to come.(future)
FOR THOSE THAT SOLD EARLIER ON THE RT WEEKLY U CAN HOLD, HOWEVER FOR THOSE THAT ARE TRADING NOW WELL KEEP AT IT

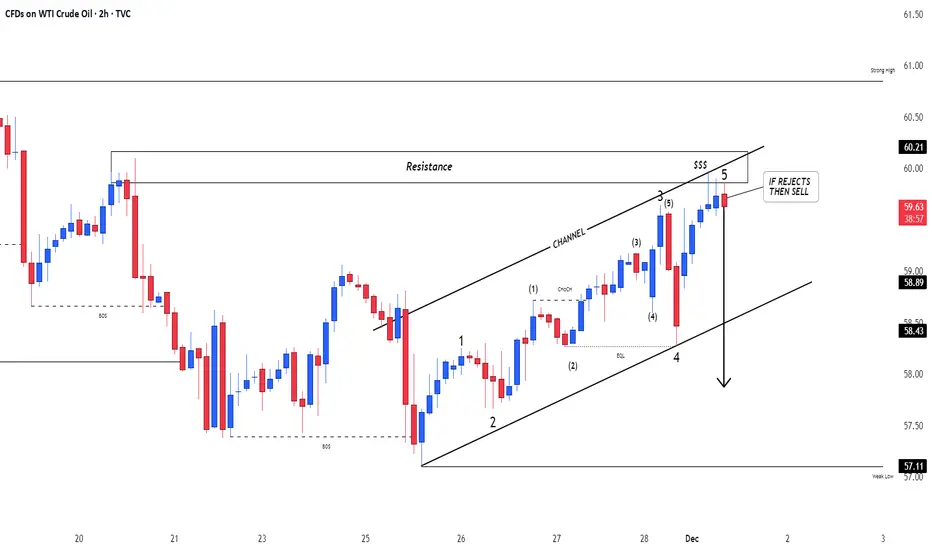
breakout, looking for where it will get rejected.Looks like very whole numbers but i can be wrong, so looknig at 60.5, 61 and 61.5
XTI/USD (Crude Oil) – 4H Trendline Analysis (Updated)🛢️ XTI/USD (Crude Oil) – 4H Trendline Analysis (Updated)
Crude oil has officially broken out of the bearish green trendline, meaning the downtrend lost its dominance for the first time in months. Buyers are now trying to build a new bullish structure, and that yellow “safety line” is the heart of this shift.
1️⃣ Trend Status
Bullish attempt active as long as price stays above the yellow safety line.
First breakout above the green trendline confirms bears are weakening.
2️⃣ The Safety Line (Yellow) — The Most Important Level
This trendline is literally the switch between bullish continuation and bearish collapse.
✔ Above the safety line → bullish continuation
Price can push toward:
61.00 → 61.80 → 62.00
❌ Any break below the safety line → downtrend resumes
If the yellow trendline breaks, it indicates:
Loss of bullish structure
Re-entry into bearish pressure
Potential drop toward 59.07 → 58.20
This is exactly where your trendline strategy shows its power.
3️⃣ Expected Movement
Your projection is on point:
A small retest → bounce → continuation toward the upper zones.
As long as oil respects the safety line, buyers stay in control.
✨ Final Summary
Trend: Bullish attempt
Key level: Yellow safety line
Break above: Leads to 61–62
Break below safety line: Indicates the downtrend is back in full control
If you want, I can format this into a TradingView-ready caption with your signature Avo.Trades style.

CRUDE OIL OPENING WEDGE|LONG|
✅WTI OIL has broken out of the expanding wedge, signaling bullish displacement as we move away from prior sell-side liquidity. A corrective retest of the breakout zone could fuel continuation toward premium draw-on liquidity. Time Frame 12H
LONG🚀
✅Like and subscribe to never miss a new idea!✅


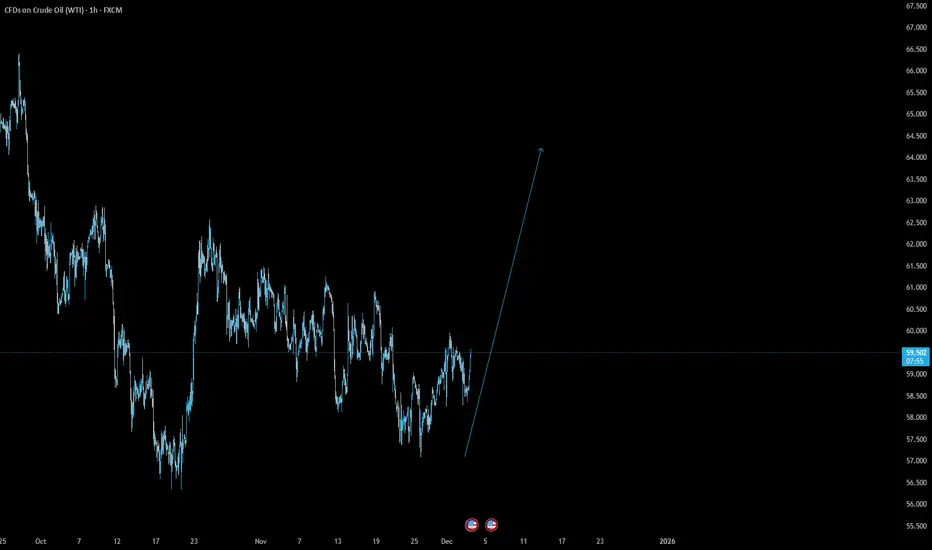
Oil, Numbers, and Energy Flows: Decoding December’s Symbolic PulThe 3 December 2025 candle closed at 59.10, which from a numerology perspective can be interpreted as 5 + 9 = 14, and 1 + 4 = 5, symbolising volatility and rapid shifts. The decimals — 10 = 1 + 0 = 1 — represent initiation and new beginnings.
From this, we can conclude that 4 December may bring significant volatility. Perhaps developments involving the USA and Venezuela could emerge — just a thought we wanted to share for educational purposes.
An initial bullish trend is emerging in crude oil.(I) Supply-Demand Dynamics: OPEC+’s Backing vs. Surplus Pressure, Short-Term Balance Unbreakable
On the supply side, OPEC+ has explicitly decided to suspend production increases in the first quarter of 2026. The ongoing production cut of 3.24 million barrels per day continues to underpin the market. Moreover, the implementation of the production capacity assessment mechanism will reduce disputes over output quotas, sending a clear policy signal to stabilize oil prices.
However, the short-term supply glut remains unresolved. U.S. crude oil production has stabilized at a record high of 13.862 million barrels per day. Non-OPEC+ countries such as Brazil and Norway are continuously ramping up their production capacity. The IEA predicts that the global oil market will face a supply surplus of nearly 4 million barrels per day in 2026. Record-high inventories (reaching a four-year peak) and 200 million barrels of crude oil stranded at sea are exerting downward pressure on oil prices.
Demand growth remains sluggish. The slow recovery of the global economy is restricting oil consumption. The IEA estimates that the annual demand growth rate will only be 0.8 - 1.2 million barrels per day. Refined oil consumption in Europe and the United States is weak, while inventory replenishment demand in Asia is characterized by a short-cycle pattern, which is unable to form sustained support for oil prices. Amid this fragile balance between supply and demand, oil prices lack the momentum for a unilateral trend.
(II) Geopolitics: Low Risk Premium, Acting as a Disturbance Rather Than a Trend Driver
The situation in the Middle East is in a delicate balance. The return of Russian troops to southern Syria has formed a strategic buffer zone, restricting Israel's military operations and temporarily easing the security risks to shipping in the Strait of Hormuz. There are no signs of an escalation of the Russia-Ukraine conflict. The market has partially priced in expectations of either easing or tightening sanctions on Russia, and Russia has maintained the stability of its oil exports through shadow fleets. In the short term, geopolitical factors may only trigger technical rebounds, but they are unlikely to change the volatile pattern dominated by fundamentals.
(III) U.S. Dollar Exchange Rate: Rising Dovish Expectations, Suppressive Effect Marginally Eased
Expectations of a Fed interest rate cut in December have strengthened. The market forecasts that interest rates will gradually adjust toward the neutral range of 3.00% - 3.25%. The U.S. Dollar Index has broken below the key support level of 99 and is currently fluctuating around 98.95, with a potential downside risk of 5% - 7% in the subsequent period.
Crude oil maintains a negative correlation of approximately -0.65 with the U.S. dollar. The weakening of the U.S. dollar reduces the procurement costs for non-U.S. dollar countries, marginally easing the downward pressure on oil prices and providing monetary support for a rebound.
(IV) Technical Outlook: Key Resistance Nearby, Defined Volatility Range
WTI crude oil is currently trading at $60.09, closely approaching the 50-day moving average ($60.2) and the previous high-volume trading zone, which together form short-term resistance. On the downside, the key supports are focused on the 23.6% Fibonacci retracement level at $58.8, and the lower band of the Bollinger Bands at $57.9 serves as a strong support level.
On the daily chart, the RSI indicator stands at 52, which falls in the neutral range. The MACD red histogram is shrinking, indicating a balance between bullish and bearish momentum. In the short term, WTI crude oil is expected to fluctuate in a narrow range, with resistance between $60 and $60.5 and support between $58.8 and $59.
Next week's crude oil trading strategy
buy:59-59.5
tp:60-61-62
sl:58.5

WTI Crude Oil – Wolfe Waves Completed at Point 5
🛢️
The chart is screaming a classic Wolfe Waves setup – five clean points, with Point 5 delivering a sharp rebound right off the 2–2.24 Fibonacci extension. That’s textbook behavior at the end of the final impulsive wave.
Point 5 isn’t just the exhaustion zone… it’s the launchpad where market makers typically reload before driving price toward the 1–4 line.
Currently, price is holding firm above the balance zone (58–59.20), setting the stage for a medium-term reversal.
---
🎯 Projected Target
66 USD
This isn’t a random number – it’s a direct projection from the extended 1–4 line.
---
🔒 Stop-Loss Strategy
Two profiles, two levels of risk management:
1. Short-term traders (Intraday/Swing):
• Daily close below 58 USD
2. Position traders / Investors:
• Break below 55 USD
---
⚡ In short: Wolfe Waves are complete, Point 5 has spoken, and the market is gearing up for a run toward 66 USD.

USoil: In all the cases, this looks upFor USoil, in all the cases this looks up. Any time we see a buy we will take it.
USOIL BEARS WILL DOMINATE THE MARKET|SHORT
Hello, Friends!
USOIL pair is in the uptrend because previous week’s candle is green, while the price is obviously rising on the 4H timeframe. And after the retest of the resistance line above I believe we will see a move down towards the target below at 58.36 because the pair overbought due to its proximity to the upper BB band and a bearish correction is likely.
Disclosure: I am part of Trade Nation's Influencer program and receive a monthly fee for using their TradingView charts in my analysis.
✅LIKE AND COMMENT MY IDEAS✅

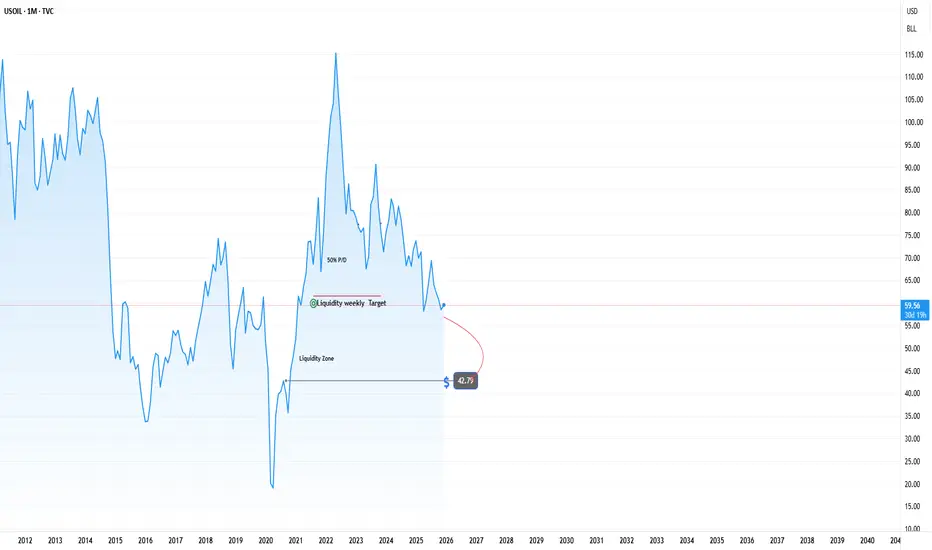
UPDATE WTI FORECASTING For the next year we will probably have the lowest pice to 42,79 per barrel, Investors have to see this behaive and price and get new strategies
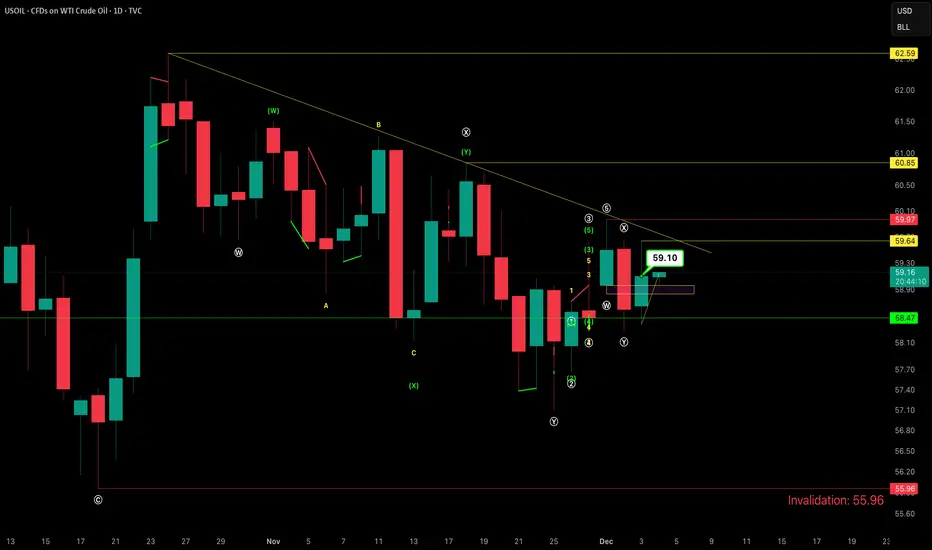
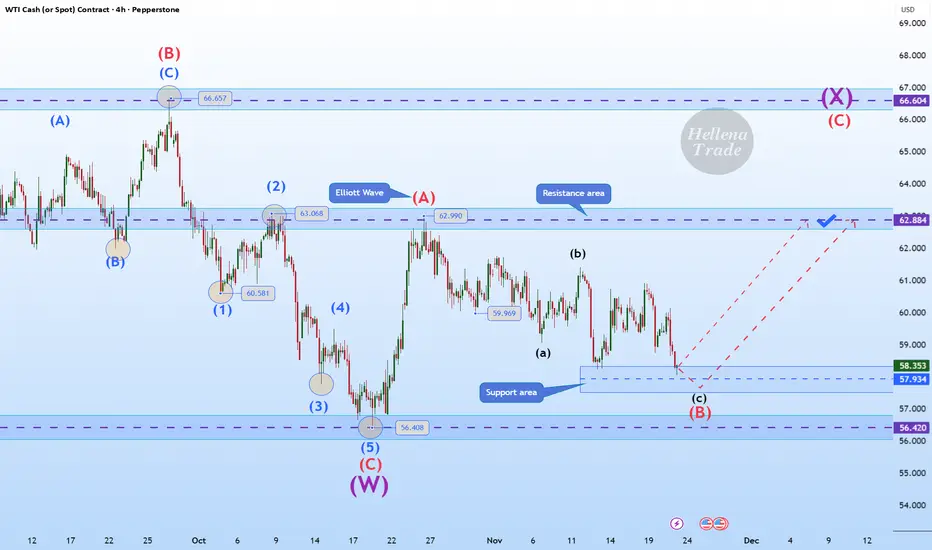
Hellena | Oil (4H): LONG to the area of the maximum of wave “A”.Colleagues, the past forecast has not been canceled, but I see some changes and therefore feel it is necessary to make a fresh forecast.
Apparently, the corrective wave “B” has extended to the area of 57.930. This is quite close to the low of wave “C” at 56.408 and the price should not update it, otherwise there will be a full-fledged break of the structure.
In connection with the above, I think that the price is already completing the downward movement and I expect the resumption of the upward movement at least to the area of the maximum of wave “A” - 62.990.
Manage your capital correctly and competently! Only enter trades based on reliable patterns!
USOIL at breakout level, what's next??#USOIL - market just near to his breakout level and that is 58.80
Keep close that level and sustain above means a push to higher side on the table.
Good luck
Trade wisley

Crude OilU.S Oil
- Bullish Channel as an corrective pattern in Short Time Frame
- Resistance Level
- Change of Characteristics
- Completed " 12345 " Impulsive Waves
- Order Block
USOIL Set To Grow! BUY!
My dear friends,
Please, find my technical outlook for USOIL below:
The instrument tests an important psychological level 58.48
Bias - Bullish
Technical Indicators: Supper Trend gives a precise Bullish signal, while Pivot Point HL predicts price changes and potential reversals in the market.
Target - 58.94
Recommended Stop Loss - 58.19
About Used Indicators:
Super-trend indicator is more useful in trending markets where there are clear uptrends and downtrends in price.
Disclosure: I am part of Trade Nation's Influencer program and receive a monthly fee for using their TradingView charts in my analysis.
———————————
WISH YOU ALL LUCK

WTI Crude Oil (OIL) – Sell OutlookPrice is retesting a supply zone at 58.60–58.90 after a bearish market structure (BOS + CHoCH).
As long as price stays below this zone, we expect continuation to the downside.
🔻 Sell Bias: After rejection from supply
🎯 Target: 57.20–57.30 (Weak Low liquidity)
🛑 Stop: Above the supply zone
⚠️ Downtrend remains valid — demand below looks weak and likely to break.

USOIL:LIVE TRADEHello friends
you can see that we had a decline and the sellers were in power until the support was determined with Fibonacci, where buyers entered and were able to support the price.
Now, with Fibonacci, we have determined a resistance area for buyers that can move up to there, but considering the main trend, which is negative, the price increase is an opportunity for a sell trade.
Don't forget risk and capital management.
*Trade safely with us*

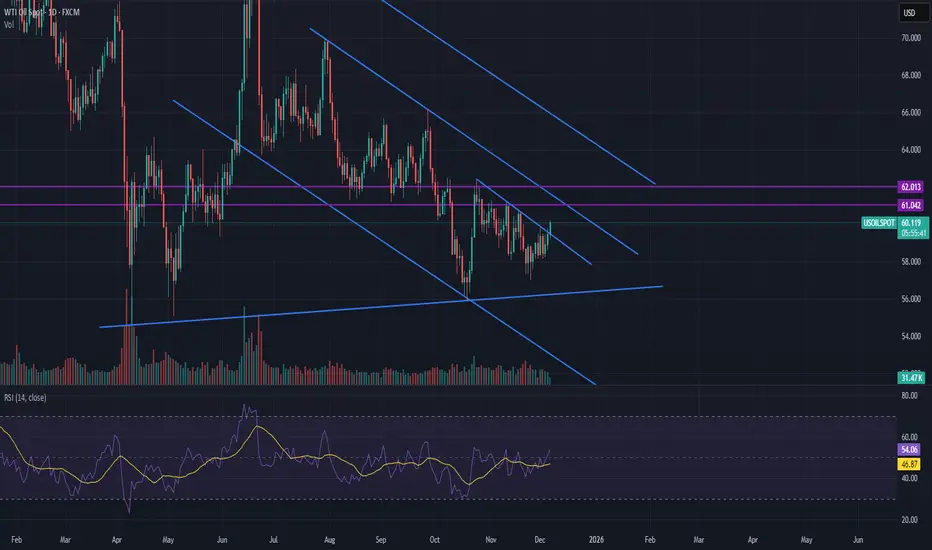
Heading into key resistance?WTI Oil (XTI/USD) is rising towards the pivot, which acts as an overlap resitance and could reverse to the 1st support.
Pivot: 62.24
1st Support: 56.51
1st Resistance: 65.75
Disclaimer:
The opinions given above constitute general market commentary and do not constitute the opinion or advice of IC Markets or any form of personal or investment advice.
Any opinions, news, research, analyses, prices, other information, or links to third-party sites contained on this website are provided on an "as-is" basis, are intended to be informative only, and are not advice, a recommendation, research, a record of our trading prices, an offer of, or solicitation for, a transaction in any financial instrument and thus should not be treated as such. The information provided does not involve any specific investment objectives, financial situation, or needs of any specific person who may receive it. Please be aware that past performance is not a reliable indicator of future performance and/or results. Past performance or forward-looking scenarios based upon the reasonable beliefs of the third-party provider are not a guarantee of future performance. Actual results may differ materially from those anticipated in forward-looking or past performance statements. IC Markets makes no representation or warranty and assumes no liability as to the accuracy or completeness of the information provided, nor any loss arising from any investment based on a recommendation, forecast, or any information supplied by any third party.

🇺🇸 USOIL – Big Money Steps Back In | Fresh Sell Order BlockUSOIL continues to follow its broader downtrend as Big Money steps back into the market.
After a brief bullish correction, price was rejected sharply and formed a fresh VShark Order Block, supported by strong volume and a clean Imbalance zone.
This reaction reveals clear footprints of large players preparing for the next bearish leg.
🔻 Sell Idea
VShark suggests looking for short entries at the newly formed OB zone, targeting RR 1:2, respecting the prevailing bearish structure.
⚠️ Risk Notice
Always size your positions properly and manage risk carefully.
This is a technical analysis idea — not financial advice.
—
✍️ VNSHARK Signature
Following the footprints of Big Money to understand the market’s true intention.
🏷️ Tags
#USOIL #WTI #BigMoney #OrderBlock #VSharkOB #Volume #Imbalance
#SmartMoney #PriceAction #InstitutionalTrading #VNShark #Commodity
