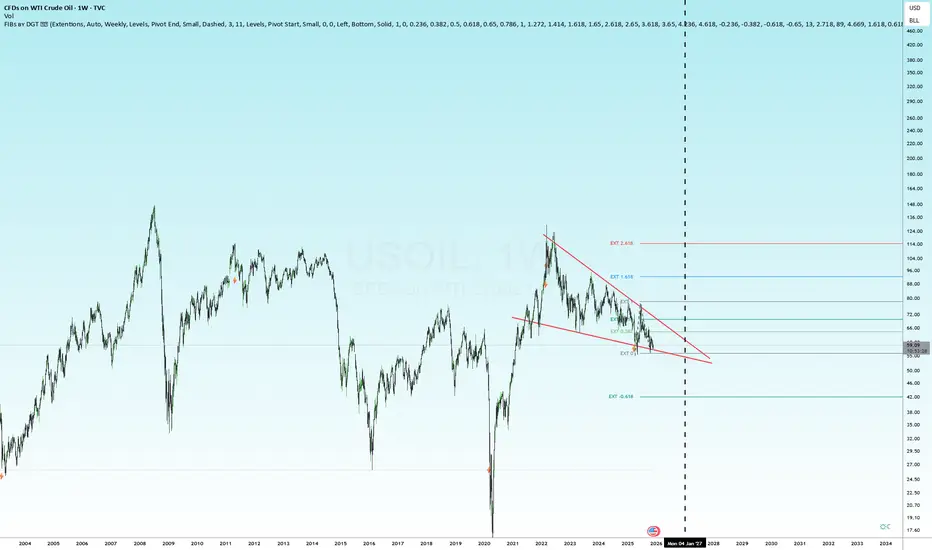
Something will happen with OILWe can have some up and down during 2026, and then it'll go to the 92$ area...
Trade ideas
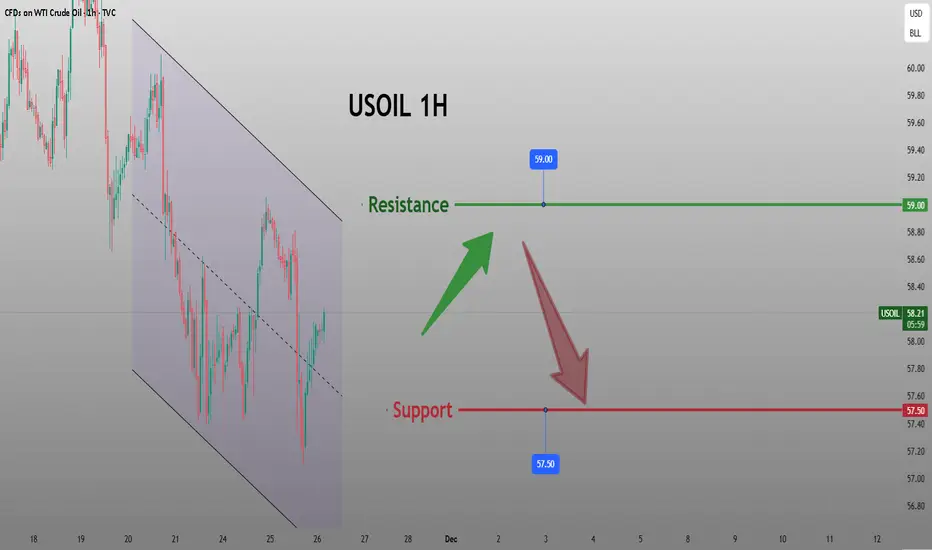
USOIL : Full analysisHello friends
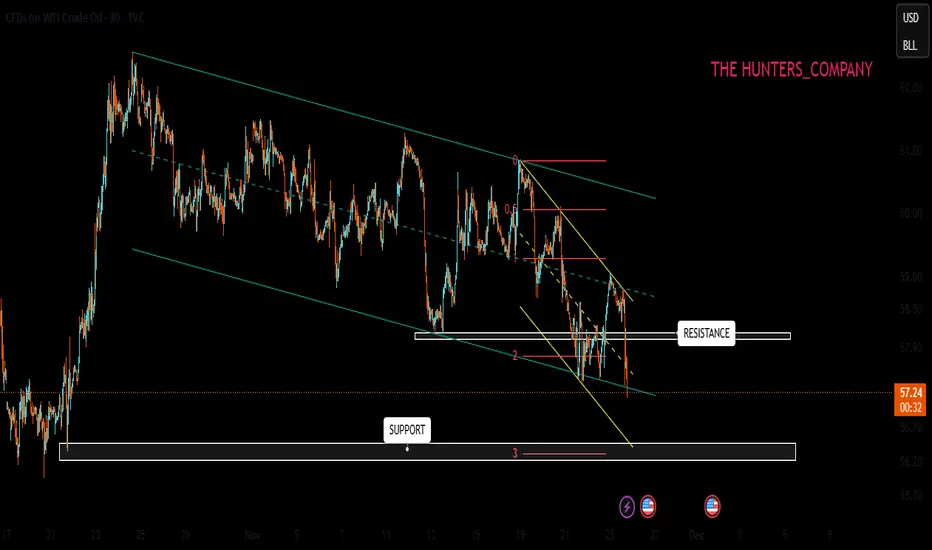
Well, you see that we have a descending channel in which the price is moving, and considering that the price reached the ceiling of the channel, we had a Sharpe decline, and now it seems that the sellers want to break the channel, and the first support identified could be the buyers' stronghold, where we need to see if they support the price or not.
If they support, there is a significant resistance in their way. This area is full of sell orders and can naturally correct the price. In this regard, breaking this resistance is very important and vital for price growth.
Now what if the buyers cannot support the price in the support area and the price falls further?
Well, we need to find areas again for a sell trade because if the descending channel is broken, the fall will be heavier and it is better to move with the trend.
This analysis is purely technical and is not a buy or sell recommendation.
*Trade safely with us*
Oil Market Outlook: Range-Bottom Reaction AheadHello traders,
Today I’m here with an analysis of Crude Oil.
Based on the chart, as you can see, the price is currently sitting on a support level.
Considering the global geopolitical situation and ongoing conflict news, we may see a potential rise in price.
Overall, we are looking at a sideways (range) market, and the price is now at the bottom of this range.
Therefore, our target will be the top of the range.

Crude oil I trade smc, as per analysis price is aiming at $6k and above. Choch has occurred and all that is needed is for price to return to the order block then we buy.

us oilHI GUYS,
UPDATE and CORRECTION on US OIL
we wait for sells Friday morning, a few hours from now,
(MON, TUE) Double bottom buy price is calling for a sell price pattern (FRI, MON) Head shoulder

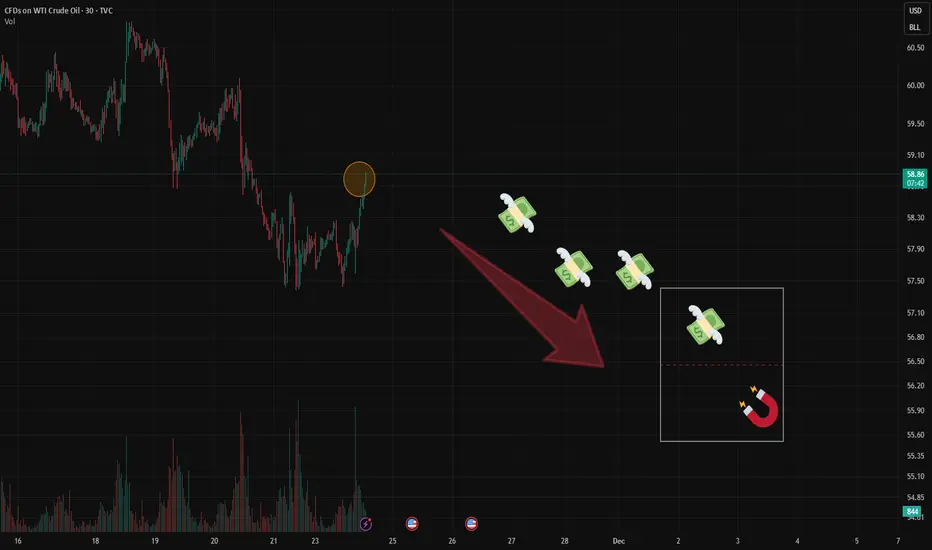
WTI🌎 Major investment banks forecast two stages for oil: a decline due to oversupply, followed by growth from 2027 due to a lack of investment.
After 2027: A prolonged growth period will begin due to a shortage of raw materials.
A gradual, slow decline in oil prices is observed.
We are near a support level, a break of which could accelerate the decline in prices.

Oil Prices Record Their Worst Monthly Performance Since 2023!Oil prices are heading toward their worst monthly performance since 2023, with Brent crude down about 15% this year due to expectations of a significant global supply surplus. The OPEC+ alliance is expected to maintain its decision to freeze production increases in early 2026, while long-term reviews of members’ production capacities are underway. Forecasts also point to a daily surplus reaching 2.8 million barrels in 2026 and 2.7 million barrels in 2027, adding further selling pressure.
Additionally, geopolitical developments may impact the market, as Russia has expressed readiness to discuss proposals to end the war in Ukraine. This could eventually lead to easing sanctions and the return of Russian oil flows to global markets, which would increase supply and weigh on prices.
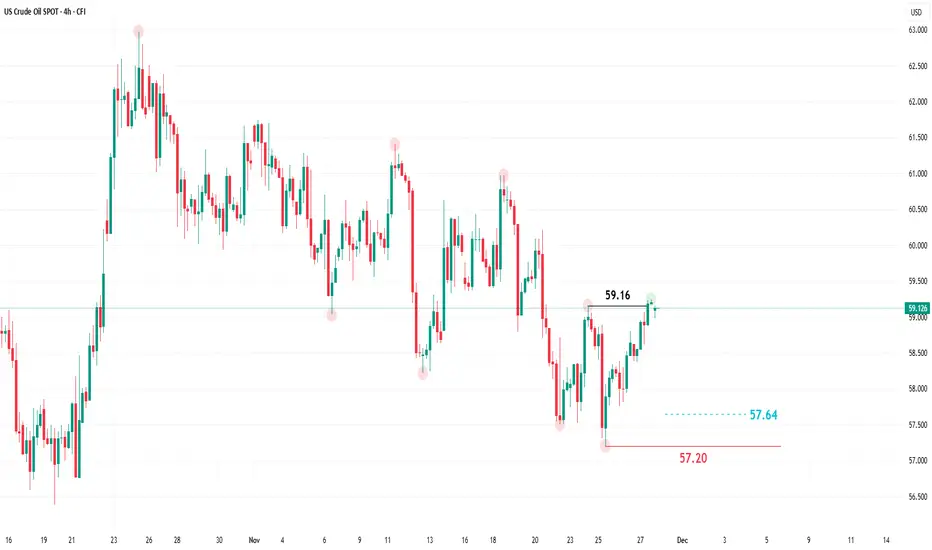
On the technical side, the price on the 4-hour timeframe has risen and formed a higher high above the 59.16 level, shifting the trend from bearish to bullish in the short to medium term.
The price may rise directly from the current levels near 59.126, or it may retrace toward 57.64 before rebounding again to target the 59 level.
The opposite scenario to the current bullish outlook would be a decline below 57.20 and the formation of a lower low on the 4-hour timeframe.
USOIL Will Go Lower From Resistance! Sell!
Take a look at our analysis for USOIL.
Time Frame: 4h
Current Trend: Bearish
Sentiment: Overbought (based on 7-period RSI)
Forecast: Bearish
The price is testing a key resistance 59.046.
Taking into consideration the current market trend & overbought RSI, chances will be high to see a bearish movement to the downside at least to 58.167 level.
P.S
Please, note that an oversold/overbought condition can last for a long time, and therefore being oversold/overbought doesn't mean a price rally will come soon, or at all.
Like and subscribe and comment my ideas if you enjoy them!

WTI OIL Short-term relief rebound before a Lower Low?WTI Oil (USOIL) has been trading within a 1-month Channel Down and has just completed its strongest Bearish Leg (-5.91%). All previous three Bearish Legs eventually bottomed and rebounded into the new Bullish Legs towards the Sell Zone consisting of the 4H MA200 (orange trend-line) - 1D MA50 (red trend-line) range to form a new Lower High.
In 2 out of those 3 cases, it even exceeded the 0.618 Fibonacci retracement level. As a result, we expect a short-term rise now to subsequently be sold towards the -0.236 Fibonacci extension. Our medium-term Target remains 56.500.
---
** Please LIKE 👍, FOLLOW ✅, SHARE 🙌 and COMMENT ✍ if you enjoy this idea! Also share your ideas and charts in the comments section below! This is best way to keep it relevant, support us, keep the content here free and allow the idea to reach as many people as possible. **
---
💸💸💸💸💸💸
👇 👇 👇 👇 👇 👇

USOIL H1 | Bearish Reversal Off key ResistanceMomentum: Bearish
The price is rising towards the sell entry, which aligns with the 61.8% Fibonacci projection.
Sell entry: 59.31
Pullback resistance
61.8% Fibonacci projection
Stop loss: 60.03
Pullback resistance
145% Fibonacci extension
Take profit: 58.16
Pullback support
High Risk Investment Warning
Stratos Markets Limited (tradu.com ), Stratos Europe Ltd (tradu.com ):
CFDs are complex instruments and come with a high risk of losing money rapidly due to leverage. 70% of retail investor accounts lose money when trading CFDs with this provider. You should consider whether you understand how CFDs work and whether you can afford to take the high risk of losing your money.
Stratos Global LLC (tradu.com ): Losses can exceed deposits.
Please be advised that the information presented on TradingView is provided to Tradu (‘Company’, ‘we’) by a third-party provider (‘TFA Global Pte Ltd’). Please be reminded that you are solely responsible for the trading decisions on your account. Any information and/or content is intended entirely for research, educational and informational purposes only and does not constitute investment or consultation advice or investment strategy. The information is not tailored to the investment needs of any specific person and therefore does not involve a consideration of any of the investment objectives, financial situation or needs of any viewer that may receive it. Past performance is not a reliable indicator of future results. Actual results may differ materially from those anticipated in forward-looking or past performance statements. We assume no liability as to the accuracy or completeness of any of the information and/or content provided herein and the Company cannot be held responsible for any omission, mistake nor for any loss or damage including without limitation to any loss of profit which may arise from reliance on any information supplied by TFA Global Pte Ltd.

Usoil Next MoveUsoil Under Selling Pressure We Sell At 62.045 For Tp 52.02
Usoil In Bearish Structure Don't Miss This Opportunity Manage Your Risk Properly
For more updates Stay Tuned

USOIL FREE SIGNAL|SHORT|
✅WTI OIL is returning into the higher-timeframe supply after clearing buy-side liquidity, signaling distribution. If rejection confirms, bearish displacement could drive price toward the sell-side liquidity target below.
—————————
Entry: 58.70$
Stop Loss: 59.00$
Take Profit: 58.12$
Time Frame: 3H
—————————
SHORT🔥
✅Like and subscribe to never miss a new idea!✅

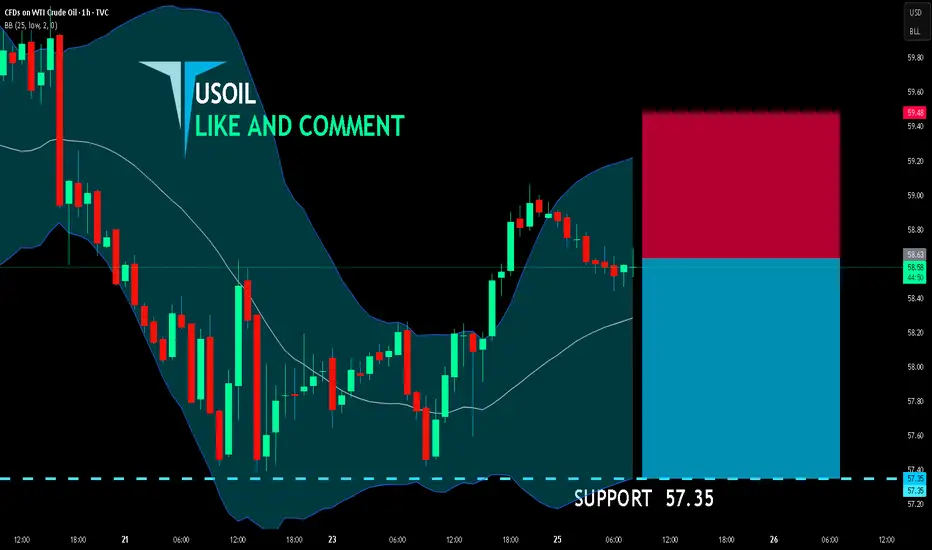
USOIL BEARS ARE GAINING STRENGTH|SHORT
USOIL SIGNAL
Trade Direction: short
Entry Level: 58.63
Target Level: 57.35
Stop Loss: 59.48
RISK PROFILE
Risk level: medium
Suggested risk: 1%
Timeframe: 1h
Disclosure: I am part of Trade Nation's Influencer program and receive a monthly fee for using their TradingView charts in my analysis.
✅LIKE AND COMMENT MY IDEAS✅
Crude Oil 4H Falling Channel OutlookCrude Oil continues to respect the falling channel on the 4 hour chart. Every move toward the upper trendline is facing heavy selling pressure. Recent rejection from the 58.25 and 58.80 supply zones pushed price back down toward the 57.40 support area.
The bounce from the grey box looks corrective and not strong enough to confirm reversal. The major support remains at the 57.00 to 57.20 green zone. Multiple retests show this level is weakening and a break below it can open room for further downside.
On the upside, buyers need a clean breakout above the falling trendline to shift momentum. First targets on a breakout remain 58.25 and then 58.80.
Key Resistance Zones: 58.25, 58.80, 60.05
Key Support Zones: 57.40, 57.00
Bias remains bearish until the channel is broken.


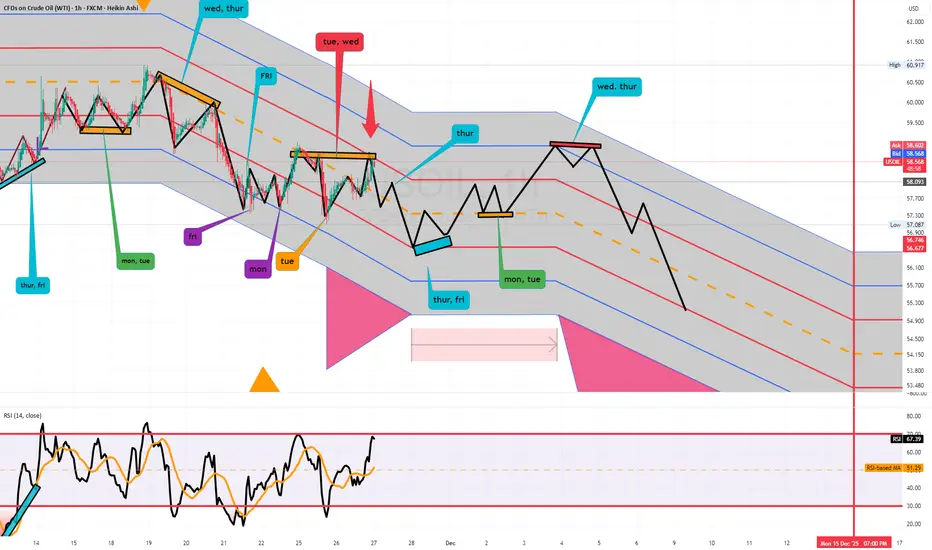
US OILHI GUYS
CORRECTION AND UPDATE ON US OIL
we are around sell area.
Today i expect sells on ( tue, wed) double top price pattern as shown above
Earlier today i adjusted from h4, h6,h8 to Daily path.
The ( RT Daily type 1 ) Illustration will be in comment section.
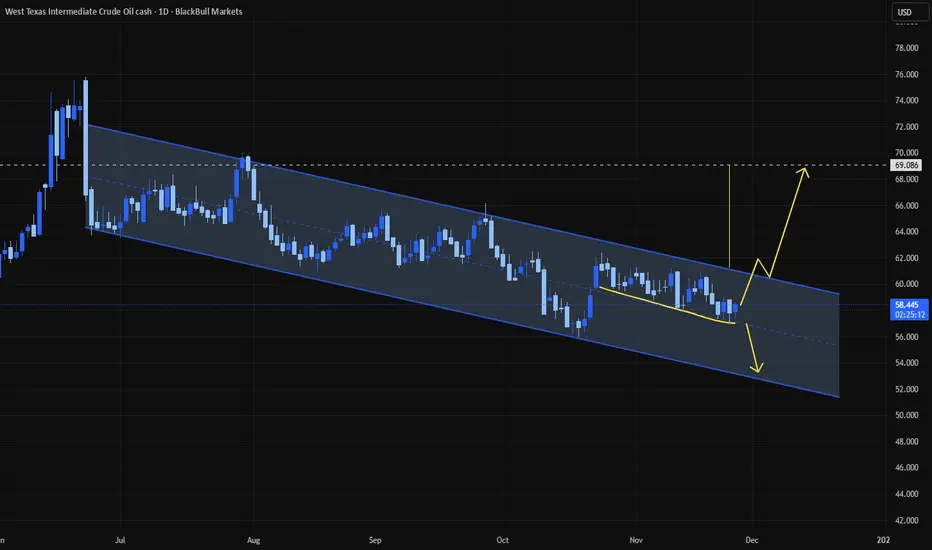
Oil AnalysisFor over a month, oil has been hovering right around the channel’s midline, leaving the market indecisive. We have two scenarios for this situation. Since this analysis is on the daily timeframe, it could take several weeks for either scenario to play out—or it could happen overnight.
To get a clearer picture of oil’s next move, we’re focusing on the daily chart:
Scenario 1 – Breakout to the upside (our preferred scenario)
If the price breaks above the channel’s top and confirms it, we can follow the move up to around $68 according to the classic channel pattern target.
This scenario is our priority because it offers a larger target and higher profit potential.
Scenario 2 – Move toward the bottom of the channel
If the price moves downward, we can follow it to the channel’s bottom, but naturally, the target is smaller.
Why do we prefer a long position in a downtrend?
The reasoning is entirely fundamental:
Instability in the Middle East increases geopolitical risks, which usually drives speculative demand for oil.
For this reason, the upside breakout scenario is considered worth taking, even if the overall structure remains bearish.
WTI Crude Holds at Its Lowest Levels of the YearWTI crude oil continues to show a steady bearish bias below the 60-dollar area in the short term. For now, selling pressure has remained firm, while recent comments regarding the military conflict between Ukraine and Russia point to an increase in reinforcements aimed at achieving a possible ceasefire. Such a scenario could reduce the economic sanctions currently imposed on Russia and, over time, become an important factor that drives a stronger-than-expected recovery in global crude production. This backdrop has kept confidence in the price of the barrel limited, reinforcing a persistent bearish tone that could continue if an official ceasefire is eventually reached.
Medium-Term Trend Remains Firm:
During the second half of the year, the prevailing bearish movements in WTI have maintained a perspective aligned with a solid medium-term downward trendline. So far, no meaningful buying corrections have appeared that could threaten this bearish structure in recent weeks, making it likely that this formation will continue to dominate most price movements in the medium term—especially if the market continues to trade below the 50-period simple moving average.
Neutrality Begins to Emerge in Indicators:
At the moment, both the RSI line and the MACD histogram remain oscillating within the neutral range of their respective indicators. This suggests that, in the short term, both the average selling and buying impulses and the directional strength of the moving averages remain in a neutral and indecisive zone, which can partly be explained by the price interacting with important support areas. What matters here is that as long as both indicators maintain this neutral stance, they could open the door for potential bullish corrections to develop in the coming sessions.
Key Levels to Watch:
60 dollars: This is the main resistance on the chart, aligned with the current downward trendline, the barrier marked by the 50-period moving average, and the 23.6% Fibonacci retracement level. Buying moves that manage to break above this area could trigger a break of the bearish trend, potentially activating a more constructive bullish tone.
58 dollars: This level corresponds to the most recent zone of indecision and could become the reference area to monitor if bullish corrections begin to form within current price movements.
57 dollars: This marks the lowest level of the year and stands as the most relevant bearish barrier at the moment. Selling moves that break below this level could open the door to a more aggressive bearish bias, extending the current downward trend even further.
Written by Julian Pineda, CFA, CMT - Market Analyst

us oilHI GUYS,
CORRECTION AND UPDATE ON US OIL BOTH PRICE PATTERN AND DAYS OF THE WEEK
We currently selling, however the range is not over, i expect (mon, tue) double bottom for buys and (fri, mon) head shoulder sell correction next week.

Analysis of Core Factors in the Short-Term Oil MarketSupply Side: The oversupply situation has become a consensus, and the geo-political support has failed
- Global supply remains consistently tight: The OPEC report in November adjusted the global oil situation to be in an oversupply state. The current daily production exceeds demand by 500,000 barrels, while the previous month's estimate was a shortage of 400,000 barrels. The IEA has continuously raised the expected global crude oil supply surplus for six consecutive months, and it is predicted that in 2026, there will be a record-breaking surplus of nearly 4 million barrels per day. At the same time, the supply increase in the United States is significant. As of the week of November 21, the total number of oil drilling rigs in the United States increased to 419. The Trump administration also plans to open new drilling areas in the west coast and the Arctic. Additionally, although OPEC+ has suspended production increases in the first quarter of next year, the overall supply growth trend remains strong, making it difficult to change the oversupply situation.
- Geopolitical risks have marginally eased: There have been signals of peace talks in the Ukraine conflict. US officials stated that Ukraine has agreed to the terms of the peace agreement, with only some details yet to be finalized. Zelensky expects to "as soon as possible" visit the United States to advance the agreement. This news has weakened the geopolitical risk premium for oil. Although Russian refineries and export ports have been attacked multiple times recently, Russia can buffer through methods such as temporary storage in floating tanks, and the short-term export pressure is limited, making it difficult to have a substantive impact on supply.
Crude Oil Strategy Analysis
sell:58.5-59
tp:58-57.5
sl:59.5
WTIUSD (UPDATE)Hi everyone, I speak Malay language, so here we can see the WTI price is a bit lower than what we marked, but I believe the WTI price can reach the level I targeted in the image.
Maybe my prediction will take a bit longer, so my target for WTI is just a LONG TERM one. Remember, long term.|

USOIL Is Very Bearish! Sell!
Please, check our technical outlook for USOIL.
Time Frame: 15m
Current Trend: Bearish
Sentiment: Overbought (based on 7-period RSI)
Forecast: Bearish
The market is approaching a significant resistance area 57.983.
Due to the fact that we see a positive bearish reaction from the underlined area, I strongly believe that sellers will manage to push the price all the way down to 57.471 level.
P.S
We determine oversold/overbought condition with RSI indicator.
When it drops below 30 - the market is considered to be oversold.
When it bounces above 70 - the market is considered to be overbought.
Like and subscribe and comment my ideas if you enjoy them!

Oil Upd:Price at Resistance–But the Real Story Is in OptionFlowRight now, price has reached the upper boundary of the 1σ Expected Range (ER).
A pause or rejection here is possible.
But that’s not the main story.
Bears are getting active in the options market.
First sign: A significant Put Condor has appeared — large enough to stand out.
Target range: $55–$57
Timeframe: 20 days to expiry
📌 For those still learning:
A Condor profits most when price stays within a tight range at expiry.
Second wave of bearish positioning:
Additional players are placing Put Spreads targeting $54–$55, but with a much shorter horizon — 5–7 days.
This shows a layered approach:
Short and mid- term pressure expected
🧠 Bottom Line:
I’m not jumping into shorts right now — and I wouldn’t advise it blindly.
But given this growing bearish sentiment, it’s smart to start looking for short setups
Sentiment is building.