Energy Sector Liquidity Purge & Algo Reversal:-WTI Crude WTI Crude 19th Nov 2025: 🛢️ Energy Sector Liquidity Purge & Algo Reversal
Market Journal: WTI Crude Intraday Vector Analysis
Asset: WTI CASH (Spot) Current Price: 60.530 Time: 11:10 AM UTC+4
Strategic Overview: WTI Crude is currently testing a critical demand zone at 60.530 . Our proprietary liquidity models detect a Wyckoff Spring event on the 15m timeframe, suggesting a potential institutional accumulation phase. This aligns with a Bullish Divergence on the RSI, indicating seller exhaustion and a probable mean reversion to the VWAP baseline.
Technical Confluence & Pattern Recognition
Elliott Wave Dynamics: The market has completed a 5-wave motive down-move. We are currently in the corrective A-B-C phase, with Wave A projected to test immediate resistance. Chart Patterns: A Falling Wedge is maturing on the 1H chart, a classic reversal formation. Intraday price action is carving out an Inverse Head and Shoulders right shoulder. Indicator Matrix:
Bollinger Bands: Price has pierced the Lower Band and is snapping back, signaling an oversold bounce.
Volume Profile: Declining volume on the recent down-leg confirms weakening bearish pressure.
Ichimoku Cloud: Price is below the Kumo, but the Chikou Span is approaching price, hinting at a potential breakout attempt.
Actionable Trade Plan (Intraday)
// Key Levels of Interest Resistance_Zone = 61.200 - 61.500 Pivot_Point = 60.800 Support_Level_1 = 60.200 Support_Level_2 = 59.800
🟢 Bullish Scenario (Primary): A confirmed breakout above 60.800 validates the reversal thesis. Entry: 60.850 - 60.900 Stop Loss: 60.400 Take Profit 1: 61.500 (200 EMA) Take Profit 2: 62.100 (Key Supply Zone)
🔴 Bearish Scenario (Alternative): Rejection at the pivot or loss of 60.200 resumes the downtrend. Entry: Below 60.150 Target: 59.500
Disclaimer: This analysis is for educational purposes only and does not constitute financial advice. Trading commodities involves significant risk.
Trade ideas

Crude oil trading strategyDemand side: Structural highlights stand out, terminal consumption resilience exceeds expectations
Asia resumes replenishment demand temporarily
China's refining margins have recovered (the 3-2-1 cracking spread has risen to $26 per barrel), with sufficient remaining import quotas in November, and it is expected that crude oil purchase volume will increase by 12%-15% in the latter half of the month. India's refineries have initiated a new round of replenishment due to the traditional consumption peak in December (increased holiday travel), with the import volume expected to exceed 5.4 million barrels per day in November. The increase in Asian demand accounts for more than 70% of the global demand increase, becoming a key support for short-term bulls.
Finished oil inventory reduction confirms consumption resilience
The latest EIA data shows that gasoline inventories have decreased for two consecutive weeks (cumulative reduction of 1.8 million barrels), and distillate oil inventories have decreased for three consecutive weeks (cumulative reduction of 2.1 million barrels). The extent of finished oil inventory reduction far exceeds market expectations, reflecting the resilience of terminal consumption. U.S. gasoline retail sales increased by 3.2% month-on-month (a new high in the past two months), and European diesel consumption decreased by 2.1% (previously 5.8%), with the improvement in the consumption side easing concerns about "weak demand", providing fundamental support for the rebound in crude oil prices.
Crude oil trading strategy
buy:59.30-59.60
tp:60.20-60.50
sl:58.80

#OIL Buy@low Sell@highPast few days I am buying #crudeoil on every drip.
I am expecting the oil could be in a Bull run for the next few months.
#buy@low #sell@high
Simple trading strategy support & resistance
All trading methods will give only 49% or 51% - #money Management is the key
Your money management only decides your profit
#BTC #forex #supportortandresistance #tradinging #swingtradingstrategies #buy #sellll #EURUSD #goldd #niftyy #s&p #etf #qqq #iwm #future #options #longterm#buyy
@low #sell@high
Any trade money management is a tool to help you grow your portfolio.
Simple trading strategy support & resistance
All trading methods will give only 49% or 51% - #moneyManagement is the key
Your money management only decides your profit
#BTC #forex #supportortandresistance #tradinging #swingtradingstrategies #buy #sell #EURUSD #Gold #niftyy #s&p500 #etf #QQQ #IWM #future #options #longterm #XAUUSD #silver #USDCAD #BTCUSD
#BTC #forex #supportortandresistance #tradinging #swingtradingstrategies #buy #sellll #EURUSD #goldd #niftyy #s&p #etf #qqq #iwm #future #options #longterm #btc #forex #etf #option #money #earning #dollars #bitcoin,#btc,#spy,#forex,#bitcoin,#supportlevel,#RESISTANCELEVEL,#TESLA,#S&P500,#NVDIA,#APPLE,#AMAZON,#NIFTY,#META,#RSI,#STOCKMARKET,#SHAREMARKET,#GOLD,#OIL,#SILVER,#INTRADAY,#SWINGTRADE,#LONGTERM,#INVESTMENT,#SELL,#BUY,#BID,#ASK,#MARKET,#INVESTORS,#IWM,#OPTION,#FUTURES,#US,#ALIBABA,#CASH,#CASHFLOW

USOIL Breakout Confirmed—Is the Uptrend Ready to Extend?📈 WTI CRUDE OIL (USOIL) – SWING TRADE SETUP | VWMA BREAKOUT CONFIRMED 🛢️⚡
🎯 TRADE OVERVIEW
Asset: WTI Crude Oil (USOIL) – Energies Market
Trade Type: Swing Trade (Multi-Day Position)
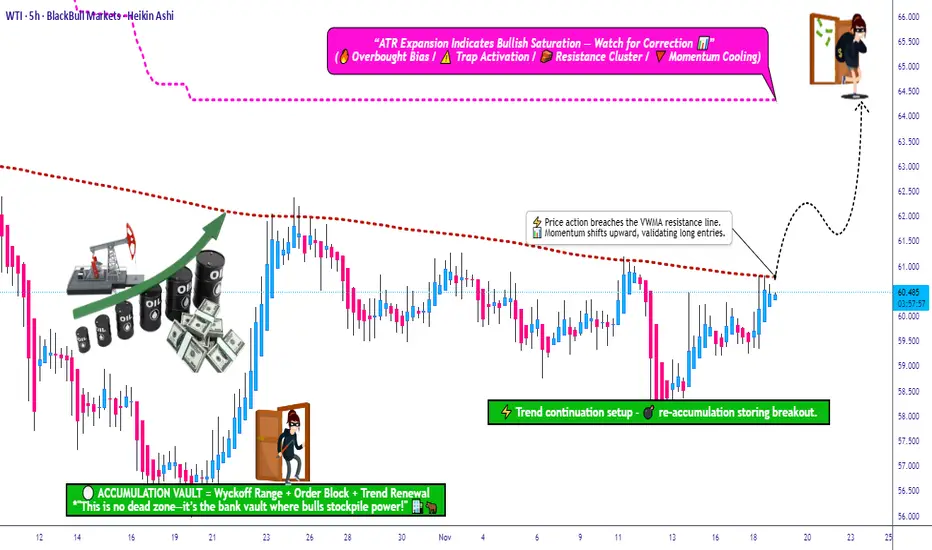
Bias: 🟢 BULLISH – Volume Weighted Moving Average (VWMA) breakout confirmed near $61.00
📊 TRADE PLAN
🔹 Entry Strategy: "Thief Layering Method"
Primary Entry Zone: Post-VWMA breakout above $61.00
Layered Limit Orders (Multiple Entry Points):
🟦 Layer 1: $59.00
🟦 Layer 2: $59.50
🟦 Layer 3: $60.00
🟦 Layer 4: $60.50
Note: You can add more layers based on your capital allocation and risk tolerance. This strategy allows averaging into the position as price pulls back.
🛑 Stop Loss Management
Thief's SL: $58.00
⚠️ IMPORTANT: Dear Ladies & Gentlemen (Thief OG's),
This is MY stop loss level. Adjust YOUR stop loss based on YOUR strategy and risk management plan. I do not recommend blindly following my SL – manage your own risk and capital accordingly.
🎯 Take Profit Target
Primary Target: $64.00
Technical Reasoning:
SuperTrend ATR line acts as strong dynamic resistance
Potential overbought zone + bull trap risk
Escape with profits before reversal pressure
⚠️ IMPORTANT: Dear Ladies & Gentlemen (Thief OG's),
This is MY take profit target. Take YOUR money at YOUR own risk. You are responsible for your profit-taking strategy – trail stops, scale out, or exit fully based on YOUR trading plan.
🔗 CORRELATED PAIRS TO WATCH (USD-Denominated)
Monitor these related assets for confirmation and risk assessment:
🛢️ Energy Sector:
Brent Crude Oil (UKOIL) – Typically trades $2-5 above WTI; if Brent is bullish, WTI usually follows
Natural Gas (NATGAS) – Energy sector sentiment indicator
💵 Currency Pairs:
USD/CAD – Inverse correlation to oil (CAD = petro-currency). If oil rises, USD/CAD typically falls
DXY (US Dollar Index) – Strong dollar = bearish pressure on oil. Watch for weakness in DXY to support oil rally
📈 Equity Markets:
Energy Sector ETFs (XLE) – Tracks US energy stocks; bullish XLE confirms oil sector strength
S&P 500 (SPX) – Risk-on sentiment supports commodity prices
⚡ Key Correlation Points:
Oil ↑ + USD/CAD ↓ = Strong bullish confirmation
Oil ↑ + DXY ↓ = Supportive macro environment
Oil ↑ + XLE ↑ = Energy sector momentum aligned
💬 Engagement Call-to-Action
👍 If you found this analysis helpful, smash that LIKE button!
💬 Drop your thoughts in the comments – are you bullish or bearish on oil?
🔔 FOLLOW for more professional trade setups and market insights!
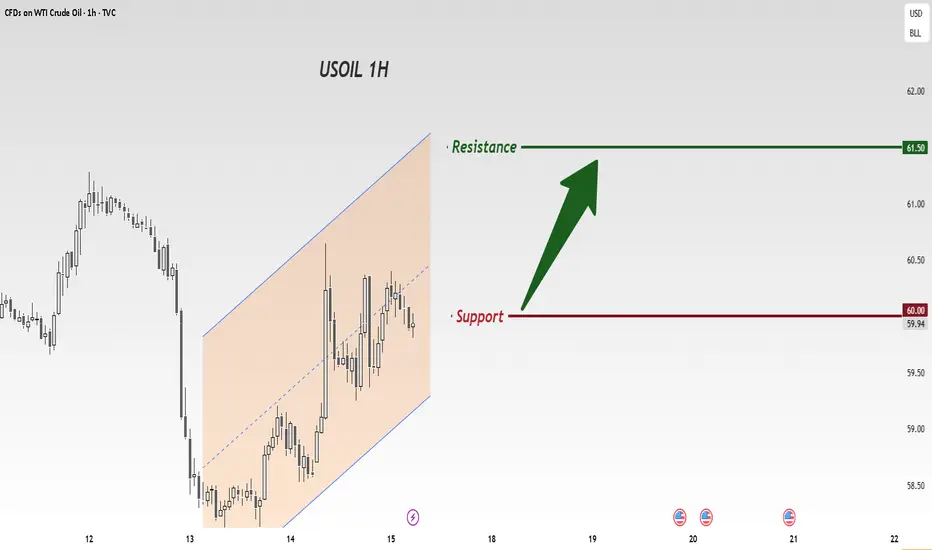
USOIL ANALYSIS SETUP READ THE CAPTIONUSOIL is consolidating above a strong support zone while forming higher lows, indicating bullish pressure building. Price is currently testing the trendline resistance, and a clean breakout could open the way toward the upper target zone. As long as price stays above support, the bullish scenario remains valid.
Please Support with Boost and comments


us oilHI GUYS.
UPDATE ON CURRENT SITUATION
US OIL.
we failed to reach area of interest however i made buys 2 hours ago.
I expect sells wed, thur. Double top price.
after this correction we are going to dump crazily.


USOIL : LIVE TRADEHello friends
Given the price growth, you can see that buyers have repeatedly tried to break the resistance but were unsuccessful and the weakness of the trend is quite clear.
Now we can trade with capital and risk management and account management.
This is not a buy or sell offer.
*Trade safely with us*

USOIL Is Bullish! Buy!
Please, check our technical outlook for USOIL.
Time Frame: 9h
Current Trend: Bullish
Sentiment: Oversold (based on 7-period RSI)
Forecast: Bullish
The market is trading around a solid horizontal structure 59.384.
The above observations make me that the market will inevitably achieve 61.007 level.
P.S
The term oversold refers to a condition where an asset has traded lower in price and has the potential for a price bounce.
Overbought refers to market scenarios where the instrument is traded considerably higher than its fair value. Overvaluation is caused by market sentiments when there is positive news.
Like and subscribe and comment my ideas if you enjoy them!

Oil analysis that was in our weekly watchlistIn our weekly watchlist, we had a bullish outlook on Oil, and that analysis is still valid. The main reason for this bias is the multiple rejections of price from the resistance zone. There’s a strong possibility that price may break this level with a strong impulsive candle.
To avoid missing the move, using a Buy Stop order in such a scenario can be a smart approach

U S OILHI GUYS,
We expected a small triple top price pattern H4 last week,
however what has change is a market failed to form the correct sell pattern leading to a wide spread ranging as illustrated in the white box with wrong combination of sell patterns colored purple days of the week strategy.
we are currently out of the white box as of Friday yesterday market presented a proper price pattern on the on going correction.
we expect a continuation buy pattern (Monday, Tuesday) . then later in the week we then expect a sell pattern (Wednesday, Thursday) correction around level 61000

BULLISH SCENARIO - USOILHello traders,
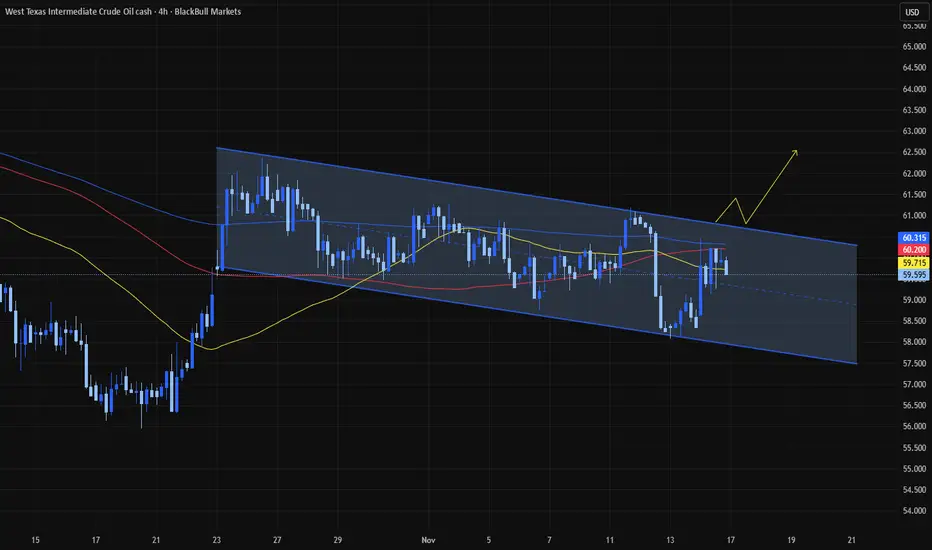
USOIL is currently moving inside a descending channel.
A bullish breakout is in focus:
If the price breaks the channel resistance and confirms the close above,
a strong upward movement is expected 🚀
🎯 TARGET: 65.150

USOIL : daily review 17/11/2025Oil prices also slipped after Russia’s Novorossiysk port quickly resumed operations following a Ukrainian strike, removing a short-lived supply scare. Geopolitical tensions remain elevated, with notable examples including Iran’s seizure of a tanker and the ongoing US sanctions on Russia; however, rising global production remains the dominant force. Outages and disruptions across refining hubs have pushed margins higher; however, the broader trend suggests a well-supplied market heading into next year.
In addition, many traders don’t expect OPEC+ to cut production next year, even with a potential surplus on the horizon. The group is sticking to its market-share strategy unless demand collapses and prices drop sharply. Saudi Arabia and its partners have revived output despite weak prices, betting that oversupply remains manageable and that China can continue to absorb excess barrels.
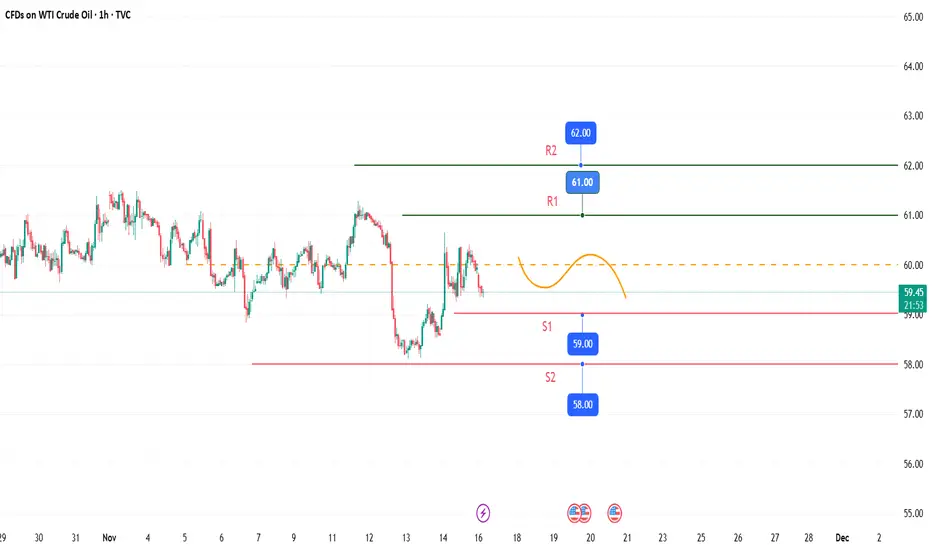
On the technical side, the crude oil price found sufficient support around the $58 mark, which is a combination of the lower band of the Bollinger Bands and the 23.6% Fibonacci retracement level, and has since corrected to the upside. Although the moving averages are confirming an overall bearish trend in the market, the recent bullish correction could persist into the upcoming sessions and potentially retest the latest high around $61, if it manages to break above the psychological resistance of the round number at $60. The Stochastic oscillator is in neutral levels, indicating potential for the price to move either way in the short term. However, the overly contracted Bollinger Bands may limit price action in the short term, likely keeping the price within sideways action between $58 and $62 for now.
Disclaimer: The opinions in this article are personal to the writer and do not reflect those of Exness

BULLISH MOVEPrice is on retracement move to a supply zone. Lets expect a small bullish movement to the supply zone. But if not ready to risk lets wait for the price to reach supply zone and sell.

USOIL Will Move Higher! Buy!
Take a look at our analysis for USOIL.
Time Frame: 2h
Current Trend: Bullish
Sentiment: Oversold (based on 7-period RSI)
Forecast: Bullish
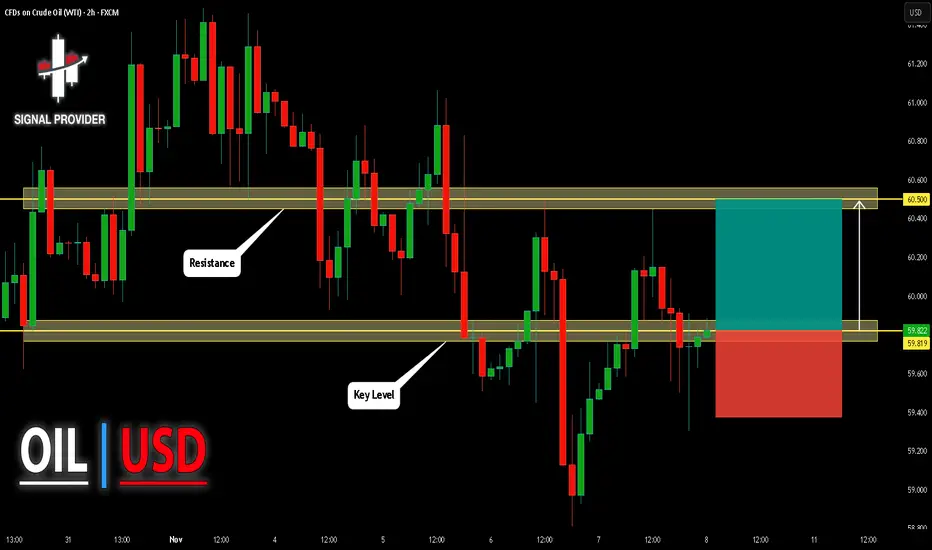
The price is testing a key support 59.819.
Current market trend & oversold RSI makes me think that buyers will push the price. I will anticipate a bullish movement at least to 60.500 level.
P.S
Please, note that an oversold/overbought condition can last for a long time, and therefore being oversold/overbought doesn't mean a price rally will come soon, or at all.
Like and subscribe and comment my ideas if you enjoy them!
Potential bearish drop?WTI Oil (XTI/USD) has rejected off the pivot and could drop to the 1st support which acts as a swing high resistance.
Pivot: 62.22
1st Support: 54.92
1st Resistance: 65.94
Disclaimer:
The opinions given above constitute general market commentary and do not constitute the opinion or advice of IC Markets or any form of personal or investment advice.
Any opinions, news, research, analyses, prices, other information, or links to third-party sites contained on this website are provided on an "as-is" basis, are intended to be informative only, and are not advice, a recommendation, research, a record of our trading prices, an offer of, or solicitation for, a transaction in any financial instrument and thus should not be treated as such. The information provided does not involve any specific investment objectives, financial situation, or needs of any specific person who may receive it. Please be aware that past performance is not a reliable indicator of future performance and/or results. Past performance or forward-looking scenarios based upon the reasonable beliefs of the third-party provider are not a guarantee of future performance. Actual results may differ materially from those anticipated in forward-looking or past performance statements. IC Markets makes no representation or warranty and assumes no liability as to the accuracy or completeness of the information provided, nor any loss arising from any investment based on a recommendation, forecast, or any information supplied by any third party.

USOIL: Consolidation First, Breakout Next After crude oil plummeted last week to a low near 58.1, it rebounded on Friday and closed around 59.5, basically confirming a consolidating trend.
For this week, crude oil is expected to first trade in a low-range consolidation before assessing the potential for a unilateral move. Focus on the 58 level as support below and 62 as resistance above; trade within this range using a "buy low and sell high" strategy.
Go long around the 58.2 level.
Go short around the 61.8 level.
If the price breaks out of this range, then look for a unilateral trend to follow.
Core trading logic:The current crude oil market is in a balanced state of "relatively abundant supply + weak demand + macroeconomic uncertainty + technical fluctuations", with no clear trend direction. Therefore, a mixed strategy of "interval high selling and low buying + breakthrough confirmation for follow-up" is adopted. The focus is on the core range of $58 - $61. Buy at the support level and sell at the resistance level. At the same time, a follow-up position after a trend breakthrough is reserved to balance stability and flexibility.
Crude oil trading strategy
buy:60-60.5
tp:61-61.5
sl:59.5
OIl in to start wave e of traingle B (Long - Short/Medium Term)- The clearest count right now is that we are in the start of wave E around 65- 70 of traiangle B.
- To follow a deeper correcton for wave C to around $30 a Barrel

US-Oil will further push Down-sideHello Traders
In This Chart xtiusd HOURLY Forex Forecast By FOREX PLANET
today XTIUSD analysis 👆
🟢This Chart includes_ (XTIUSD market update)
🟢What is The Next Opportunity on XTIUSD Market
🟢how to Enter to the Valid Entry With Assurance Profit
This CHART is For Trader's that Want to Improve Their Technical Analysis Skills and Their Trading By Understanding How To Analyze The Market Using Multiple Timeframes and Understanding The Bigger Picture on the Charts
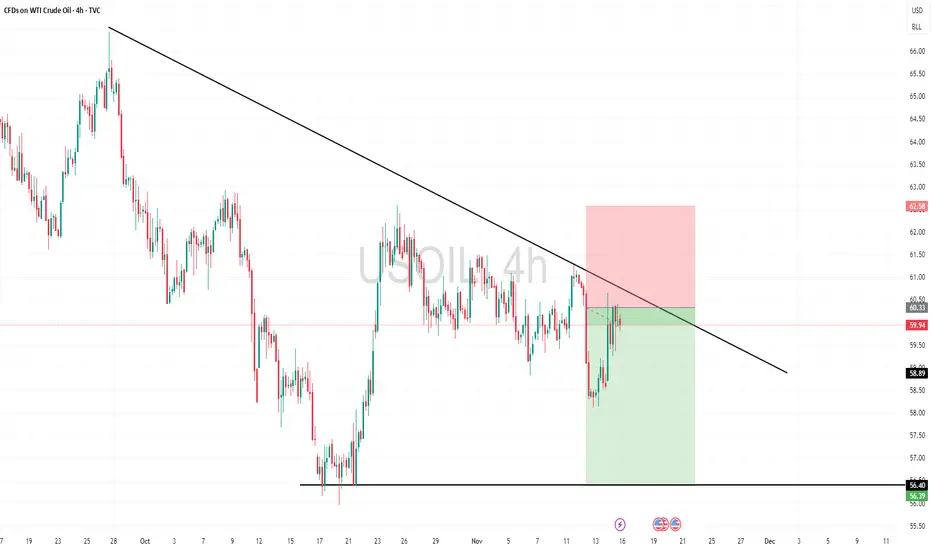
Weekly Watchlist – Oil AnalysisThese days, oil prices have dropped due to the relatively calm situation in the Middle East. However, over the past couple of days, disruptions in tanker traffic suggest that oil could open **higher this week**.
Therefore, a breakout above the channel — after proper confirmation — could present a **long position opportunity**. It’s essential to wait for confirmation to ensure the price doesn’t fake out and return back into the channel.