WTI Crude The Week Ahead Key Trading LevelsKey Support and Resistance Levels
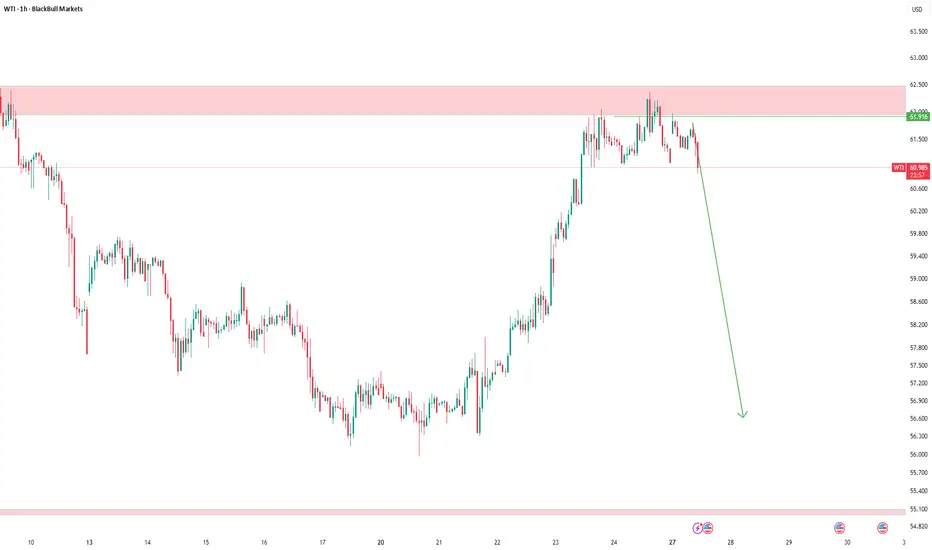
Resistance Level 1: 6150
Resistance Level 2: 6210
Resistance Level 3: 6300
Support Level 1: 5936
Support Level 2: 5845
Support Level 3: 5777
This communication is for informational purposes only and should not be viewed as any form of recommendation as to a particular course of action or as investment advice. It is not intended as an offer or solicitation for the purchase or sale of any financial instrument or as an official confirmation of any transaction. Opinions, estimates and assumptions expressed herein are made as of the date of this communication and are subject to change without notice. This communication has been prepared based upon information, including market prices, data and other information, believed to be reliable; however, Trade Nation does not warrant its completeness or accuracy. All market prices and market data contained in or attached to this communication are indicative and subject to change without notice.
Trade ideas

WTI OIL 1:2 RRThis is a trade idea, posting for future reference
not to be taken as financial advice
Tade closes at 9 am pst, by stop or tp hit as i will not monitor this trade.

USOIL strong down trend entry on consolidation breakdown USOIL Technical Outlook – 4H Timeframe
USOIL continues to show strong downside momentum, with sellers maintaining control. Price is currently respecting the downtrend structure, and a consolidation breakdown below 59,100 is confirming further bearish pressure.
📉 Key Technical Levels:
Immediate Support: 58,300
Next Major Support: 56,400
As always, ensure you are using proper risk management and wait for clear confirmations before entering any position.
👍 Like • Follow • Comment • Share
Stay updated for more professional market insights.

Oil Under Pressure!Crude oil futures rose more than 1% toward $60 per barrel on Friday, heading for an end to a two-week losing streak, supported by supply risks linked to geopolitical tensions. The impact of U.S. sanctions also began to appear early, as major Russian companies announced reductions in their oil-trading activities. Analysts warned that a large portion of Russia’s seaborne oil exports may face disruptions due to rerouted shipments and slow unloading, while purchases from some Asian countries have declined.
Meanwhile, bearish pressure persisted as the International Energy Agency projected a growing supply glut, with global output expected to exceed demand by around 2.4 million barrels per day this year and 4 million next year. OPEC data also indicated a surplus in the third quarter, alongside rising U.S. production and increasing inventories.
On the technical front, crude oil prices continue to trade in a overall downtrend, forming lower lows and maintaining a negative structure, with the next target located at $58.93. The downtrend would shift to an uptrend if the price rises above $61.403 and forms a higher high on the 4-hour timeframe.

Oil analysis updateYou go to sleep at night, wake up in the morning, and suddenly see a two-meter candle.
On the 15-minute timeframe, you can trade within this range, and on higher timeframes, stay alert.
It’s a sudden move, so don’t miss the upward push in oil — set an alert or a buy stop.

USOIL (WTI Crude Oil) Long Trade ENtryAnalysis:
Price recently formed a strong bullish reaction after an extended down-move. The market pulled back to retest intraday support around 58.60 and is showing signs of stabilization. A bounce from this level could trigger a continuation move toward the 61.20–61.30 resistance area.
Setup Type: Long Position
Entry: Around 58.60 (support retest)
Stop Loss: 57.94
Target: 61.28
Bias: Bullish above 58.60
Invalidation: Break and close below 57.94
#USOIL #WTICrude #CrudeOil #OilMarket #PriceAction #TechnicalAnalysis #TradingView #LongSetup #CommodityTrading #MarketAnalysis

The bearish trend of crude oil has been establishedDownward revision of global crude oil demand growth expectations, weak terminal consumption
Both OPEC and IEA have lowered their 2025 demand growth expectations. IEA predicts that the annual demand will only increase by 700,000 barrels per day, the slowest growth rate since 2009. The average weekly supply of US crude oil products has decreased by 0.91% year-on-year, European diesel consumption remains sluggish, and the replenishment demand of core Asian consuming countries shows "short cycle, low intensity" characteristics, making it difficult to form a sustained support. Currently, the demand side of crude oil lacks clear growth momentum, and the mismatch between supply and demand has further intensified.
The effect of renewable energy substitution continues, squeezing the space for crude oil demand
Global wind power and photovoltaic installations continue to expand. European wind power output has returned to normal levels, and Asian photovoltaic new installations maintain high growth rates. The electricity supply gap has narrowed, leading to a reduction in crude oil replenishment demand. At the same time, the share of biofuels in the transportation sector has steadily increased, even with short-term cost fluctuations, the long-term substitution trend has not changed, further limiting the growth potential of crude oil demand.
Crude oil trading strategy
sell:58.45-58.55
tp:58.25-58.35
sl:58.15

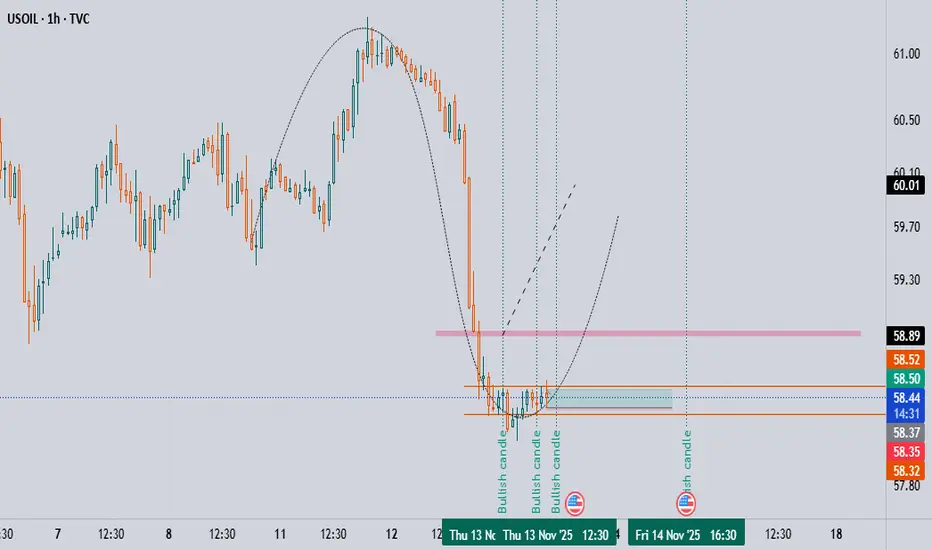
USOIL - Bullish ReversalUSOIL has formed a double bottom with divergence and currently trading near its neckline. Buy stop entry on break of neckline.

Bearish USOIL: 58 at RiskUSOIL extended the previous session's decline today, showing an overall weak fluctuating downward trend. The core bearish factor of oversupply continues to weigh, with a lack of short-term rebound momentum.
On the indicator front, the 9-day EMA has crossed below the 20-day EMA, forming a short-term death cross signal, indicating that the downward trend is likely to continue. The 14-day RSI hovers around 40, remaining in a downward channel with no oversold rebound signals, suggesting that bears still hold the initiative and there is no large-scale entry of bottom-fishing funds.
In terms of resistance and support, short-term rebound resistance is concentrated at the pivot point of 59.28 and the 59.50-60 range. As a key integer level, failure to reclaim 60 will see bearish sentiment continue to spread. For support below, focus first on 55.7; if the 58 level is broken, a accelerated drop to this support level is highly likely.
Trading Strategy:
Buy 58 - 58.3
SL 58
TP 59 - 59.5 - 60
Sell 59.5 - 60
SL 60.5
TP 58.5 - 58 - 57.5

Potential bearish drop?WTI Oil (XTI/USD) could rise towards the pivot and could reverse to the 1st support which acts as a swing low support.
Pivot: 60.07
1st Support: 56.77
1st Resistance: 61.63
Disclaimer:
The opinions given above constitute general market commentary and do not constitute the opinion or advice of IC Markets or any form of personal or investment advice.
Any opinions, news, research, analyses, prices, other information, or links to third-party sites contained on this website are provided on an "as-is" basis, are intended to be informative only, and are not advice, a recommendation, research, a record of our trading prices, an offer of, or solicitation for, a transaction in any financial instrument and thus should not be treated as such. The information provided does not involve any specific investment objectives, financial situation, or needs of any specific person who may receive it. Please be aware that past performance is not a reliable indicator of future performance and/or results. Past performance or forward-looking scenarios based upon the reasonable beliefs of the third-party provider are not a guarantee of future performance. Actual results may differ materially from those anticipated in forward-looking or past performance statements. IC Markets makes no representation or warranty and assumes no liability as to the accuracy or completeness of the information provided, nor any loss arising from any investment based on a recommendation, forecast, or any information supplied by any third party.

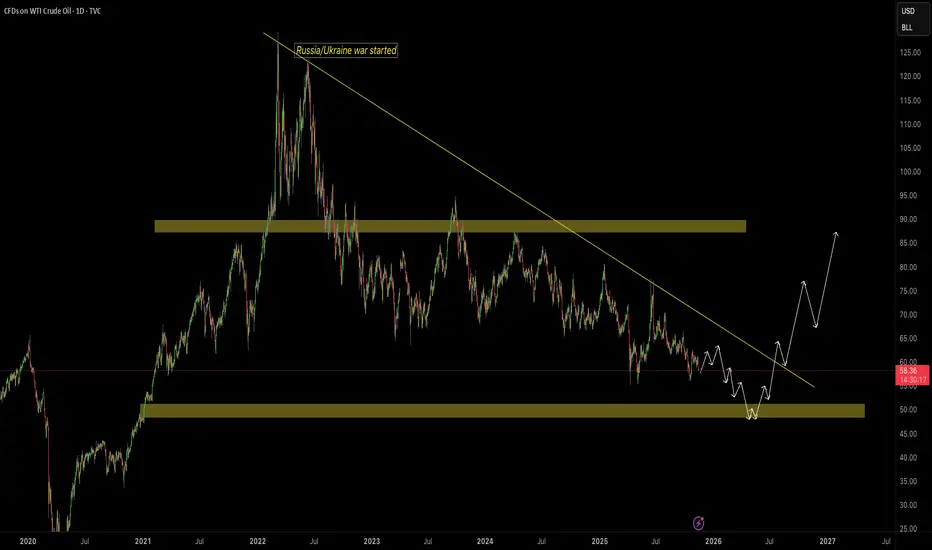
HTF - Crude Oil AnalysisOn the HTF, we can see Crude oil has overall been bearish since 2022 because :
- Geopolitical tensions priced in and faded out.
- Decreased oil consumption of oil. Demand reduced
- Oversupply concerns - OPEC maintained higher levels of oil product. Too much supply & less supply hence lower oil Prices.
· Historically, The markets keep an equilibrium on the price of oil which healthy prices being around $40 - $80 per barrel. This is where oil spends most of its time.
They wouldn’t let oil price drop too low since it would cost producers too much & if its too high, then the consumers will suffer so price always remain a balance.
Future Analysis/forecasts:
· Now we are seeing that Major central banks around the world adopting loose monetary policies and cutting interest rates following suits with the Federal Reserve.
-This would result in more economic activity, more manufacturers using oil etc therefor the demand for Oil will pick up again and we can see price start to rise.
The Contango Conundrum: Why Crude’s Price Power WanesThe global crude oil market is signaling sustained weakness. A clear sign is the Contango in the West Texas Intermediate (WTI) futures curve for most of 2026. This structure prices future oil deliveries higher than immediate ones, strongly indicating a global supply glut. Major forecasting bodies like the International Energy Agency (IEA) and the Organization of the Petroleum Exporting Countries (OPEC) now confirm a record surplus looms in 2026, reversing previous tight market expectations. Understanding this decline requires a multidisciplinary lens, examining supply resilience against sluggish demand across several domains.
Geostrategy and Geopolitics: Production Over Protocol
Geopolitical decisions, paradoxically, contribute to oversupply. OPEC+ members are gradually unwinding previous voluntary production cuts, adding millions of barrels back to the market. This production boost, formalized in their latest agreements, increases supply visibility and dampens price spikes. Simultaneously, sustained geopolitical tensions between major powers often lead key consumers like China to ramp up Strategic Petroleum Reserves (SPR) , effectively soaking up immediate surplus but reducing future demand visibility. This policy-driven stockpiling mitigates immediate price falls, but structural oversupply persists.
Macroeconomics and Economics: Slowdown Meets Resilience
A deceleration in global oil demand growth meets unexpectedly resilient supply . Macroeconomic headwinds, including trade tensions and a sluggish global economic outlook, suppress consumption growth below historical trends. This tepid demand environment is exacerbated by expanding production from non-OPEC+ nations. Crucially, the United States, Brazil, Canada, and Guyana lead this non-OPEC+ supply expansion, challenging the cartel’s market dominance. The resulting imbalance, production exceeding demand, creates the chronic oversupply driving WTI into contango.
Technology and High-Tech: Efficiency Enhances Supply
Advancements in extraction technology dramatically boosted supply, particularly within the US shale sector. Continuous innovations in horizontal drilling and hydraulic fracturing sustain high US output, even as prices soften. Furthermore, the rapid expansion of Electric Vehicle (EV) sales and increasing vehicle fuel efficiencies represent a major technological headwind for transportation fuel demand. This shift, supported by global patent activity in battery and wave energy technology, structurally limits long-term oil consumption growth.
Patent and Science Analysis: The Energy Transition
Patent activity confirms the directional shift away from fossil fuels. While patents related to downhole completion systems and drilling fluid prediction remain, increased patenting in Carbon Capture and Sequestration (CCS) [/b and Green Hydrogen signals the industry's necessary pivot. The science of energy transition, focusing on low-carbon solutions, suggests a future where oil remains a critical input but faces mounting competition from technological substitutes. This long-term displacement risk pressures oil prices, even if demand remains firm in the short run.
Cyber and Strategic Risk: Supply Chain Security
The increasing reliance on complex digital infrastructure across the oil value chain introduces cyber risk . Successful attacks on pipeline operators or refineries can cause temporary supply disruptions and price spikes. However, the market currently views such disruptions as temporary events rather than long-term structural issues affecting the overall supply-demand balance. The oversupply acts as a buffer, with floating storage and ample inventory mitigating the impact of short-term, localized outages.
Investment Outlook: Watching Spreads
The market signals clearly indicate supply strength and demand vulnerability. The widening WTI contango structure provides a clear arbitrage opportunity for traders willing to finance storage. Investors should closely monitor the Brent-Dubai Exchange of Futures for Swaps (EFS), which is turning negative, underscoring specific weakening in the Atlantic Basin. Barring a sharp, coordinated OPEC+ cut or an unexpected large-scale geopolitical conflict, pricing pressure should persist into 2026. Traders must prioritize futures spread analysis over simple outright price forecasting.

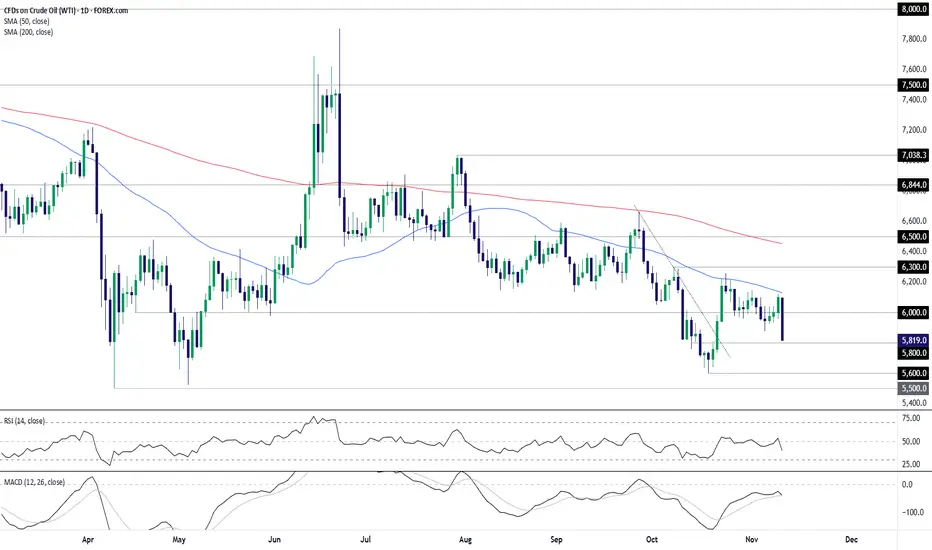
Bearish bar signals risk of deeper crude slideUnable to climb above the 50-day moving average and having just delivered an almighty bearish bar, is WTI crude about to revisit the October lows—an outcome that could put a retest of the YTD lows on the cards? With momentum indicators like RSI (14) and MACD swinging sharply lower, signaling building downside strength, the risk of such a move is growing.
$58.00 is a minor level to watch near term, having acted as support and resistance at times last month. Should price trade beneath this level, shorts could be established on the break with a stop above for protection, targeting a run toward the October swing low of $56.00. The preference would be to see a back-test and rejection of the level before entry.
While short setups are favored given recent price and momentum signals, should WTI manage to hold above $58.00 during Thursday’s session, the option would be there to flip the setup, allowing for longs with a stop beneath for protection. $60.00 screens as an appropriate initial target, even with the messy price action around it recently.
Plenty of fundamental catalysts were bandied around to explain Wednesday’s abrupt drop, most linked to an EIA report warning of market oversupply. It undoubtedly contributed to the bearish move, but the seeds were sown well before the event given how poorly WTI traded at the 50DMA in recent weeks.
Good luck!
DS
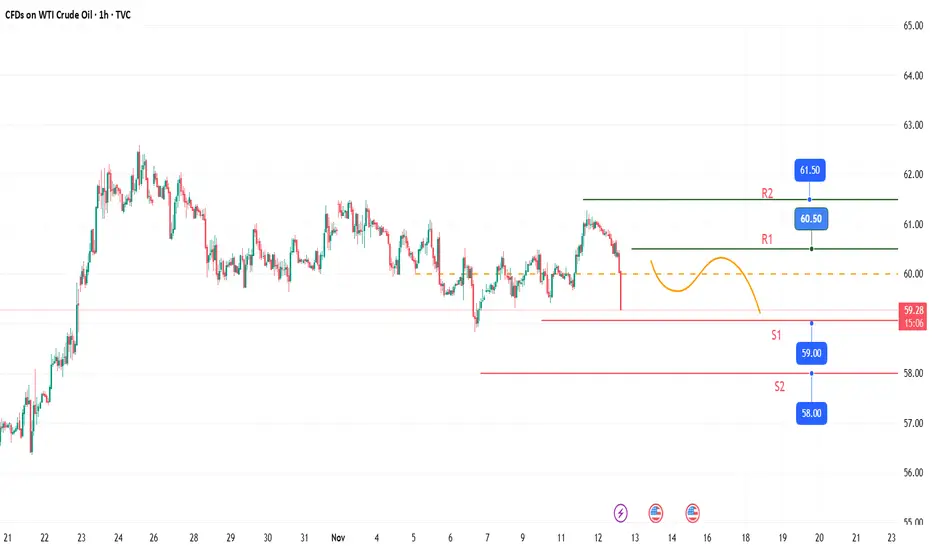
USOIL: Fluctuating declineCrude oil showed a trend of fluctuating decline today, breaking through key support levels, with a clear bearish dominance.
Key support below: In the short term, attention should be paid to the $59.00 integer mark. If this level is breached, oil prices may further drop to $58.00.
Resistance levels for rebound: If there is a technical rebound in oil prices, the first resistance level is at $60.50, and the second resistance level is at $61.50, with limited rebound space.
Trading Strategy:
Buy 59 - 59.5
SL 58.5
TP 60 - 60.5 - 61
Sell 60.5 - 61
SL 61.5
TP 59.1 - 58.5
A buying opportunity for oil — although it’s risky. Oil analysisAfter a strong rejection at the $61 resistance, oil is now approaching the $56–$57 support zone.
This is a time when it’s worth placing a stop in exchange for the potential of a good profit.
The yellow circle area marks the range where it’s worth entering a position.
Of course, the stop for any buy entry should be set below $55.700.

WTI Crude Oil – Update
I’ve entered a short position around this zone.
I don’t predict the market — I just follow opportunities.
It doesn’t matter what happens after entry; I simply follow my plan.
Those who’ve been following me know my system:
At a 1:1 reward, I close half of my position — that means zero risk.
If the market reverses and hits my stop, I lose nothing.
If it keeps moving, I use a trailing stop to catch as much of the move as possible.
That’s what real position management looks like.
And if my level breaks, I don’t just sit and watch — I’ll go long with the market.
I don’t predict or guess the future;
I trade with discipline, patience, and respect for the market.
I’m a trader, not a fortune teller.
USOIL | Breakout or Bull Trap? The Broader Case for Oil StrengthCrude oil appears to have broken above its short-term flag pattern — but is this the start of a continuation move, or just a false breakout? Several intermarket charts suggest the broader structure may still favour strength rather than exhaustion.
Technical Lens:
On the main USOIL chart, price has breached the upper bound of its descending flag after a steady base-building phase. The next few sessions will confirm whether this is a retest of the breakout or a failed move back inside the flag.
Chart-by-Chart Context:
1. Energy Sector ETF vs USOIL
The energy equity space has been outperforming crude itself. When energy stocks lead the underlying commodity, it often implies optimism about future earnings and renewed capital expenditure — a supportive sign for oil continuity.
2. Oil Volatility Index (OVX)
OVX has been steadily falling even as crude prices rise. This dynamic — higher prices with lower implied volatility — signals a healthy, stable uptrend driven by real demand rather than fear or short covering.
3. USOIL vs OVX Spread
The spread between crude and OVX continues to climb, indicating increasing price stability in the up-move. A rising spread historically accompanies sustained bullish phases.
4. USOIL vs Brent Oil
The spread between WTI and Brent remains in a descending structure, but with a potential breakout pending. If this breaks higher, it would suggest strengthening internal US demand — often a catalyst for follow-through in global crude benchmarks.
Scenarios:
Scenario A: If USOIL holds above the breakout zone → confirmation of a valid retest and potential continuation toward the upper resistance band.
Scenario B: If it slips back below the flag → false breakout risk, likely a short-term correction before broader trend direction resumes.
Takeaway:
Oil’s technical picture looks cautious but constructive. With energy equities leading, volatility compressing, and spreads hinting at underlying demand, the broader setup tilts toward stability — provided USOIL can sustain above its breakout zone.

WTI OIL Successive 1D MA50 rejections. Sell Signal.WTI Oil (USOIL) has been trading within a 3-month Channel Down with the price experiencing successive rejection on the 1D MA50 (blue trend-line) since the October 24 Lower High.
Given that the 0.5 Fibonacci retracement level was also filled (as on the previous Lower High), we expect this inability to break above, to kickstart the new Bearish Leg.
As previously, the Target is the Support at $56.00.
---
** Please LIKE 👍, FOLLOW ✅, SHARE 🙌 and COMMENT ✍ if you enjoy this idea! Also share your ideas and charts in the comments section below! This is best way to keep it relevant, support us, keep the content here free and allow the idea to reach as many people as possible. **
---
💸💸💸💸💸💸
👇 👇 👇 👇 👇 👇

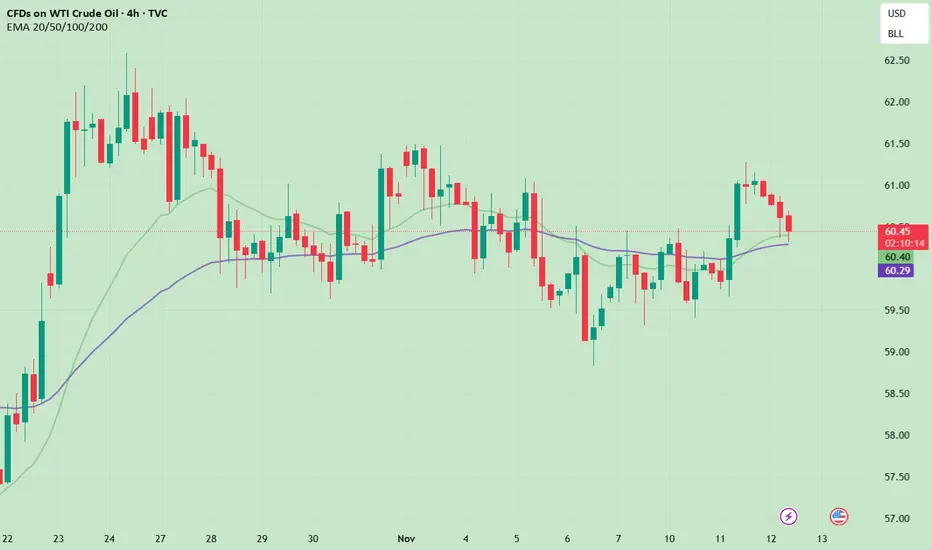
Crude Oil Bullish at 60, US Session Strategy Update
After two days of gains, crude oil has regained the 60 mark, finally establishing a clear upward trend. Maintaining our previous view, crude oil is likely to continue its upward trend with fluctuations. We need to observe the strength and effectiveness of the rebound this week. Based on the current fluctuations, crude oil should continue to rise this week. In the short term, focus on the 60-60.3 buying level and patiently wait for the bullish upward space. Resistance remains around 62-62.5.5.
This advice is time-sensitive. I update my trading ideas and strategies daily. If you don't yet have a crude oil trading plan or idea and are seeking consistent and stable returns, please stay tuned.
Oil - Expecting Bullish Continuation In The Short TermH1 - Downtrend line breakout.
Higher highs.
No opposite signs.
Until the two strong support zones hold I expect the price to move higher further.
If you enjoy this idea, don’t forget to LIKE 👍, FOLLOW ✅, SHARE 🙌, and COMMENT ✍! Drop your thoughts and charts below to keep the discussion going. Your support helps keep this content free and reach more people! 🚀
--------------------------------------------------------------------------------------------------------------------

USOIL Will Grow! Long!
Please, check our technical outlook for USOIL.
Time Frame: 1D
Current Trend: Bullish
Sentiment: Oversold (based on 7-period RSI)
Forecast: Bullish
The market is approaching a significant support area 60.422.
The underlined horizontal cluster clearly indicates a highly probable bullish movement with target 65.013 level.
P.S
We determine oversold/overbought condition with RSI indicator.
When it drops below 30 - the market is considered to be oversold.
When it bounces above 70 - the market is considered to be overbought.
Like and subscribe and comment my ideas if you enjoy them!

US CRUDE OIL (WTI): Classic Trend-Following Setup I spotted a very classic bullish model on 📈USOIL.
Following a strong bullish wave, the market started to correct within a bullish flag pattern.
The resistance breakout of this pattern consistently provides a reliable confirmation to consider a buy.
I anticipate a rise to 62.50 at this time.
