JKH.N RISING WEDGE The stock has been trading within a Rising Wedge pattern since late 2019/early 2020. This pattern is generally considered a bearish reversal pattern, suggesting that a decisive break below the lower trendline could lead to a significant downtrend.
The price has recently been testing the lower trendline of the Rising Wedge. The current weekly candle, as circled, is right at this critical support line, indicating an immediate inflection point. The stock closed the week at LKR 21.1, down 1.40%.
Key Levels and Support
The primary support in the near term is the lower trendline of the wedge.
Breakdown Scenario: A definitive weekly close below the lower trendline would confirm the breakdown of the Rising Wedge pattern. The next significant support would be the horizontal "Key Level" zone around LKR 17.0 - LKR 17.8. A break below this key zone would then target the subsequent long-term "Support" zone around LKR 13.0 - LKR 13.5.
Reversal/Continuation Scenario: If the lower trendline holds, the price could bounce back towards the upper trendline of the wedge, which is currently near the LKR 25.0 - LKR 26.0 area.
Projection
The technical structure strongly suggests a bearish projection given the nature of the Rising Wedge pattern and the price's current position right at the critical support.
The most likely projection is a breakdown below the lower trendline, leading to a move towards the LKR 17.0 - LKR 17.8 Key Level support zone. This breakdown would signal the end of the multi-year bullish consolidation represented by the wedge. Traders should look for confirmation via a decisive close below the trendline on the weekly timeframe. If the price manages to hold this line, the alternative projection would be a rally back toward the wedge's high LKR 25.0s, but the immediate technical bias favors the downside.
Trade ideas

JOHN KEELLS HOLDINGS PLC : JKH.N0000 : CSEOverview
John Keells Holdings (JKH) is the largest publicly listed company on the Colombo Stock Exchange (CSE), known for its strong fundamentals, high liquidity, and blue-chip status.
Strategy
This trade is based on a technical breakout pattern, supported by the recent upgrade of Sri Lanka’s foreign currency (FC) credit rating from default to CCC+ with a stable outlook.
The ratings upgrade is a significant catalyst for the CSE, as it reopens the market to large foreign institutional funds previously restricted by sovereign risk thresholds. These funds typically favor liquid counters with high capitalization, making JKH a prime beneficiary.
Technical Analysis (Chart Patterns)
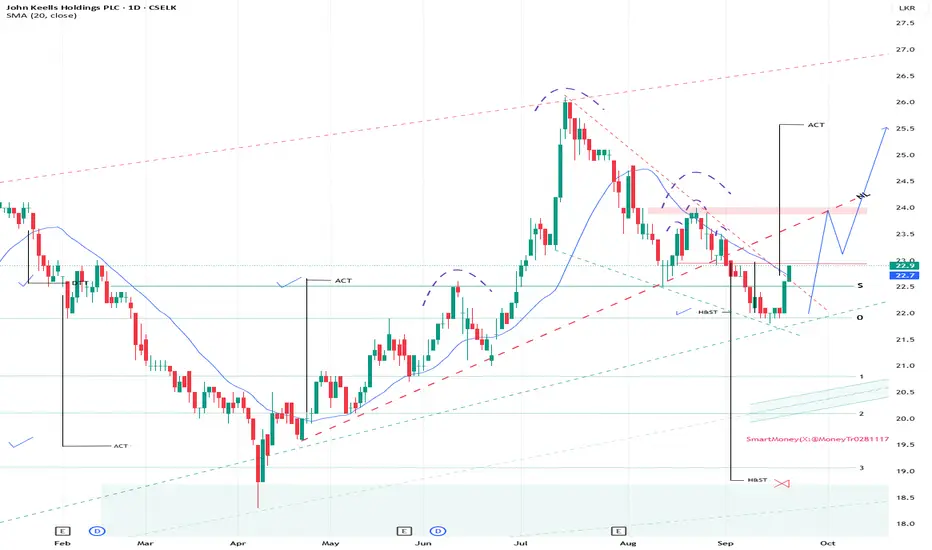
On 19th September 2025, JKH initiated a breakout from a descending wedge pattern.
• The upward momentum is expected to continue in the near term, bolstered by the positive sentiment from the ratings upgrade.
• The LKR 24.00 zone represents a key supply area and a potential resistance zone.
Potential Pattern Targets
Initial Pattern Target : LKR 25.60 (> 14% upside)
Extended Breakout (above LKR 24.00) : LKR 27.00 (> 17% upside)
Invalidation
A daily close below the support line marked as ‘0’ would invalidate this bullish setup.
JKH.NDisclaimer;
The information provided on this website does not constitute investment advice, financial advice, trading advice, or any other advice, and you should not treat any of the website’s content as such. We do not recommend buying, selling, or holding any stock. Nothing on this website should be taken as an offer to buy, sell or hold a stock. Conduct your due diligence and consult your financial advisor before making investment decisions.
I do not accept any responsibility and will not be liable for the investment decisions you make based on the information provided on the website.

JKH.N0000 - Key fib levels in monthly chartJKH is consolidating in golden pocket now. It should close above golden pocket to keep bullish momentum.In next few months, Next support will be around 0.5 fib level and resistance will be 0.718
Disclaimer: The information and analysis provided in this publication are for educational purposes only and should not be construed as financial advice or recommendations to buy, sell, or hold any securities. The author and TradingView are not responsible for any investment decisions made based on the content presented herein. Always consult a financial professional before making any investment decisions.

🇱🇰 JKH LONG PROJECTIONJKH has validated a bullish breakout on the neckline, indicating the potential for an upcoming rally. Following a minor pullback, the price is currently undergoing a retest of the previously breached resistance, further supporting the notion of a bullish continuation.

JOHN KEELLS HOLDINGS PLC (JKH.N0000) at Strong Support ZoneEntry Point: 132 to 136
Profit Target: 175 ( Short Term ), 215 ( Mid Term ), 400+ ( Long Term )
Stop-Loss: 127
Disclaimer: The information and analysis provided in this publication are for educational purposes only and should not be construed as financial advice or recommendations to buy, sell, or hold any securities. The author and TradingView are not responsible for any investment decisions made based on the content presented herein. Always consult a financial professional before making any investment decisions.

JKHformed a double top with weak divergence and got back withing the symmetrical tirangle where it was.
probably a fake out? 135 range looks interesting for investors to get back in!

JKH | Horrifyingly BearishThe stock broke below the long-term support range on February 20th and subsequently retested the previous support level on Feb 24th. However, it encountered heavy resistance and continued to show a bearish trend, forming a head and shoulders pattern. If the stock fails to hold at 135 levels, it may seek support at the 200-day moving average or even at the Fibonacci retracement level of 1.618 around the 128 range

JKH - 15.02.2023JKH - 15.02.2023
Price is testing the S zone between 136.75 and 140.00
MACD line has crossed below the signal line.
Which is bearish. But above the zero line.
RSI has crossed below the 50 point middle line.
