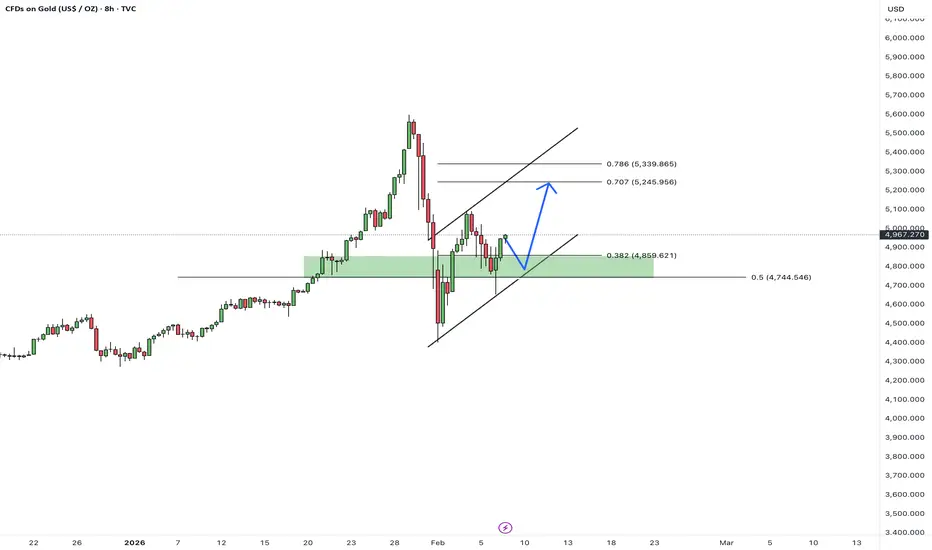
Gold Isn’t Rushing Lower – What Is the Money Flow Telling Us?If we view the gold market as a flowing stream, XAUUSD is moving upward in a controlled and orderly manner —not aggressively, but with clear conviction. After the prior sharp shakeout, gold did not collapse ; instead, it quickly regained balance , signaling that underlying buying pressure remain
Gold Spot / U.S. Dollar
No trades
About Gold Spot / U.S. Dollar
Gold price is widely followed in financial markets around the world. Gold was the basis of economic capitalism for hundreds of years until the repeal of the Gold standard, which led to the expansion of a flat currency system in which paper money doesn't have an implied backing with any physical form of monetization. AU is the code for Gold on the Periodic table of elements, and the price above is Gold quoted in US Dollars, which is the common yardstick for measuring the value of Gold across the world.

XAU/USD ~ Gold Building Momentum from Key Support📝 Description 🔍 Setup OANDA:XAUUSD
✅Gold has been respecting a descending trendline with multiple rejections, showing clear bearish structure. Now price is attempting a breakout + retest while holding above a strong demand zone.
✅Buyers stepped in aggressively from support, forming higher lows

XAUUSD: Liquidity Grab Below Support, Expansion Ahead To $5,110Hello everyone, here is my breakdown of the current XAUUSD setup.
Market Analysis
Gold has been trading within a well-defined bullish environment, previously respecting a clean ascending channel, where price consistently formed higher highs and higher lows. This structure reflected strong buyer d

Gold Price Analysis – Key Support and Resistance LevelsThis chart outlines the key support and resistance levels for gold prices. The Key Resistance Level at 5,431.175 is a potential rejection zone, where price may face resistance. The Support Zone at 5,040.060 is being tested, and if price holds, a bounce or reversal is expected. The Critical Support a

XAUUSDHello Traders! 👋
What are your thoughts on GOLD?
After a strong bearish rejection from the previous high, Gold entered a deep corrective phase and declined into the highlighted demand zone, where strong bullish reaction and buyer participation were observed.
Subsequently, price formed a higher low,

Elise | XAUUSD · 30M – Demand Hold → Bullish ContinuationOANDA:XAUUSD
Gold swept sell-side liquidity earlier, reacted strongly from the lower demand zone, and transitioned into a controlled bullish structure. Price is now consolidating above a well-defined support base, suggesting absorption rather than distribution. As long as price holds above the dem

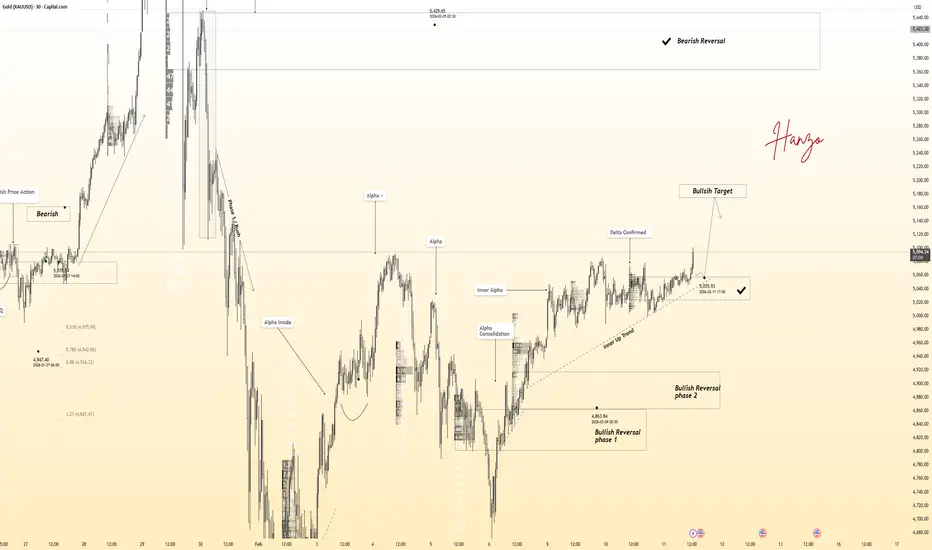
Gold 30-Min Engaged ( Bullish Reversal Entry Detected )⚡Base : Hanzo Trading Alpha Algorithm
The algorithm calculates volatility displacement vs liquidity recovery, identifying where probability meets imbalance.
It trades only where precision, volume, and manipulation intersect —only logic.
Technical Reasons
/ Direction — LONG / Reversal 5057 Area
☄️B
XAUUSDHello Traders! 👋
What are your thoughts on GOLD?
After a strong and sharp bullish rally, Gold faced a severe bearish correction, dropping significantly from recent highs. However, the market has shown a positive reaction, recovering a portion of the losses. Currently, price is moving within a risi
XAUUSD Short: Supply Holding, $4,750 Demand as TargetHello traders! Here’s a clear technical breakdown of XAUUSD (4H) based on the current chart structure. Gold previously traded within a well-defined ascending channel, where price respected both the rising support and resistance lines, forming a series of higher highs and higher lows. This structure

XAUUSD Builds Strength Above Demand - Next Target $5,190Hello traders! Here’s my technical outlook on XAUUSD (3H) based on the current chart structure. Gold is trading within a broader bullish market structure, supported by a well-defined rising trend line that has guided price higher over time. Earlier in the move, price entered a consolidation phase, f

See all ideas
Summarizing what the indicators are suggesting.
Oscillators
Neutral
SellBuy
Strong sellStrong buy
Strong sellSellNeutralBuyStrong buy
Oscillators
Neutral
SellBuy
Strong sellStrong buy
Strong sellSellNeutralBuyStrong buy
Summary
Neutral
SellBuy
Strong sellStrong buy
Strong sellSellNeutralBuyStrong buy
Summary
Neutral
SellBuy
Strong sellStrong buy
Strong sellSellNeutralBuyStrong buy
Summary
Neutral
SellBuy
Strong sellStrong buy
Strong sellSellNeutralBuyStrong buy
Moving Averages
Neutral
SellBuy
Strong sellStrong buy
Strong sellSellNeutralBuyStrong buy
Moving Averages
Neutral
SellBuy
Strong sellStrong buy
Strong sellSellNeutralBuyStrong buy
Displays a symbol's price movements over previous years to identify recurring trends.