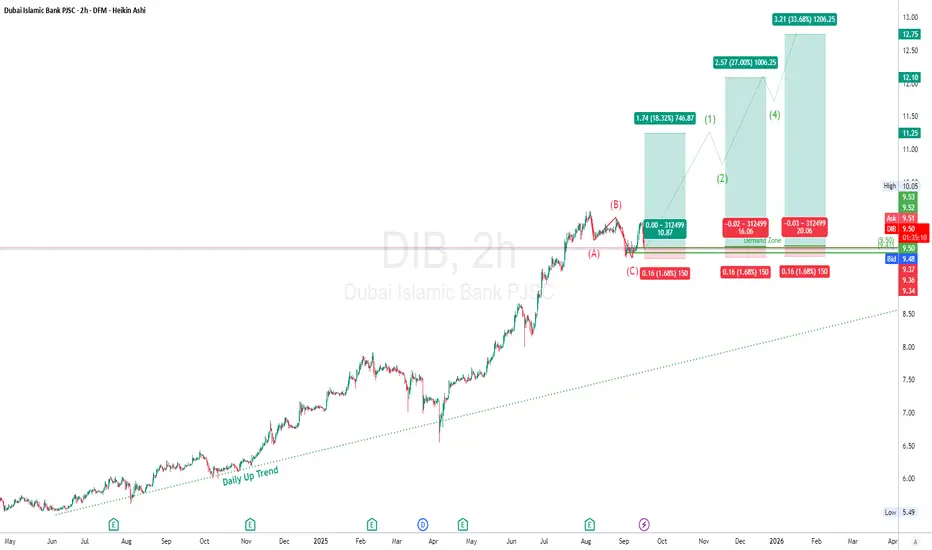
Dubai Islamic Bank (DIB), 2h chart_ Buy Setup
DIB has been in a solid daily uptrend since mid-2024, respecting the rising trendline.
Recently, price completed an ABC corrective structure, pulling back from 12.10 highs → 9.50s.
It is now sitting at the demand zone (9.35–9.50), with signs of buyers stepping back in.
Trend & Structure
Macro T
Dubai Islamic Bank PJSC
No trades
Next report date
—
Report period
—
EPS estimate
—
Revenue estimate
—
0.98 AED
7.06 B AED
23.27 B AED
5.14 B
About Dubai Islamic Bank PJSC
Sector
Industry
CEO
Adnan Abdul Shakoor Chilwan
Website
Headquarters
Dubai
Founded
1975
IPO date
Sep 18, 2004
Identifiers
2
ISIN AED000201015
Dubai Islamic Bank PJSC engages in the provision of banking and financial services. It operates through the following segments: Consumer Banking, Corporate Banking, Real Estate Development, Treasury, and Other.The Consumer Banking segment handles small and medium businesses and individual customers' deposits and provides consumer and commercial Murabahas, Salam, Ijarah, credit cards and funds transfer facilities as well as and trade finance facilities.The Corporate Banking segment handles financing and other credit facilities and deposit and current accounts for corporate and institutional customers.The Real Estate Development segment includes property development and other real estate investments by subsidiaries. The Treasury segment manages overall liquidity and market risk and provides treasury services to customers.The Other segment encompasses functions other than the other core lines of businesses including investment banking services.The company was founded on March 12, 1975 and is headquartered in Dubai, United Arab Emirates.
Related stocks
DFM : DIB - Trade Plan - Good Bounce at Fibonacci RetracementGood Day, Traders!
The Stock DIB at #DFM bounced twice from Golden Ratio of Fibonacci Retracement after providing dividend. This makes the golden ratio a respectable support. The stock is expected to rise from here with few corrections. We may have a profit taking opportunity. Good volumes further

Dubai Islamic Bank - 30% potential profitDubai Islamic Bank has a potential profit of 30%.
Overall, the real estate, banking, and investment sectors in the UAE are gaining Momentum.

DIB: Buy ideaOn DIB we have a very high probability of having an upward trend given the configuration of the chart. We can observe small candles with small bodies and long wicks. In addition to this we are also above the vwap indicator. Which reassures us in our purchasing position.
However, we must be vigilant.

Trying HardDIB has made a attempt to break 6.00 but it could not and now its trying for the second time. I would like to see it spending days near this zone so that we can see a build up of contraction of volatility and then let it explode it to the upside. Support area at 5.40 in case if it wants to come down

Good SetupThis stock is very stock fundamentally and now we are seeing good technicals on this chart. We are seeing good buying pressure at very important support and resistance zone. I think the rally will continue to the upside and it will hit the targets. This stock also give good dividends, good for long


Always GoodLike i keep saying in my videos DIB is always good for long term investment it is very strong fundamentally. This stock should be in your portfolio it always good gives good profits and dividends.
Hit like & follow guys ;)

Dubai Islamic Bank Sun Storm Investment Trading Desk & NexGen Wealth Management Service Present's: SSITD & NexGen Portfolio of the Week Series
Focus: Worldwide
By Sun Storm Investment Research & NexGen Wealth Management Service
A Profit & Solutions Strategy & Research
Trading | Investment | Stocks | ETF | Mutua

DIB is DOWNHey , so you don't have any opportunity to buy now. and I am available to advise you in any market .

See all ideas
Summarizing what the indicators are suggesting.
Neutral
SellBuy
Strong sellStrong buy
Strong sellSellNeutralBuyStrong buy
Neutral
SellBuy
Strong sellStrong buy
Strong sellSellNeutralBuyStrong buy
Neutral
SellBuy
Strong sellStrong buy
Strong sellSellNeutralBuyStrong buy
An aggregate view of professional's ratings.
Neutral
SellBuy
Strong sellStrong buy
Strong sellSellNeutralBuyStrong buy
Neutral
SellBuy
Strong sellStrong buy
Strong sellSellNeutralBuyStrong buy
Neutral
SellBuy
Strong sellStrong buy
Strong sellSellNeutralBuyStrong buy
Displays a symbol's price movements over previous years to identify recurring trends.
DVYE
iShares Emerging Markets Dividend Index Fund Exchange Traded FundWeight
1.11%
Market value
13.92 M
USD
Explore more ETFs
Frequently Asked Questions
The current price of DIB is 9.11 AED — it hasn't changed in the past 24 hours. Watch Dubai Islamic Bank PJSC stock price performance more closely on the chart.
Depending on the exchange, the stock ticker may vary. For instance, on DFM exchange Dubai Islamic Bank PJSC stocks are traded under the ticker DIB.
DIB stock has fallen by −7.42% compared to the previous week, the month change is a −3.35% fall, over the last year Dubai Islamic Bank PJSC has showed a 20.03% increase.
We've gathered analysts' opinions on Dubai Islamic Bank PJSC future price: according to them, DIB price has a max estimate of 11.00 AED and a min estimate of 7.70 AED. Watch DIB chart and read a more detailed Dubai Islamic Bank PJSC stock forecast: see what analysts think of Dubai Islamic Bank PJSC and suggest that you do with its stocks.
DIB stock is 1.65% volatile and has beta coefficient of 0.66. Track Dubai Islamic Bank PJSC stock price on the chart and check out the list of the most volatile stocks — is Dubai Islamic Bank PJSC there?
Today Dubai Islamic Bank PJSC has the market capitalization of 66.71 B, it has increased by 2.20% over the last week.
Yes, you can track Dubai Islamic Bank PJSC financials in yearly and quarterly reports right on TradingView.
Dubai Islamic Bank PJSC is going to release the next earnings report on Apr 29, 2026. Keep track of upcoming events with our Earnings Calendar.
DIB earnings for the last quarter are 0.26 AED per share, whereas the estimation was 0.24 AED resulting in a 7.24% surprise. The estimated earnings for the next quarter are 0.25 AED per share. See more details about Dubai Islamic Bank PJSC earnings.
Dubai Islamic Bank PJSC revenue for the last quarter amounts to 1.22 B AED, despite the estimated figure of 3.44 B AED. In the next quarter, revenue is expected to reach 3.37 B AED.
DIB net income for the last quarter is 1.85 B AED, while the quarter before that showed 1.86 B AED of net income which accounts for −0.51% change. Track more Dubai Islamic Bank PJSC financial stats to get the full picture.
Yes, DIB dividends are paid annually. The last dividend per share was 0.45 AED. As of today, Dividend Yield (TTM)% is 4.88%. Tracking Dubai Islamic Bank PJSC dividends might help you take more informed decisions.
Dubai Islamic Bank PJSC dividend yield was 3.78% in 2025, and payout ratio reached 35.81%. The year before the numbers were 6.35% and 43.30% correspondingly. See high-dividend stocks and find more opportunities for your portfolio.
Like other stocks, DIB shares are traded on stock exchanges, e.g. Nasdaq, Nyse, Euronext, and the easiest way to buy them is through an online stock broker. To do this, you need to open an account and follow a broker's procedures, then start trading. You can trade Dubai Islamic Bank PJSC stock right from TradingView charts — choose your broker and connect to your account.
Investing in stocks requires a comprehensive research: you should carefully study all the available data, e.g. company's financials, related news, and its technical analysis. So Dubai Islamic Bank PJSC technincal analysis shows the sell today, and its 1 week rating is sell. Since market conditions are prone to changes, it's worth looking a bit further into the future — according to the 1 month rating Dubai Islamic Bank PJSC stock shows the buy signal. See more of Dubai Islamic Bank PJSC technicals for a more comprehensive analysis.
If you're still not sure, try looking for inspiration in our curated watchlists.
If you're still not sure, try looking for inspiration in our curated watchlists.