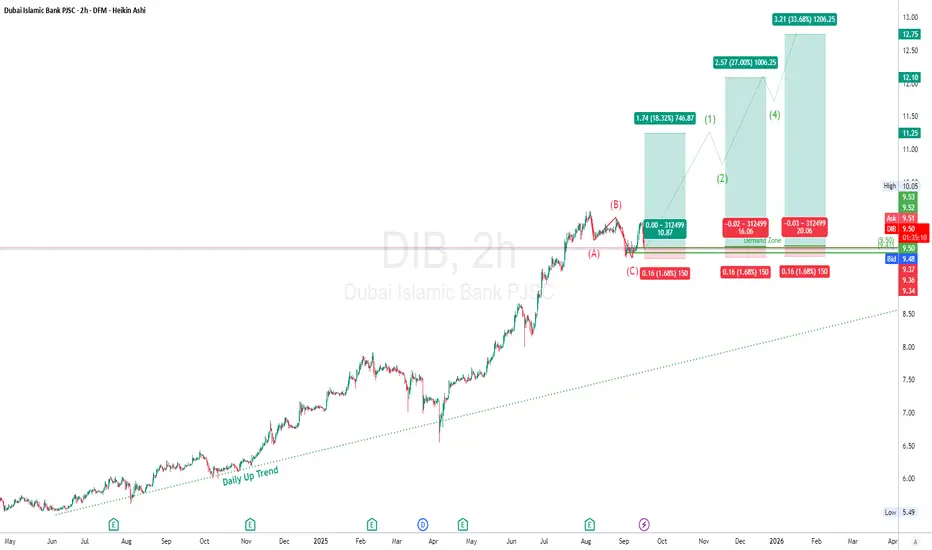
Dubai Islamic Bank (DIB), 2h chart_ Buy Setup
DIB has been in a solid daily uptrend since mid-2024, respecting the rising trendline.
Recently, price completed an ABC corrective structure, pulling back from 12.10 highs → 9.50s.
It is now sitting at the demand zone (9.35–9.50), with signs of buyers stepping back in.
Trend & Structure
Macro Trend: Bullish (higher highs/lows intact).
Current Phase: End of Wave (C) correction.
Next Cycle Projection: Elliott Wave 1–5 up, with 12.75+ targets in sight.
Supply & Demand
Demand Zone (Strong Support): 9.35 – 9.50 (already tested).
Next Resistance Levels (Supply):
11.25
12.10 (previous high)
12.75 (projected Wave 5 target)
Elliott Wave Outlook
Completed: (A)-(B)-(C) correction.
Next: Bullish cycle projected → Wave (1) → (2) → (3) → (4) → (5) toward 12.75.
Measured projections:
Wave (1): 10.87 (+18%)
Wave (3): 12.10 (+27%)
Wave (5): 12.75 (+33%)
💰 Trade Idea
Entry Zone: 9.50 – 9.55 (demand zone bounce).
Stop Loss: 9.35 (below demand).
Take Profit Levels:
TP1: 10.87 (Wave 1)
TP2: 12.10 (Wave 3)
TP3: 12.75 (Wave 5)
🎯 Risk/Reward :
To TP1 = ~1:7
To TP2 = ~1:12
To TP3 = ~1:18+
⚖ Risk Management
Max risk per trade = 1–2% of portfolio.
Move SL to Break-Even (BE) once TP1 is hit.
Scale out 30% at TP1, 30% at TP2, hold rest for TP3.
"In trading, the key is not being right, but having an edge and sticking to it." – Paul Tudor Jones
⚠️ Disclaimer
This is not financial advice. For educational purposes only. Always DYOR before trading.
Trade ideas
DFM : DIB - Trade Plan - Good Bounce at Fibonacci RetracementGood Day, Traders!
The Stock DIB at #DFM bounced twice from Golden Ratio of Fibonacci Retracement after providing dividend. This makes the golden ratio a respectable support. The stock is expected to rise from here with few corrections. We may have a profit taking opportunity. Good volumes further enforces this idea. The trade maybe taken now if not taken earlier. Below is a trade plan:
Trade Plan:
Buy: 7.00
Stop Loss: 6.42
Take Profits: 7.68 & 7.92
Happy Trading!

Dubai Islamic Bank - 30% potential profitDubai Islamic Bank has a potential profit of 30%.
Overall, the real estate, banking, and investment sectors in the UAE are gaining Momentum.

DIB: Buy ideaOn DIB we have a very high probability of having an upward trend given the configuration of the chart. We can observe small candles with small bodies and long wicks. In addition to this we are also above the vwap indicator. Which reassures us in our purchasing position.
However, we must be vigilant. If the vwap indicator is broken forcefully by a large red candle and accompanied by a large red volume, this means that we would have a high probability of having a reversal in the trend.Thanks!

Trying HardDIB has made a attempt to break 6.00 but it could not and now its trying for the second time. I would like to see it spending days near this zone so that we can see a build up of contraction of volatility and then let it explode it to the upside. Support area at 5.40 in case if it wants to come down for a retest.
Hit like & follow guys ;)

Good SetupThis stock is very stock fundamentally and now we are seeing good technicals on this chart. We are seeing good buying pressure at very important support and resistance zone. I think the rally will continue to the upside and it will hit the targets. This stock also give good dividends, good for long term holding.
Hit like & follow guys ;)


Always GoodLike i keep saying in my videos DIB is always good for long term investment it is very strong fundamentally. This stock should be in your portfolio it always good gives good profits and dividends.
Hit like & follow guys ;)

Dubai Islamic Bank Sun Storm Investment Trading Desk & NexGen Wealth Management Service Present's: SSITD & NexGen Portfolio of the Week Series
Focus: Worldwide
By Sun Storm Investment Research & NexGen Wealth Management Service
A Profit & Solutions Strategy & Research
Trading | Investment | Stocks | ETF | Mutual Funds | Crypto | Bonds | Options | Dividend | Futures |
USA | Canada | UK | Germany | France | Italy | Rest of Europe | Mexico | India
Disclaimer: Sun Storm Investment and NexGen are not registered financial advisors, so please do your own research before trading & investing anything. This is information is for only research purposes not for actual trading & investing decision.
#debadipb #profitsolutions

DIB is DOWNHey , so you don't have any opportunity to buy now. and I am available to advise you in any market .

BullishIt have visiting the support area for the first time and we are seeing buying momentum. I think slowly it will move up and push the market index along with it.
Hit like & follow guys ;)

More HigherWith interest rates going higher banking sector will benefit a lot which will bring in more revenues. Invest in banking sector now for long term gains. Over all very bullish!!
Hit like & follow guys ;)

Moreits in a strong uptrend after the dividends it have corrected itself and again going for a new bull run. I think soon it will cross the previous high and touch 7.00 over all this stock is very bullish and highly recommended to be in your portfolio.
hit like & follow guys ;)

Dubai Islamic Band #DIB UAE StockDear Follower
This Share is in good area And We Hope today is Start for Jump to 1st & 2nd Target as Depicted .

Wait for a CatchA very good stock for long term with very strong fundamentals also with interest rates going up banks will benefit a lot. After the dividends its gapped down and it didnt fill up the gap yet slowly i think it will fill up the gap. As of now important support zones are 5.80 and 5.60 respectively. If it comes at 5.60 I think it will be a very good buy.
Hit like & follow guys ;)

DIB - simple analysisThe simple things is good to avoid some confusing
if u need exclusive analysis or u have any question
feel free to drop us message
thank you

Very BullishIts been flying high non stop, next resistance is at 6.20. After the breakout of bullish pattern it have already hit the target and now trying to go more higher. A solid green candle indicating buyers are in full control! very very bullish, join the wagon.
Hit like & follow guys ;)

Always GoodIts always good to have DIB in our portfolios, its in a healthy uptrend and also reported positive financial results. It would be a bit late to enter as of now as stop loss is way too far. However it can now be good for a positional trade. Looking Bullish!!
Hit like & follow guys ;)

Still Looks GoodVery good stock with strong fundamentals, technically its not looking good for a entry. If you want to catch this with a momentum then wait for a breakout. For now its in a NO trading zone. You cannot buy all the stocks at any time wait for a good setup to trade and buy.
Hit like & follow guys ;)

Stalk ThisNo doubt this is very strong stock, once it cross 5.43 thats a strong resistance i think this will again go back to the swing high. Over all this is a bullish stock.
Hit like & follow guys ;)

Good MoveA very strong stock, still there is a small gap to touch the resistance it can be a good intra day trade. Over all its very bullish!!
Hit like & follow guys ;)

Reversal Or Deep CorrectionBanking sector was performing good but currently under pressure. Well there are scenarios as DIB is right at the strong support level if 4.90 hold we can expect a rebound for that to happen it should first break the trendline to give us some confirmation. If the support is broken that is around 4.90 we can see some sharp selling till 4.75 levels. As of now its in a no trading zone better stay away from it till we can some bullish confirmatin.
Hit like & follow to show your support ;)

Dubai Islamic Bank DIBThe stock has been moving in a clear direction since last year, which is the ascending channel, the points are clear in the chart. The support area at 4.70 is a very stubborn area as it represents the lower trend line, and we should pay attention to it so that if a full candle closes below it, it means a severe drop, but except Therefore, the stock is likely to rise to the drawn point 5.20.
have a good day
