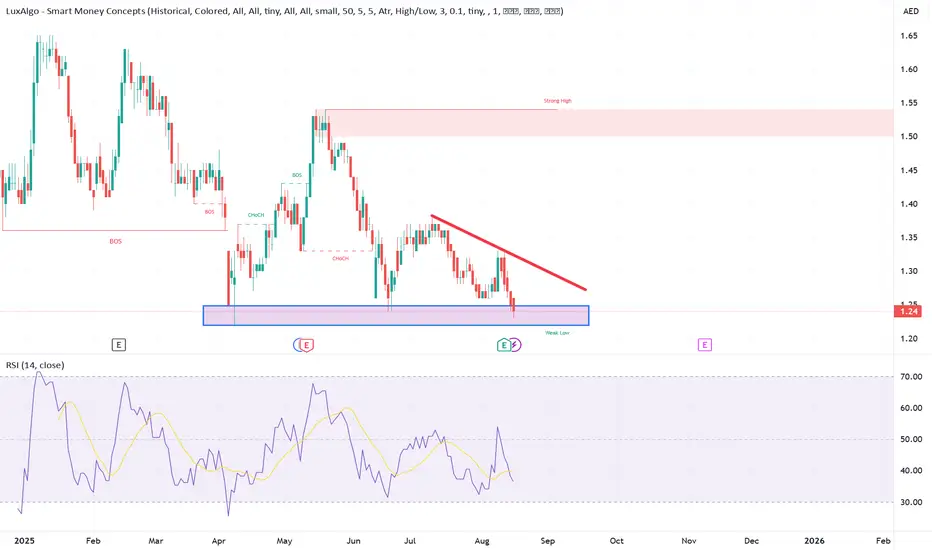
TALABAT waiting to react to support zone#TALABAT
if your are thinking to buy TALABAT at this strong support area it is a good idea.
personally i track the market depth for a purchase at 1.22~1.123 with a very short stoploss at 1.20.
RSI is almost near 30 and oversold.
downtrend is still visible. and if price react to this support zone maybe goes to 1.30 again.
Trade ideas
#talabat #DFM #dubai_financial_Markettalabat is hitting to a good support @ 1.20~1.25 and now uptrend again
current price is 1.33 and can reach to 1.50 very easily
if you buy put the SL at 1.20 AED

Technical Analysis of Talabat Holding PL (TALABAT) StockPrice Levels
Current Price: 1.41 AED
High: 1.61 AED - Low: 1.40 AED
Ask Price: 1.42 AED - Bid Price: 1.41 AED
Trend Analysis
The stock has been in a downward trend since early March, with consistent lower highs and lower lows.
A sharp drop occurred recently, pushing the price below key moving averages.
Price is trading below the Ichimoku Cloud, indicating a strong bearish momentum.
Technical Indicators
✅ Relative Strength Index (RSI)
RSI is below 30, signaling that the stock is oversold.
A potential short-term rebound could happen if buyers step in.
✅ Moving Averages
The stock is below all major moving averages, which confirms the bearish trend.
Unless it crosses above resistance levels (1.46-1.50 AED), the trend is likely to continue downward.
✅ Volume Analysis
There is a slight increase in selling volume, reinforcing the bearish pressure.
A shift in volume could indicate a trend reversal, so monitoring volume spikes is crucial.
Support and Resistance
Support Level: 1.40 AED (A break below could accelerate selling)
Resistance Levels:
1.46 AED (Short-term resistance)
1.50 AED (Stronger resistance level)
1.55-1.60 AED (Major resistance, needs strong buying pressure to break)
Recommended Approach
For short-term traders: Wait for a confirmation of a bounce before entering. If 1.40 AED holds, a small rebound to 1.46-1.50 AED is possible.
For long-term investors: Avoid buying until there’s a clear breakout above 1.50 AED with strong volume.
Stop Loss: If you are already holding, consider setting a stop-loss below 1.38 AED to manage risks.
⚠️ Risk Warning: If the price fails to hold 1.40 AED, further downside movement towards 1.35-1.30 AED may occur.

TALABAT - (DFM) Potential Reversal from Demand Zone📉 TALABAT Potential Reversal from Demand Zone 🚀
The stock has been in a downtrend since its IPO, establishing an uptrend around January 5th, followed by a corrective wave starting January 21st after the previous impulsive move.
Currently, the price is testing a key demand zone (1.42 - 1.39), which was formed earlier in January. Signs of a potential trend reversal are emerging, including a break of the downward trendline.
A strong supply zone at (1.59 - 1.62) could serve as a profit target for an upward move.
This could mark the completion of Wave 2 correction within a larger uptrend. A breakout above 1.46 may signal the start of Wave 3, leading to a powerful bullish move.
Setup:
Entry: 1.42 - 1.45 (demand zone confirmation)
Stop Loss: Below 1.39 (invalidates the demand zone)
Take Profit: 1.59 - 1.62 (supply zone)
Risk-Reward Ratio: ~1:3 (ideal for a high-probability setup)
"The market is a device for transferring money from the impatient to the patient." – Warren Buffett
🚨 Disclaimer: This is not financial advice. Always do your own research and manage your risk accordingly. 🚨
