$OPEN — 10W MA Pullback, Breakout SetupWeekly chart looks constructive — NASDAQ:OPEN has pulled back to the 10-week MA on lighter volume after a strong prior run. The weekly structure remains intact despite a ~36% pullback, and volume has been drying up, indicating normal consolidation.
A strong-volume breakout through the short-term downtrend could confirm a trend resumption and signal the next leg higher.
I’ll turn cautious if heavy selling volume appears and price breaks below $6.90 — that would invalidate the setup for now.
Trade ideas

LONG FOR OPENDOOR, CONSOLIDATING BETWEEN 8 AND 9OPENDOOR is consolidating between 8 and 9, if it breaks then I am long till the target meets.
TPs are 11, 12, 13, 14 and a potential to reach 15.
To breach 13 and reach 15 , Top Drivers are Fund rate happening on 26th Oct and Earnings happening on 6th Nov.
Please do Risk Management and this is not a financial advice.
I am a successful trader and you will become one only by managing your risks.

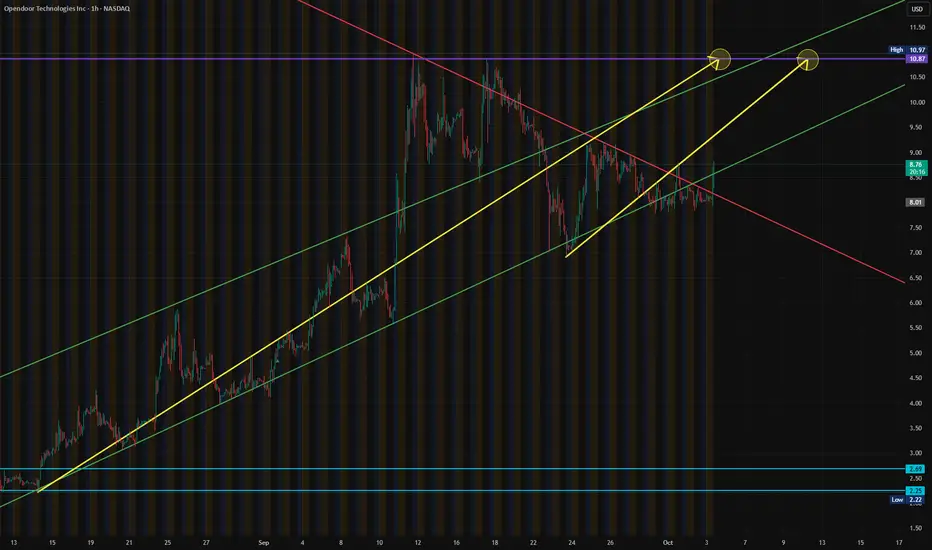
$OPEN - OpenDoor Tech - $9.69 Retest - $10.87 PT🧠 Technical Overview
Ticker: NASDAQ:OPEN (Opendoor Technologies Inc.)
Timeframes: 15-min & 4-hour combo
Current Price: ~$9.30
Trend Summary:
Strong bounce from $8.10 base with two clean BOS (break of structure) signals.
Retested and held $9.19 intraday; momentum candle formed near close.
Channel projection (yellow) shows potential path toward $10.87 → $10.97 short-term.
Volume uptick confirms accumulation — buyers stepping back in.
Key supports: $8.43 / $8.10
Analysis Overview:
NASDAQ:OPEN (Opendoor) is back in motion!
After reclaiming $9.00 support and breaking its short-term structure, the chart shows a clean path toward $10.87–$11.00.
Volume confirms renewed buyer strength after weeks of consolidation near $8.
Watch $9.69 for breakout confirmation — trend remains bullish above $8.43.
#Opendoor #OPEN #NASDAQ #MomentumTrading #RealEstateTech #AIStocks #MyMIWallet

open door this is what i see for open door, rsi is high i would short or buy 3-4 month options to put
What I'm looking for next weekToday we see a 5m double top with bearish retest.
If the pattern completes and breaks $7.85 support I think it's quite likely we break the recent $7 low as well.

$OPEN - Opendoor Tech - $9.20 RT / $9.80 PT NASDAQ:OPEN broke it's consolidation trend since reaching $10.97 in early Sept. We initially had a $7.95 PT which it exploded past and has since consolidated to retest the $9.20 Level of Resistance, pushing on to retest our $9.80 PT.
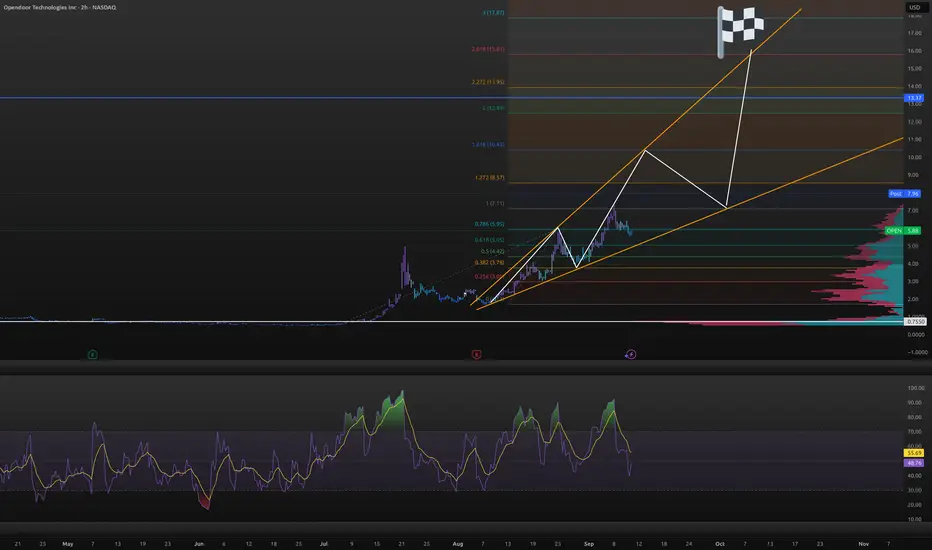
Open to $15, but watch the pullbackThis chart is pretty simple. Everything lines up really nice, including the fib extension, the expanding 12345 move, and timing. Happy to hear what you think.
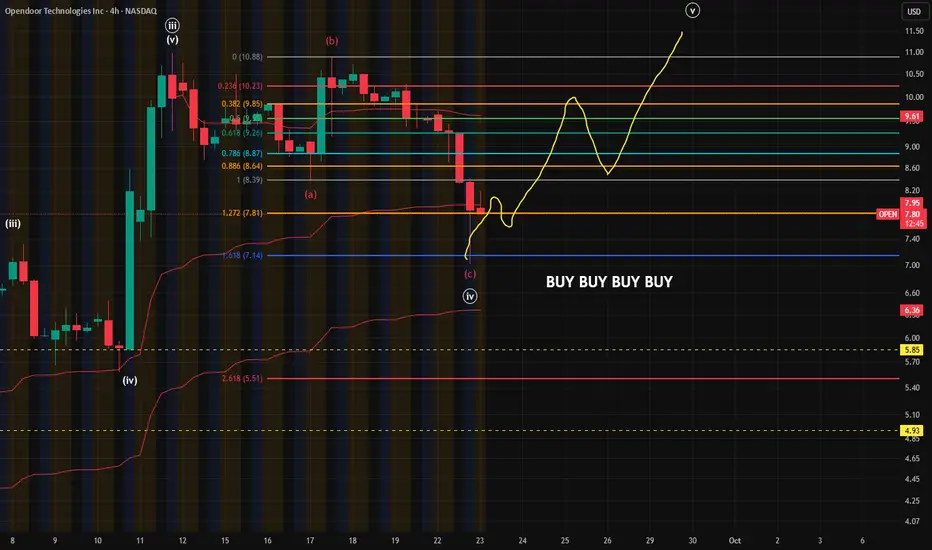
OPEN - Next Move Obvious I published an idea earlier on OPEN, and barely caught the local bottom on it, I was worried about price stalling at the $9 price point (it did in after market hours) so I stayed back til the picture became a bit clearer. Well gents, the picture just got a whole lot clearer.
2 Alternate short-term wavecounts, one (which I prefer more) is that this is a new impulse set, the other is that this is a corrective B wave to be followed by a new leg down.
Either way, both counts point to a short term upside, these are genuinely some of my favorite setups to play.
Wave-Count Confidence: High/Strong

OPEN order basically we have had
indication
correction
continuation
where I've placed my order is where buyers should be control above

$OPEN touched 10$. Next Stops are 15 $ and 25$. Shorts be aware.When I wrote my first blog on NASDAQ:OPEN predicting it will reach 9 $, I got pushback on pumping a ‘meme’ stock with shallow technical analysis based on Fib levels. I wrote on July 19th that by end of summer we will touch 9 $.
NASDAQ:OPEN : Ongoing short squeeze. What are the Fib levels telling? for NASDAQ:OPEN by RabishankarBiswal — TradingView
The 9 $ target has been long achieved. But it was surprising for me to see that since my article on July 19th the short interest in NASDAQ:OPEN has increased to 23% from below 20%. The days to cover has decreased from 1.8 to 0.6. All of these can create violent short squeezes and high volatility. With less than 1 day to cover the shorts, the shorts sellers might get slaughtered if they overstay their welcome.
So, what does all the technical and short interest data tell us. The shorts have not learned their lesson. Wall Street Bets is holding onto this stock to make it its next best meme stock. Now with NASDAQ:OPEN over 10 $ the large institutional investors can buy and include it in their portfolio, especially those with a momentum tilt.
Again, going back to the simple tool in technical analysis and checking on our Fib levels I think the next price levels are 15$ which was a major support in 2021. Once 15$ level is achieved then the next level to watch is 25 $ where it can experience some resistance which was a previous local high.
Verdict: Short sellers should cover shorts and run for the hills. NASDAQ:OPEN can reach 15 $ and subsequently 25 $ with Fed reducing rates and volatility spikes.

Opendoor Technologies Inc. (OPEN) Innovates Real Estate SalesOpendoor Technologies Inc. (OPEN) operates a digital real estate platform that simplifies buying and selling homes. By offering instant cash offers and streamlined transactions, the company removes many of the traditional frictions of real estate. Opendoor’s growth is fueled by consumer demand for faster, tech-driven housing solutions, expansion into new U.S. markets, and its ability to scale operations with data and AI-driven pricing models.
On the chart, a confirmation bar with rising volume highlights bullish strength. The price has entered the momentum zone after climbing above the .236 Fibonacci level. A trailing stop can be placed just below this Fibonacci mark using the Fibonacci snap tool, helping traders lock in profits while staying positioned for further upside potential.

Buying OPEN on the openOPEN has been on my watchlist, and I was waiting for a clearer picture. This wave-count I'll admit is not the best and in-fact may be a little forced, part of my immediacy to buy is I've been waiting for a pullback greater than 20% to buy into. Basically, what I'm saying is; solid chance I'm too early for this entry, but with the 1.618 extension touch in pre-market, I'm buying into this on the open.
Wave-Count Confidence: Average
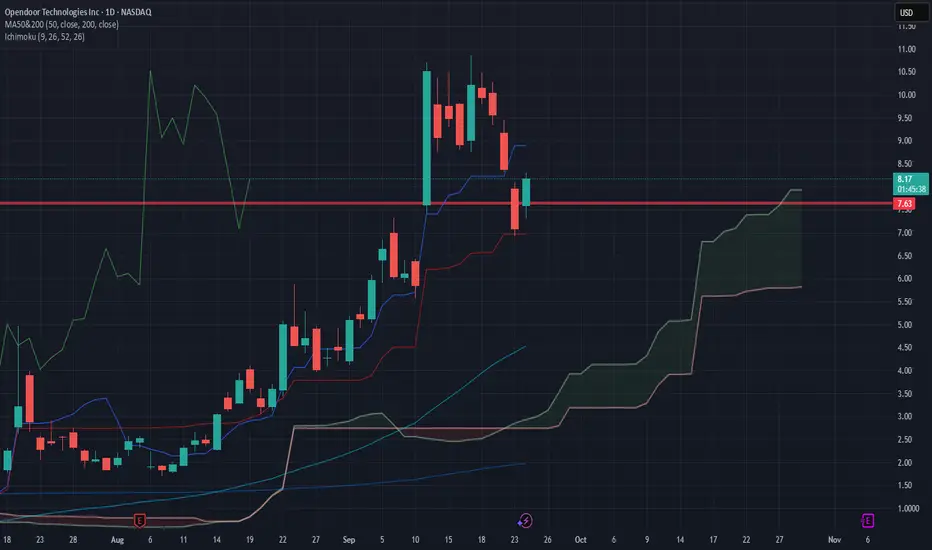
trade active! bought in at 7.63, target 10+quick trade.
this looks like a gap fill re-entry for a quick scalp.
pop out after this will go above 10, or you can hodl till $82 if youre part of the meme.
i like short scalps so ill be out after we pump
OPEN HIGH PROBABILITY SETUP SOON!!!🚨 OPEN HIGH PROBABILITY BUY SETUP 🚨
* Here We Can See Clearly The Next Potential Move For OPEN Coming Hours/Days.
* Keep Your Eyes Close On Your Trading Positions.
* Happy PIP Hunting Traders.
FXKILLA.

OPEN LONGOPEN just shattered a long downtrend, rallying from under $1 to nearly $10 on heavy volume and strong momentum. Sales are solid at $5.18B with EPS growing 70% QoQ, despite some leverage on the balance sheet.
The Fed’s recent rate cut looks like the start of an easing cycle, which should lower borrowing costs and fuel housing demand a major tailwind for OPEN. With technicals breaking key resistance and macro conditions improving, $22+ is a realistic target if the stock holds above $10.
This setup could drive significant upside over the coming months worth watching closely!

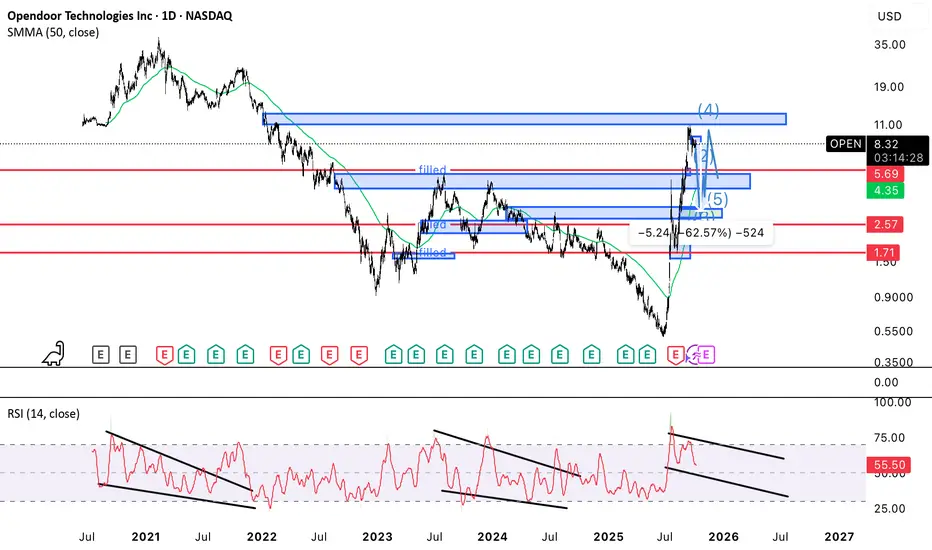
$OPEN: The Rhythm of the Market - The Exhalation After the InhalGreetings, fellow traders.
We navigate the markets not as a series of disconnected events, but as a continuous, flowing rhythm. There is the inhale—the expansion, the breakout, the euphoria. And there is the exhale—the contraction, the consolidation, the reversion. After a successful ride on the inhalation of NASDAQ:OPEN , it is wise to pause, observe, and listen to what the chart is telling us now. It seems the market's breath is beginning to turn.
The Technical Landscape
The recent ascent in NASDAQ:OPEN has been powerful, a testament to the bulls' conviction. However, no trend moves in a straight line forever. We are now seeing signs of potential exhaustion—clues that the bears are beginning to stir and fatten up for winter.
RSI Divergence: Notice on the daily chart how price has pushed to new highs, yet the Relative Strength Index (RSI) is failing to confirm, printing lower highs. This is a classic bearish divergence, suggesting that the momentum behind the rally is waning.
MACD Convergence: The MACD histogram is showing a clear convergence, indicating that the moving averages are coming closer together. This often precedes a potential shift in momentum or a crossover to the downside.
Parabolic Extension: A move from ~$4 to over $10 in such a short time frame is significant. Such rapid ascents often require a period of retracement to find equilibrium before the next directional move can be established.
This is not a prediction of a crash, but an observation of balance. The market inhaled deeply, and now a natural exhalation may be due.
The Philosophy
In moments like these, one must ask: What is my role in this story? The answer is never the same for everyone.
For the long-term investor, this may be nothing more than noise—an opportunity to accumulate according to their plan. For the hyper-active day trader, it's another set of patterns on a lower timeframe. For the swing trader, it may be a moment to take profit from the long side and assess the landscape for a new opportunity. There is no single right answer, only the one that aligns with your system, your timeframe, and your peace of mind. To blindly follow another is to be a salmon swimming against your own current. This analysis is simply one piece of the puzzle. It is up to you to see if and how it fits into your own masterpiece.
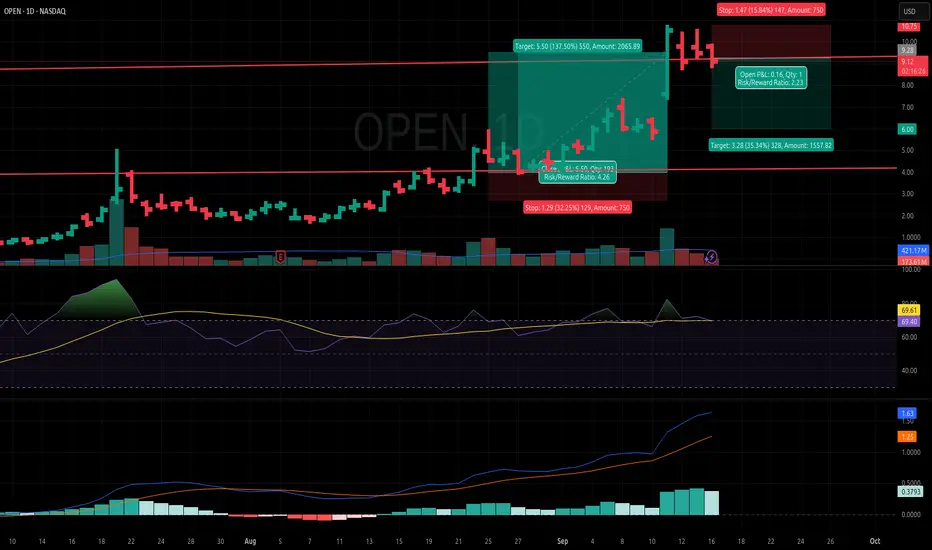
An Illustrative Setup
For those whose perspective aligns with a potential reversion to the mean, here is one possible way to frame the opportunity. This is a bearish setup, looking for the "exhale" phase to play out.
Ticker: NASDAQ:OPEN
Bias: Bearish / Mean Reversion
Entry (Short): $9.30
Stop Loss: $10.75 (Positioned above the recent swing high, invalidating the exhaustion thesis if breached).
Take Profit: $6.00 (A level of prior consolidation and potential support).
Risk/Reward Ratio: ~2.23
Trade with clarity, manage your risk with discipline, and remember that every chart is a lesson in market psychology.
Remember: Just shine!
Disclaimer: This is not financial advice. It is for educational and informational purposes only. Please conduct your own research and manage your risk accordingly.
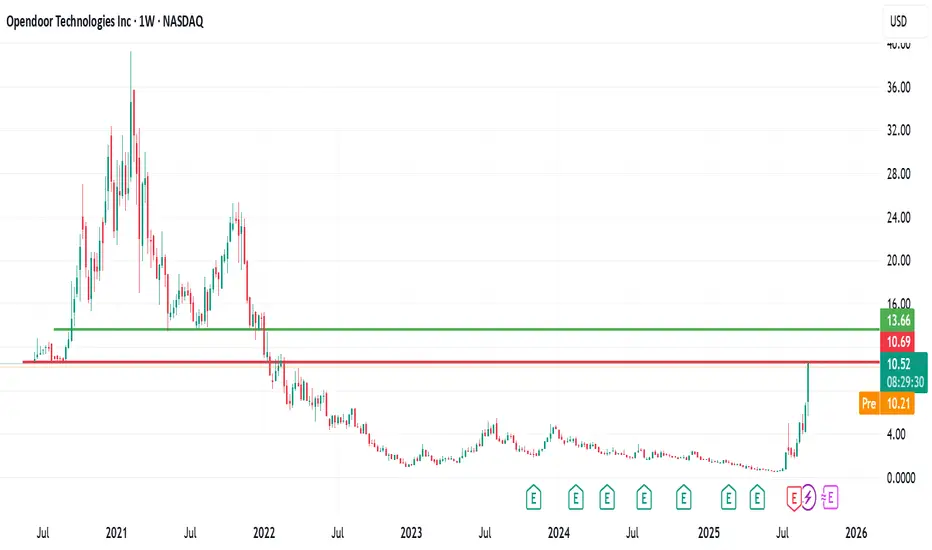
Opendoor is back to its historical (IPO) levelOpendoor is back to its historical (IPO) level
Opendoor Technologies (NASDAQ: OPEN) has made a remarkable journey back to its historical IPO price level.
The company went public in mid-June 2020, with its stock price surging to a peak of around $39 per share by early May 2021—representing a gain of more than 260%. However, the momentum reversed sharply, and despite several recovery attempts, the stock continued to decline, eventually hitting an all-time low (ATL) near $0.50, a loss of over 95% from its peak.
Since reaching that bottom, Opendoor has staged a powerful rebound, pushing back toward its IPO level from 2020.
Key questions for investors now are:
What fundamental catalysts could drive a decisive breakout above this level?
How much further upside potential exists from here?
Should investors also prepare for the possibility of another pullback?
Final thought: A confirmed breakout above the IPO level could open the door to further gains, with the next potential target around $13 per share.
📌 This analysis is for educational purposes only and not financial advice. Please trade and invest responsibly.
If you found this helpful, like, follow me, subscribe, share and comment.
$OPEN BIG GAMBLE IF YOU ASK ME Bottom Line: Most traders on X are pumped about NASDAQ:OPEN , expecting it to climb fast from $9.17, maybe hitting $10–$18 soon. But it’s risky—do your own research (DYOR) and be ready for ups and downs!

Opendoor Technologies (OPEN) – Gap Fill & Bounce Setup🔍 Technical Analysis
After a strong run, OPEN has pulled back sharply (-13.7%) into a key support zone.
The green box marks a gap-fill + MA support area — often a spot for reactive bounces.
RSI is cooling off from overbought but still holding above midline → momentum not broken.
Chart annotation: “Fill the gap! MA/BOUNCE, just like Hims&Hers” — similar playbook seen in HIMS before a strong reversal.
📊 Levels to Watch
Support (gap/MA): $8.50–$9.00
Deeper Support: $5.87 → $5.20
Upside Targets:
$10.00 (first reclaim)
$13.27 (premium supply zone)
✅ Outlook
OPEN’s risk-reward improves here if $8.50–$9.00 holds. A bounce from MA support could target $10+ in the short term, and possibly extend toward $13.27 on momentum.
#OPEN #RealEstate #WaverVanir #GapFill #BounceSetup #TradingView

$open, you never go broke taking profitsLots of charts floating around showing NASDAQ:OPEN going to $20-25 and $84 (laughable - at least in the near term).
Open is likely to find resistance just above where we're at right now and then I think most of the people that longed calling for these highs will see a full round trip in their portfolios, because I think it's very likely that we go to test one of the bottom two supports before any move to $20+.
You never go broke taking profits.

9/11/25 - $open - good luck9/11/25 :: VROCKSTAR :: NASDAQ:OPEN
good luck
- you're going to need it
- spending too much time on social media taking other people's opinions about a stock you have followed for precisely 2 weeks?
- it was going to zero for a reason
- i wish you all the best in your journey to imaginary tendie town
V

Open is approaching a huge yearly fib. Be careful. Open has had a huge push up the past 2 months. Its been amazing to watch. For those that have been long, I would definitely recommend locking in some profits. Always have a runner position to hold for the long term. But we are at a huge level and It would make sense to see a rejection here. We might gain this level and then dump as well.
This will be a fun one to watch at these huge levels. The fib pull is my something I discovered that works very well as major levels.

OPEN - Opendoor Tech - PT $7.95OPEN is holding strong the Short Squeeze, showing Price Target Potential for $7.95 going into October (based on current bullish trend and angle/degree of increase.
With every New Friday, the squeeze becomes tougher and tougher to hold while also considering the expirations of options - Shorts exiting.
Interested to see where this lands
